NNoovvaa SSccoottiiaa Demographic - Economic Outlook 2011 2021 - Prepared For
←
→
Page content transcription
If your browser does not render page correctly, please read the page content below

Nova Scotia
Demographic - Economic Outlook
                 2011 - 2021

 Prepared For:                   Prepared By:

                                   Canmac
                               Economics Limited
                                  April, 2012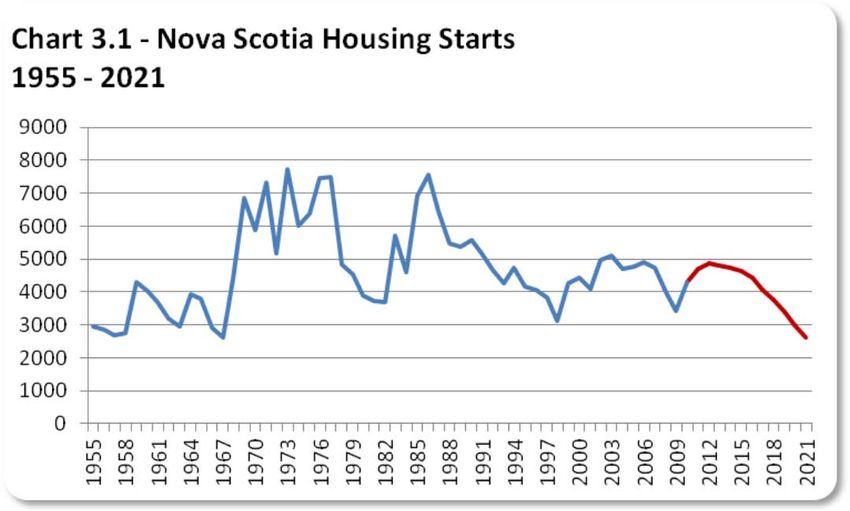
Nova Scotia Demographic - Economic Outlook 2011 - 2021

                SECTION 1 - NOVA SCOTIA TRADING PARTNERS

GLOBAL ECONOMIC ENVIRONMENT

The Global economy continued to exhibit a fragile recovery in 2011 – with rescue plans for
Greece and worries about Spanish banks adding to an uncertain recovery. Table 1.1
provides the latest World Bank Global Outlook (January, 2012). Overall world growth is
expected to reach 2.5 percent in 2012 and 3.1 percent in 2013. Thereafter one can expect
the next three years to exhibit growth in the 3.5 percent to 4.0 percent range as the world
economy moves from recovery to the normal phase of the business cycle.

                                           Table 1.1
                                  The Global Outlook Summary
Real GDP growth
                                                        2009        2010   2011e   2012f   2013f
World                                                    -2.3        4.1    2.7     2.5     3.1
 Memo item: World (PPP weights)                          -0.9        5.0    3.7     3.4     4.0
 High income                                             -3.7        3.0    1.6     1.4     2.0
     Euro Area                                           -4.2        1.7    1.6     -0.3    1.1
     Japan                                               -5.5        4.5    -0.9    1.9     1.6
     United States                                       -3.5        3.0    1.7     2.2     2.4
Developing Countries                                     2.0         7.3    6.0     5.4     6.0
    East Asia and Pacific                                 7.5        9.7    8.2     7.8     7.8
    Europe and Central Asia                              -6.5        5.2    5.3     3.2     4.0
    Latin America and Caribbean                          -2.0        6.0    4.2     3.6     4.2
    Middle East and N. Africa                             4.0        3.6    1.7     2.3     3.2
    South Asia                                            6.1        9.1    6.6     5.8     7.1
    Sun-Saharan Africa                                    2.0        4.8    4.9     5.3     5.6
Source: World Bank.
Notes: PPP = purchasing power parity, e = estimate, f = forecast.

                                                    2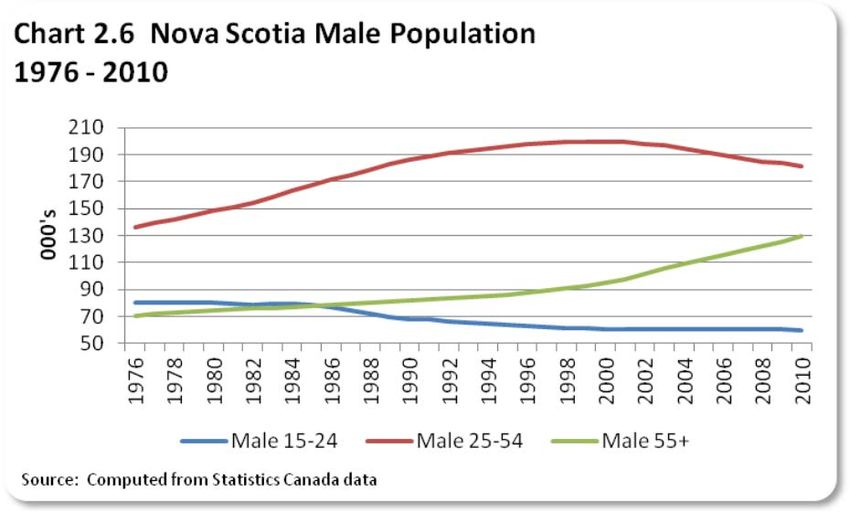
Nova Scotia Demographic - Economic Outlook 2011 - 2021

Both the U.S. and Canadian economy are showing signs of revival from the recent
recessionary period. The main forecast risk moving forward is for a high inflationary
period followed by high interest rates to curb inflation. To date the U.S. and Canadian
monetary policy authorities have been very accommodating.

The following assumptions are used in Canmac’s econometric simulation model to project
Nova Scotia’s economic outlook.

                                               2011   2012     2013    2014      2015
                                                                                -2021
Canadian GDP % Growth                          2.5     2.6      2.6     3.1      3.1
US GDP % Growth (2002 $billions)               1.7     2.2      2.4     3.1      3.1

                                           3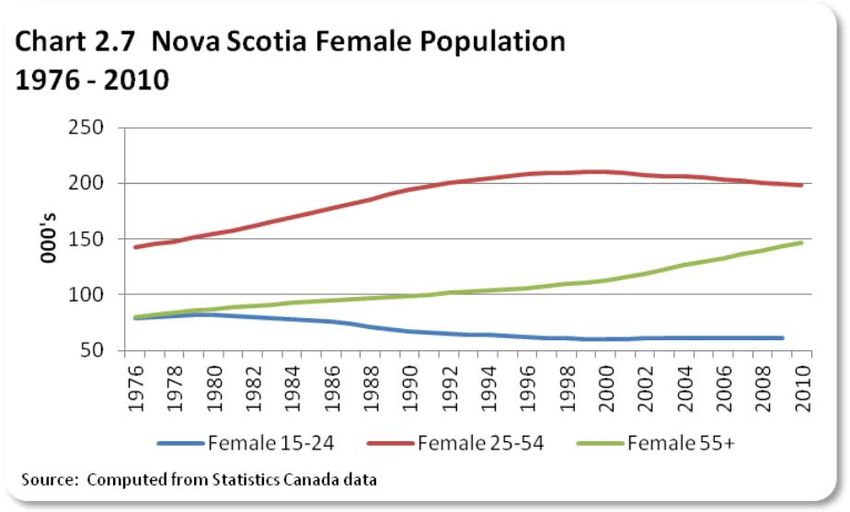
Nova Scotia Demographic - Economic Outlook 2011 - 2021

                       SECTION 2 - NOVA SCOTIA OUTLOOK
                          GEARING UP FOR PROSPERITY
In 2010, the Nova Scotia
economy stood at 945,000
persons.   The economy had
an economic output (Real
GDP millions of $2002) of
$29,951 and employed 452
thousand    persons.       The
inflation rate was 2.2 percent
and the unemployment rate
was 9.3 percent. Historically,
the Nova Scotia economy has
underperformed relative       to
the Canadian economy. Charts
2.1 to 2.3 show that Nova
Scotia’s average GDP growth

has been 1.3 percent compared
to the average of all Canadian
provinces of 1.5 percent. Nova
Scotia’s   personal    disposable
income per capita in 2010 was
$27,308 compared to the all
province average of $28,828.
Finally,     the       province’s
unemployment rate was 9.3 percent compared to the all province average of 8.6 percent.

                                              4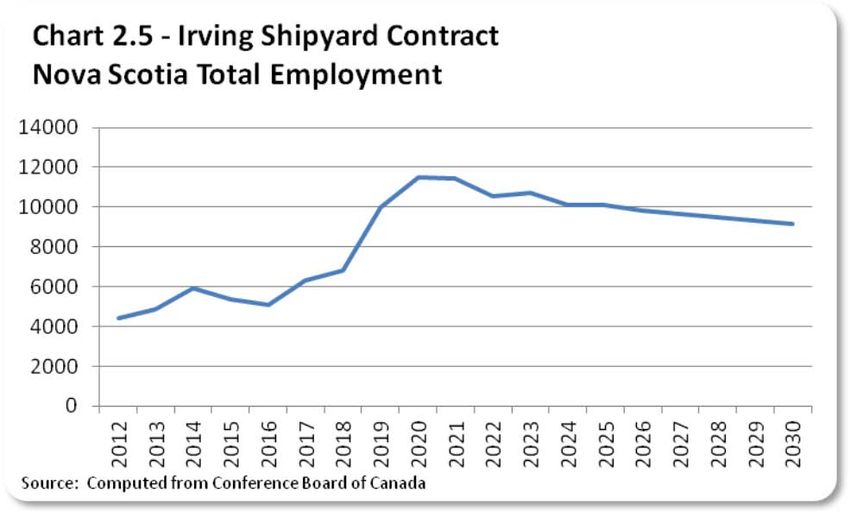
Nova Scotia Demographic - Economic Outlook 2011 - 2021

By 2021, Canmac projects that:

   •   the economy will grow to 34,522 ($2002 millions);
   •   the labour force will be 469.5 persons;
   •   the inflation rate will be 2.5 percent, and
   •   the unemployment rate will be 2.1 percent.

STRATEGIC DRIVERS ON THE DEMAND SIDE – TRADITIONAL MARKETS

Nova Scotia’s future economic success, like all small open economies, depends on the
success of its export markets. It is export markets that drive provincial prosperity by
earning income outside the
province’s boundaries that are
then respent in the domestic
market. Figure 2.1 shows the
province’s               exports
disaggregated into exports to
Canada       and   international
exports. The rest of Canada is a
slightly more important market
for Nova Scotia than the rest of
the world with 53.8 percent of total exports. Exports to the rest of Canada is dominated by
service exports (78.2 percent of total service exports) whereas international exports have
58.8 percent of total goods exports.      In addition to the official exports, it should be
mentioned that Nova Scotia has a high concentration of defence related establishments.
Nova Scotia has approximately 40 percent of all Canadian military assets. Hence, Nova
Scotia is also a high ‘exporter’ of defence services to the rest of Canada. Employment in this
sector totaled over 10,000 in 2010 (military personnel only).

                                               5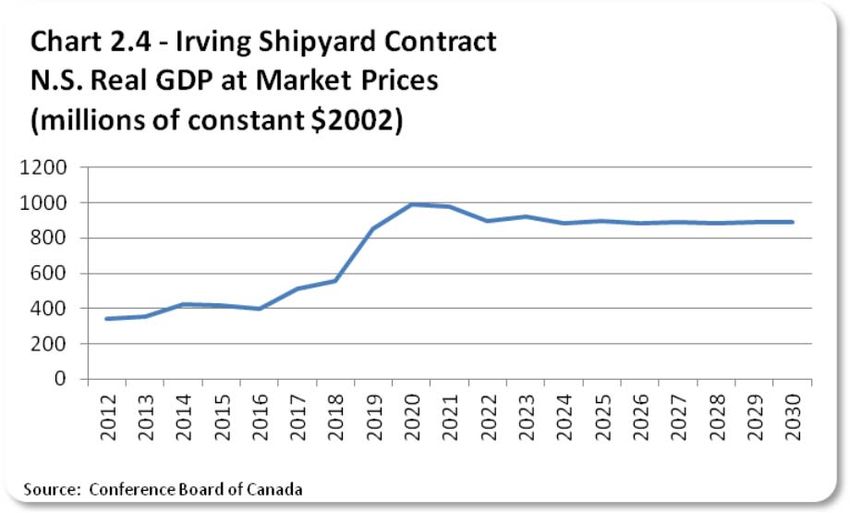
Nova Scotia Demographic - Economic Outlook 2011 - 2021

STRATEGIC DRIVER ON DEMAND SIDE - LARGE SCALE PROJECTS

Over the medium to long term, the Nova Scotia economy is poised for a major surge as its
traditional ‘export’ markets receive a major boost from large projects. There are many
exciting developments gathering momentum in the Nova Scotia economy. Some of the
major projects are:
   1) The $960 million Deep Panuke natural gas field is about to start production.
   2) A $25 billion Irving Shipyard federal shipbuilding contract is in the planning stages.
   3) A successful Shell bid of $971 million for offshore oil exploration rights was
       completed – the largest bid of its kind ever seen in Atlantic Canada.
   4) A joint venture between the Nova Scotia and Newfoundland and Labrador
       governments to develop a hydro project on the lower sector of the Churchill River in
       Labrador will help boost investment and provide jobs for Nova Scotians between
       2013-16. The $6.2 billion Lower Churchill Power Project includes a 180-kilometre,
       subsea transmission cable costing $1.2 billion that will bring hydro electricity to
       Cape Breton, Nova Scotia.

The total amount of new projects is impressive. Currently on the province’s books are
major projects (over $300 million) in the following categories:
   •   Shipbuilding, Energy, Oil & Gas Exploration and Development – $27.5+ billion.
   •   Residential Development - $3.5+ billion.
   •   Infrastructure and Education - $0.9+ billion.

In addition, there are other major projects (over $300 million) either nearing approval or
under active consideration. These include:
    • Energy Related - $2.4+ billion.
    • Infrastructure and residential - $2.2+ billion.

Appendix A provides a more detailed listing of these projects.

                                              6
Nova Scotia Demographic - Economic Outlook 2011 - 2021

LARGE PROJECT ECONOMIC IMPACTS

The potential economic impacts of these large capital projects will have a significant
positive impact on Nova Scotia in the coming years. The Deep Panuke natural gas project is
scheduled to come on stream in 2012 and provide direct employment of 200 workers and
pump $150 million per year into the economy. The Shell exploration project will provide
direct employment during the exploration phase but the real payoff will come with the
potential development of further oil and gas in the offshore. The Lower Churchill project is
expected to provide over 1,200 jobs to the Nova Scotia economy during the construction
phase.

The major economic impact for the Nova Scotia economy will be the construction of
Canada’s combat vessels at the Irving Shipyard in Halifax.

ECONOMIC IMPACT – IRVING SHIPBUILDING CONTRACT

An economic impact assessment of the $25 billion Irving Shipyard contract was completed
by the Conference Board of Canada as part of the Irving Shipyard bid proposal. Chart 2.4
shows Nova Scotia real GDP emanating from the contract. As shown in the figure, output
increases beginning in
2012 at $344 million
greater than would be
the case without the
contract.    Thereafter
output         increases
steadily to a maximum
of almost $1 billion
($977) in 2021 and
stays over $800 million

                                             7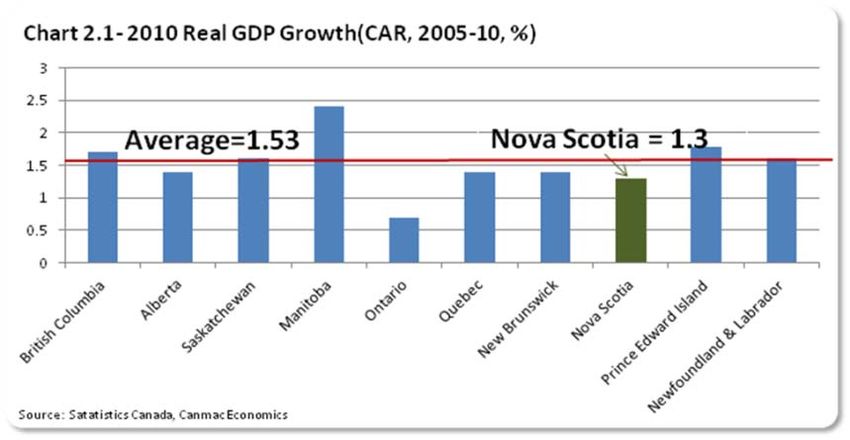
Nova Scotia Demographic - Economic Outlook 2011 - 2021

until the conclusion of the project in 2030. This output change is due to three effects, 1) the
direct project expenditures (less imports), 2) the respending of the project expenditures on
local suppliers, and 3) the respending by households in Nova Scotia on Nova Scotia goods
and services. In 2010, Nova Scotia’s real GDP was $29,951 million (2002$). It’s growth
from 2010 was 1.91 percent. To a first approximation, a 1 percent increase in Nova Scotia
real GDP implies a growth of $300 million (2002$). In 2012, the shipyard project will
increase GDP growth by 1.14 percent over and above that expected by forecasters before
the project award. This represents an almost doubling of the provincial forecast by what
was expected before the contract award.

Total employment increases resulting from the shipyard project are provided in Chart 2.5.
Employment will increase from 4,423 in 2012 and peak at 11,495 in 2020. Table 2.1 shows
the distribution of total employment in 2020. As expected, manufacturing has the majority
of employment opportunities. Interpretation of the Conference Board’s impacts suggests
that a major portion
of         employment
opportunities      will
come not from the
existing      resident
labour force but new
additions     to   the
labour force (which
occurs by decreasing
out migration or by
in migration).

                                              8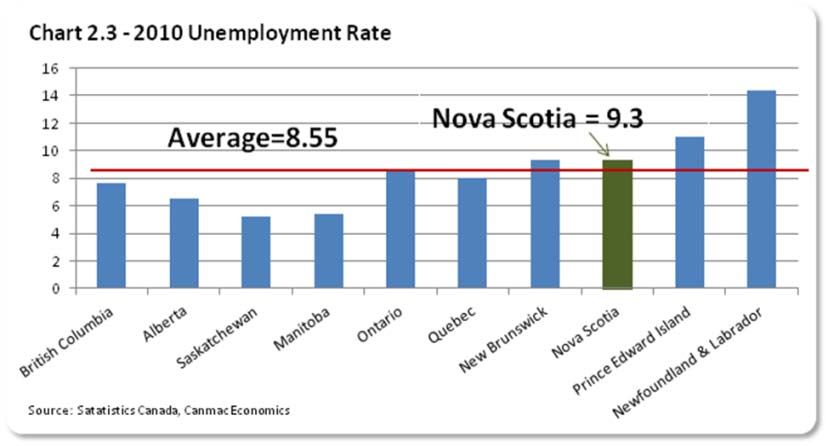
Nova Scotia Demographic - Economic Outlook 2011 - 2021

                        Table 2.1 – Irving Shipyard Contract
                 Nova Scotia Distribution of Total Employment 2020
             Industry                                         Distribution
             Total employment                                    11,495
             Agriculture & other primary sector                    34
             Manufacturing                                       7,397
             Construction                                         353
             Utilities                                             50
             Transportation & warehousing                         127
             Wholesale and retail trade                          1,171
             Finance, insurance and real estate                   240
             Other commercial service industries                 2,040
             Public administration & defence                       84
             Unemployment                                        -5,095
             Source: Conference Board of Canada

STRATEGIC DRIVER ON THE DEMAND SIDE – FEDERAL GOVERNMENT TRANSFERS

The other key demand driver for the Nova Scotia economy is federal government transfers.
On balance, more comes into the province than leaves in taxes. In 2009, the Federal
government spent $12.2 billion and had revenues of $5.0 billion in Nova Scotia.        In
particular, transfers for Canada pension payments and old age security will rise over the
forecast period and provide an important stimulus to consumer expenditures.

STRATEGIC DRIVERS ON THE SUPPLY SIDE – DEMOGRAPHICS

It has been said that demographics explains 2/3 of everything. Accordingly, we have
conducted a simulation projection with the Canmac Demographic Model. The overall
assumptions follow historic trends with the exception of migration.

                                              9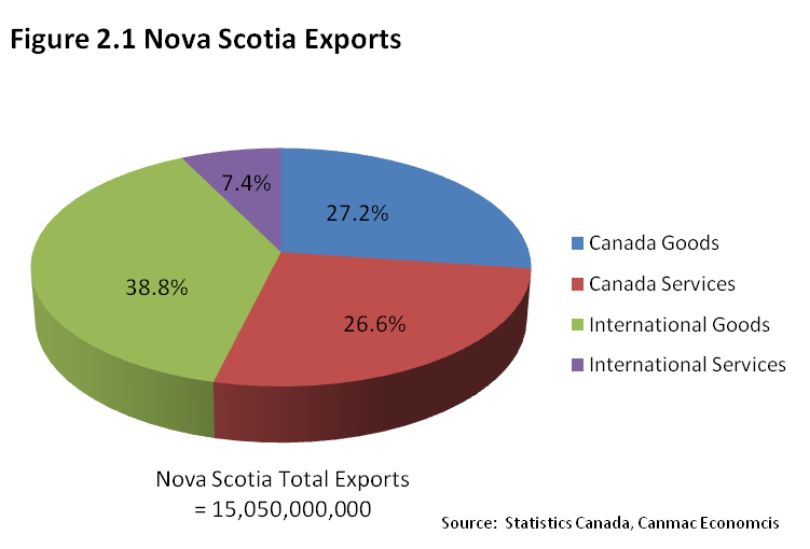
Nova Scotia Demographic - Economic Outlook 2011 - 2021

The overall demographic
assumptions are 1) a
fertility rate of 1.6 and 2)
a net in-migration rate of
2,000 persons per year.
These         assumptions
reflect historic fertility
rates   and    a     modest
increase in net migration
to reflect attraction of
workers for the Shipyard
contract and an increased
emphasis        by        the
provincial government to
attract new migrants. A
major    feature     of   the
demographic        landscape
is the contracting of the
population cohorts for
males and females 15-24
and 25-54 age groups. As shown in Charts 2.6 and 2.7 these age cohorts started declining
in the mid 1990’s and continue to do so. In contrast, the 55+ age group has been growing.

Nova Scotia labour productivity – Real GDP per employee has averaged 1 percent growth
over the historic period 1990 – 2010. There will be added pressure over the forecast
period to counter the shrinking labour force. In our base case forecast we assume labour
productivity will rise to 1.25 percent per year to overcome the potential labour supply
shortage.

                                            10
Nova Scotia Demographic - Economic Outlook 2011 - 2021
BASE CASE MACRO FORECAST
In summary, Nova Scotia’s economic drivers are:
Driver Outlook
Export of Good & Services Traditional exports and services
slowing growth due to slow growth in
major trading partners U.S. and the rest
of Canada.
Upside potential for new markets in fast
growing South East Asia.
Strong resurgence in shipbuilding
markets and strong upside potential in
oil and gas.
Defence Expenditures Excluding shipbuilding, defence
expenditures will exhibit modest belt
tightening.
Federal Government & Corporate Transfers Rise in pensions, etc. from ageing
population.
Fall in employment insurance as
unemployment rate falls.
Demographics In-migration up and fertility rate 1.6.
11Nova Scotia Demographic - Economic Outlook 2011 - 2021
Based on these assumptions and conducting simulations with Canmac’s proprietory
demographic – econometric macro model we find that:
• Overall Nova Scotia
population (census
adjusted) will grow from
945,206 in 2011 to 946,229
by 2021.
• Labour force population for
the core labour force (15-64)
will decrease from 647,595
in 2011 to 596,699 by 2021.
• The population 65+ will make
up an increasing share of the
total population from 162,780
in 2011 to 227,158 in 2021.
12Nova Scotia Demographic - Economic Outlook 2011 - 2021
Chart 2.11 GDP at 2002 Prices
Over the forecast period 2011 to %Change
2021 the Nova Scotia economy 2.5
2
will exhibit GDP growth in the 1.5 Average 1.35
1.5
percent range to 2016 and as the
1
Shipyard contract slows down
0.5
growth will slow to 1.1 percent. 0
2010
2011
2012
2013
2014
2015
2016
2017
2018
2019
2020
2021
Inflation rates, which are the
Source: Satatistics Canada, Canmac Economics
consequence primarily of inflation
Chart 2.12 - Nova Scotia Unemployment Rate
in its trading partners will remain
12
low – in the 2.5 percent range. 10
The unemployment rate will fall 8
6
over the period reaching 2.1
4
percent by 2021.
2
0
The major forecast result and
2010
2011
2012
2013
2014
2015
2016
2017
2018
2019
2020
2021
strategic challenge over the Source: Satatistics Canada, Canmac Economics
forecast period is that the Nova Chart 2.13 - Nova Scotia CPI
Scotia economy’s growth is labour % Change
3
constrained. The economy has the 2.5
demand potential to reach higher 2
1.5
levels of growth but will be 1
constrained by available labour 0.5
0
supply.
2010
2011
2012
2013
2014
2015
2016
2017
2018
2019
2020
2021
Source: Satatistics Canada, Canmac Economics
13Nova Scotia Demographic - Economic Outlook 2011 - 2021
Labour supply can be increased by three generic methods: 1) increase in migration, 2)
increase in productivity, and 3) increase in labour force participation rates. Hence over the
forecast period, these will be the three policy priorities as businesses seek to increase
production and governments seek to raise revenues to overcome the demands for health
care from retiring baby boomers, etc.
The major message coming from the forecast simulations is the major structural change in
the provincial economy – moving from a weak demand potential to a constrained supply
potential. Historically, the province has had surplus labour. It is now entering a period of
constrained labour. The provincial economy does not achieve its demand potential
because it will lack the productive capacity to deliver the goods and services that are
demanded under this scenario, there are upside risks to higher inflation rates as wage
pressure builds. However, wage rates will make the province uncompetitive if not
accompanied by productivity. The net results of this is a long period of stagnation – not
unlike the Japanese experience.
An alternative scenario is possible – an era of high growth and modest inflation. The
demand for the province’s goods and services have the potential to be realized if
productivity growth is achieved.
14Nova Scotia Demographic - Economic Outlook 2011 - 2021
SECTION 3 – NOVA SCOTIA RESIDENTIAL OUTLOOK
Nova Scotia’s residential sector is expected to show modest and then slow growth over the
forecast period. Bright spots in the market will be upscale homes and new home
construction for the Halifax market.
Nova Scotia’s residential sector is driven by demographics first and foremost and then by
income levels. The young adult population is the most important source of household
growth and in the coming decades, as the number of Nova Scotians in this age group
diminishes then so will the overall demand for housing. Table 3.1 shows headship rates
from the 2006 census data. Applying these to the Canmac population forecasts provides a
projection of future household levels. These are provided in Chart 3.1.
Table 3.1
Nova Scotia Headship Rates
Age Population Households Headship
Rate
18-24 80,715 14,315 0.177352
25-34 105,225 49,195 0.467522
35-44 136,640 73,255 0.536117
45-54 148,900 82,640 0.555003
55-64 119,815 68,670 0.573134
65-74 73,300 46,260 0.631105
75+ 64,915 42,510 0.654856
Source: Computed from Statistics Canada
15Nova Scotia Demographic - Economic Outlook 2011 - 2021
Housing starts in any given year depend on the projected household levels and the general
state of the economy in a given year. Two additional sources for new housing starts not
captured by headship rates are, 1) vacation homes and 2) population shifts within the
province. The vacation home market is a growing market in Nova Scotia as the resident
population with rising incomes acquire a vacation home. In addition there is a growing
market from non-residents building a second home in the province.
The growth in the Halifax Region has resulted in a vibrant demand for new housing. The
latest census data show strong growth in the Halifax Region and surrounding areas. Halifax
County grew by 4.7 percent and Hants county by 2.7 percent.
16Nova Scotia Demographic - Economic Outlook 2011 - 2021
Table 3.2 Population Growth
Nova Scotia Counties 2006 – 2011
County 2006 Census 2011 Census % Change
Annapolis 21,438 20,756 -3.2
Antigonish 18,836 19,589 4
Cape Breton 105,928 101,619 -4.1
Colchester 50,023 50,968 1.9
Cumberland 32,046 31,353 -2.2
Digby 18,992 18,036 -5
Guysborough 9,058 8,143 -10.1
Halifax 372,858 390,328 4.7
Hants 41,182 42,304 2.7
Inverness 19,036 17,947 -5.7
Kings 60,035 60,589 0.9
Lunenburg 47,150 47,313 0.3
Pictou 46,513 45,643 -1.9
Queens 11,212 10,960 -2.2
Richmond 9,740 9,293 -4.6
Shelburne 15,544 14,496 -6.7
Victoria 7,594 7,115 -6.3
Yarmouth 26,277 25,275 -3.8
Statistics Canada Census Profile 2011 Catalogue no. 98-316-XWE. Ottawa.
Released February 8, 2012.
Canmac’s Econometric Model predicts housing starts to average 4,087 units over the 2011
to 2021 period. Overtime, the changing demographics will trend the housing starts down
so that by the end of the forecast period, housing starts will be 2,617 compared to the 2011
value of 4,695.
While the overall trend for new housing is down, it is likely that over the medium term,
there is an increase in demand for the higher end market since the 55+ cohort is a growing
segment of the population. However as this age cohort moves up in average age there will
likely be a trend to downsize and of course ultimately to senior housing.
17Nova Scotia Demographic - Economic Outlook 2011 - 2021
Appendix A – Major Projects
18Nova Scotia Demographic - Economic Outlook 2011 - 2021
MAJOR PROJECTS
A review of existing and proposed major capital projects in Nova Scotia provides the basis
for a solid economic performance over the medium term. The major projects are centered
around Nova Scotia ocean industry cluster – shipbuilding and offshore oil and gas
exploration.
SHIPBUILDING
1) Combat shipbuilding - $25 billion, 2012 – 2030
The Irving Halifax Shipyard was awarded the $25 billion contract to construct
Arctic/offshore patrol ships and Canadian surface combatants ships.
2) Frigate Modernization and Life Extension Contract
The Halifax Shipyard was awarded one of two contracts to upgrade the Halifax class
patrol frigates for the Canadian navy. The modernization will include a new
command and control system, new radar capability, a new electronic warfare
system and upgraded communications and missiles. Separate refit and stand-alone
projects will include installation of new mechanical systems and modifications to
accommodate the new Cyclone helicopters and new military satellite
communications system.
OFFSHORE OIL AND GAS EXPLORATION
1) Deep Panuke Natural Gas Development, 2008 - 2012
First gas from EnCana’s $960 million project near Sable Island is planned for the
fourth quarter of 2011. The delivery of the production field centre (PFC) by Single
Buoy Moorings Inc. (SBM) is expected in late June with hook-up and commissioning
in the third quarter. SBM was awarded the contract to construct and operate the
$350 million PFC (which is not included in the $960 million construction cost). The
PFC will be leased by EnCana for the duration of operations at Deep Panuke. Irving
Shipbuilding delivered a $60 million supply boat for the project in February that will
also be leased for the project. Work highlights for 2011 include: the return of UK-
based Subsea 7 (formerly Acergy) who will install the subsea lines to the PFC,
Tideway of the Netherlands will begin rock placement operations on the flowlines
and the gas export pipeline and Aecon Fabco of Nova Scotia will continue to work on
protection structures for various components of the project. Natural gas reserves
19Nova Scotia Demographic - Economic Outlook 2011 - 2021
are estimated to be 632 billion cubic feet with production peaking at 300 million
cubic feet per day. Repsol YPF, the lead partner in the Canaport LNG project in Saint
John, signed a deal in 2009 to purchase all the gas produced from Deep Panuke.
2) Shell Canada Offshore Exploration Program - $97 million, 2013 – 2022
Shell Canada has successfully bid on a set of offshore permits totaling $971 million
which will see survey work starting in 2013.
Other major projects (over $300 million) are:
• Bedford West Development - $1 billion, 2008 – 2027
• The Ravines of Bedford South - $600 million, 2003 – 2017
• King’s Wharf Waterfront Development - $500 million, 2010 – 2017
• Sydney Tar Ponds Clean-up - $400 million, 2005 – 2014
• Russell Lake West Development - $400 million, 2005 – 2013
• Portland Hills - $370 million, 2000 – 2016
• Gas Tax Funding for Municipalities - $335 million, 2007 – 2014
• School Construction Program - $307 million, 2009 – 2015
• Dalhousie University Capital Projects - $304 million, 2008 – 2013
• Bedford Common Development - $300 million, 2006 – 2017
• Hubbards Residential Development - $300 million, 2010 -2017
In addition, there are a number of large projects (over $300 million) nearing approval:
• Shell Canada Offshore Oil and Gas Exploration - $971 million
• Maritime Link Power Transmission Line - $600 million, 2013 – 2016
• Wind Power Expansion - $500 million, 2013 – 2014
• Halifax Convention Centre - $500 million, 2011 –
• Donkin Coal Mine Development - $350 million, 2011 – 2013
Large projects (over $300 million) under active consideration:
• Forest Lakes Country Club - $1 billion
• Strait Area Container Terminal - $475 million
• Bayer’s Lake Business Park Expansion - $300 million
20Nova Scotia Demographic - Economic Outlook 2011 - 2021
APPENDIX B – FORECAST TABLES
21Demographic Indicators
Year 2011 2012 2013 2014 2015 2016 2017 2018 2019 2020 2021
Population 0-14 134,831 132,733 130,917 129,416 127,698 126,555 125,513 124,667 123,787 123,113 122,372
Population 15-64 647,595 643,810 639,644 635,609 631,702 626,983 622,174 616,746 610,526 603,647 596,699
22
Population 65+ 162,780 169,851 176,798 183,093 189,258 195,411 201,307 207,348 213,928 220,644 227,158
Total Population 945,206 946,394 947,359 948,118 948,658 948,949 948,994 948,762 948,241 947,403 946,229
Households 403,874 407,069 410,031 412,957 415,788 418,412 420,671 422,781 424,590 426,143 427,481
Housing Starts 4,750 4,944 4,891 4,836 4,738 4,538 4,168 3,853 3,462 3,061 2,681
Source: Canmac Demographic - Economic Model
Nova Scotia Demographic - Economic Outlook 2011 - 2021Nova Scotia Demographic - Economic Outlook 2011 - 2021
23Nova Scotia Demographic - Economic Outlook 2011 - 2021
24Nova Scotia Demographic - Economic Outlook 2011 - 2021
25Nova Scotia Demographic - Economic Outlook 2011 - 2021
26Nova Scotia Demographic - Economic Outlook 2011 - 2021
27Nova Scotia Demographic - Economic Outlook 2011 - 2021
28Nova Scotia Demographic - Economic Outlook 2011 - 2021
APPENDIX C – HALIFAX SHIPYARD IMPACT
29Nova Scotia Demographic - Economic Outlook 2011 - 2021
Table C1 – Halifax Shipyard Project
Nova Scotia Key Economic Indicators
Year Real GDP at market Labour Force Employment
prices (millions of
constant (2002$)
2012 344 2,454 4,423
2013 352 2,708 4,880
2014 426 3,275 5,909
2015 417 2,973 5,354
2016 399 2,840 5,094
2017 514 3,531 6,337
2018 559 3,800 6,799
2019 854 5,543 9,966
2020 991 6,400 11,495
2021 977 6,393 11,419
2022 896 5,944 10,530
2023 923 6,083 10,728
2024 883 5,784 10,115
2025 893 5,795 10,080
2026 884 5,693 9,840
2027 887 5,629 9,666
2028 886 5,557 9,478
2029 887 5,496 9,311
2030 891 5,452 9,177
Source: Conference Board of Canada
30Table C2 - Halifax Shipyard Project - Incremental Employment
Year 2012 2013 2014 2015 2016 2017 2018 2019 2020 2021 2022 2023 2024 2025 2026 2027 2028 2029 2030
Total Employment 4,423 4,880 5,909 5,354 5,094 6,337 6,799 9,966 11,495 11,419 10,530 10,728 10,115 10,080 9,840 9,666 9,478 9,311 9,177
Agriculture & other primary sector 39 33 28 15 3 15 12 36 34 22 11 20 12 17 21 27 33 38 46
Manufacturing 2,402 232 2,816 3,402 3,236 3,942 4,272 6,292 7,397 7,252 6,593 6,557 6,297 6,284 6,105 6,029 5,920 5,802 5,686
Construction 490 865 1,147 247 233 281 288 275 353 467 516 512 465 427 387 425 396 369 345
Utilities 26 23 23 19 17 26 27 46 50 45 37 41 36 39 38 39 39 40 40
31
Transportation & warehousing 86 109 112 114 117 113 115 114 127 120 171 188 173 125 132 81 84 87 96
Wholesale & retail trade 348 526 480 394 356 540 581 1,085 1,171 1,068 928 1,027 958 946 952 895 898 914 934
Finance, insurance & real estate 92 60 82 101 108 147 152 234 240 242 223 247 214 218 208 199 184 175 167
Other commercial service industries 909 902 1,146 992 931 1,203 1,270 1,815 2,040 2,089 1,914 2,019 1,845 1,903 1,888 1,888 1,846 1,817 1,801
Public administration & defence 31 60 75 70 93 70 82 68 84 114 137 116 114 121 99 86 77 70 63
Unemployment - 1,969 - 2,174 - 2,634 - 2,380 - 2,254 - 2,805 - 2,999 - 4,423 - 5,095 - 5,026 - 4,586 - 4,644 - 4,332 - 4,285 - 4,146 - 4,037 - 3,921 - 3,816 - 3,725
Source: Conference Board of Canada
Nova Scotia Demographic - Economic Outlook 2011 - 2021You can also read