AUDITED RESULTS For the year ended 31 May 2020 - Blue Label Telecoms

Page created by Rodney Morgan
 
CONTINUE READING
AUDITED RESULTS For the year ended 31 May 2020 - Blue Label Telecoms
AUDITED RESULTS
For the year ended 31 May 2020
AUDITED RESULTS For the year ended 31 May 2020 - Blue Label Telecoms
HIGHLIGHTS FOR THE 12 MONTHS
Ended 31 May 2020

 Revenue up 7% to R59.9 billion, incl. the gross amount                                                 Gross revenue*
                                                                                       70 000

                                                                          R'millions
  generated on PINless, electricity, ticketing, gaming and other                       60 000
                                                                                       50 000
 Gross profit of R2.12 billion
                                                                                       40 000
                                                                                       30 000
 GP margin improves from 9.21% to 10.05%
                                                                                       20 000
                                                                                       10 000
 Gross electricity revenue earned up 13% to R22.7 billion                                    -
                                                                                                  2016    2017       2018       2019    2020

 HEPS increases from negative 312.49 cps to positive 58.16 cps
                                                                                                          Gross Profit*
 Core HEPS increased from negative 304.77 cps to positive 62.71 cps                   2 500

                                                                          R'millions
                                                                                       2 000
 Sale of non-core assets complete
                                                                                       1 500

 Interest-bearing borrowings reduced to R2.3 billion from R3.2 billion                1 000

                                                                                        500
 Net cash generated from operating activities of R1.3 billion
                                                                                          -
                                                                                                  2016    2017      2018       2019     2020

   Business rationalised; balance sheet strengthened
                                                                                                         * From continuing operations

               AUDITED RESULTS for the year ended May 2020                                                                                     2
AUDITED RESULTS For the year ended 31 May 2020 - Blue Label Telecoms
Revenue, Debt and Cash Flow

 Despite a significant increase in debt levels during the 2018 financial year,                                                        Gross revenue
   with a consequent reduction in interest earned, there has been consistent                                           70 000

                                                                                                          R'millions
   growth in revenue. In the current year, cash flow has shown strong                                                  60 000

   improvement as interest-bearing borrowings have reduced.                                                            50 000

                                                                                                                       40 000

                                 Cash generation and interest-bearing debt                                             30 000
               3 500
  R'millions

                                                                                                                       20 000
               3 000

               2 500                                                                                                   10 000
               2 000
                                                                                                                           -
               1 500                                                                                                            2016    2017    2018   2019   2020
               1 000

                500

                  -
                        2016             2017                       2018                  2019     2020
                -500

                                   Cash generated from operations          Interest-bearing debt

                       AUDITED RESULTS for the year ended May 2020                                                                                                   3
AUDITED RESULTS For the year ended 31 May 2020 - Blue Label Telecoms
Covid–19 Impacts

 Blue Label has demonstrated relative resilience during lockdown due to
  essential nature of products and increasing digitisation of our distribution

 Covid-19 has had a people impact, not a technology impact

 Most of the company, incl. a fully functional Customer Interaction Centre,
  moved to working from home as soon as lockdown started

 Blue Label’s digital innovation has come to the fore with new digital products
  and services launched

 We have been pleased to note productivity increases as people strive to
  maintain relevance through innovative delivery

 The Group’s retail business was negatively impacted as a result of Covid-19,
  resulting in the decision to cease the operations of the WiConnect retail
  stores impacting the Group’s earnings by R318 million.

 Challenging economic conditions resulted in goodwill write-offs of R214
  million and other downward adjustments of R47 million

          The lifeblood of Blue Label is our technical prowess

                AUDITED RESULTS for the year ended May 2020                        4
AUDITED RESULTS For the year ended 31 May 2020 - Blue Label Telecoms
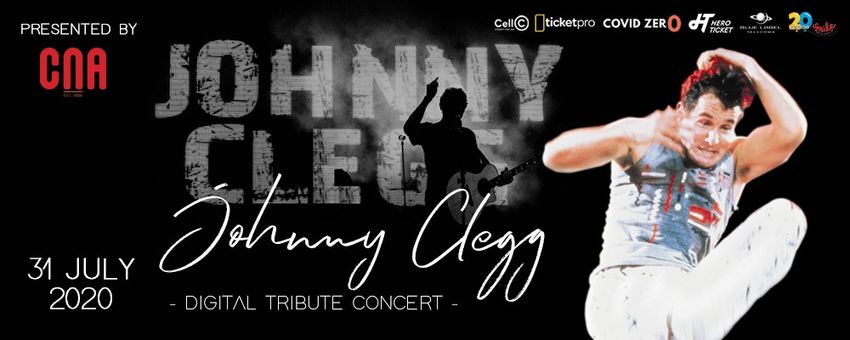
SA Distribution – Product Performance

 Revenue increased 7% to R59.7 billion, incl. the gross amount generated on
  PINless, electricity, ticketing, gaming and other

 Covid-19 negatively affecting retail sales, ticketing, gaming and starter pack                                  Revenue by product
                                                                                               25 000
  distribution

                                                                                   R'million
                                                                                               20 000
 WiConnect discontinued – negative impact of R318 million
                                                                                               15 000
 Digital purchasing delivering strong growth, magnified by Covid - trend expected
                                                                                               10 000
  to continue
                                                                                                5 000
 Core products - airtime, electricity continue migrating to digital channels
                                                                                                   -
 VAS products - growing strongly in retail, informal and petroleum channels                            Airtime   Airtime    Electricity   Ticketing   Gaming   Other
                                                                                                        offline   online

                                                                                                                    May-18     May-19      May-20
 Continue to expand bouquet of entertainment and ticketing products

 Money transfer products experience exceptional growth, especially in informal
  market

                 AUDITED RESULTS for the year ended May 2020                                                                                                            5
AUDITED RESULTS For the year ended 31 May 2020 - Blue Label Telecoms
SA Distribution – Channel Performance

 Formal retail and independents impacted by Covid-19 shut down

 Customer buying habits continue to evolve
                                                                                                                          Revenue by channel
 Corporate channel, including banking, continues to take market share                          30 000

                                                                                    R'million
  assisted by the move to digital purchasing
                                                                                                25 000

 Petroleum remains relatively stagnant and exposed to move to digital
                                                                                                20 000
  purchasing
                                                                                                15 000
 New national retail brands and financial institutions on board, will contribute
                                                                                                10 000
  in FY21
                                                                                                 5 000
 Lockdown did impact starter pack distribution but reach into
                                                                                                    -
  community/church groups improving                                                                       Formal Retail        Petroleum       Corporate   Independents

                                                                                                                           May-18   May-19   May-20
 Continue developing systems to secure quality customers, reduce churn and
  incentivise retention

 Customer Interaction Centre surveys indicate improved turnaround times and
  customer appreciation                                                                                 Increase product throughput in all channels

               AUDITED RESULTS for the year ended May 2020                                                                                                                6
AUDITED RESULTS For the year ended 31 May 2020 - Blue Label Telecoms
Informal Market
    Financial inclusion remains Blue Label’s driving philosophy
                                                                                                           R1 600.00
 Informal traders increased 58%; base will continue to grow                                               R1 400.00

                                                                                                Millions
                                                                                                           R1 200.00
                                                                                                           R1 000.00
 Product mix movements showing growing importance of VAS & financial services
                                                                                                            R800.00
                                                                                                            R600.00
 Launched:                                                                                                 R400.00    Actuals YTD - F19
      • RINGAS - a universal prepaid airtime voucher capable of redemption on any of the four               R200.00    Actuals YTD - F20
        major South African mobile networks. Providing consumers flexibility                                    R-


      • BLU VOUCHER - a single secure prepaid voucher allowing consumers to pay, deposit
        and top up their accounts with any of our online partners

 Pro-active customer support from the Customer Interaction Centre

 Identify opportunities through analysis of merchant trading patterns

 Covid-19 did impact foreign traders who were unable to obtaining licenses to
    trade; appears to be easing

 Differentiating from competitors through technology, increased training and
    marketing support

                  AUDITED RESULTS for the year ended May 2020                                                                          7
AUDITED RESULTS For the year ended 31 May 2020 - Blue Label Telecoms
Comm Equipment Company

 Debt outstanding of R716m at 31 May 2020
 Decrease 57% from R1.7 billion at 31 May 2019
 Although debt has reduced by R950m year-on-year, CEC
 book has only reduced by R185m from R3.12bn at 31 May
 2019 to R2.94bn at 31 May 2020
 Strong collections and better deal structures from Cell C have
 led to improved book
 DSTV book has increased R94 million to R258 million

          AUDITED RESULTS for the year ended May 2020              8
AUDITED RESULTS For the year ended 31 May 2020 - Blue Label Telecoms
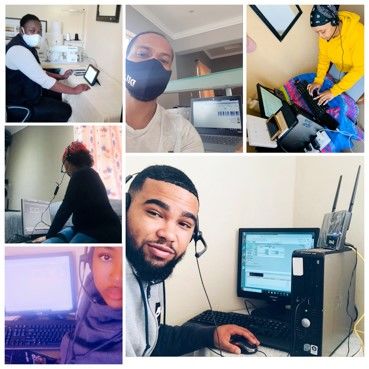
CELL C’S TURNAROUND STRATEGY IS DRIVING POSITIVE CHANGE

                1                                  2                                    3                                 4

        Liquidity Focus                     Network strategy               Operational Rationalisation            Recapitalisation

      Liquidity is in place.             Evolution of the capex           A cost efficiency programme.          Complex restructure.
                                     intensive, infrastructure based
                                       network to a aggregator of        Drop in customers but only 2%         Multiple stakeholders.
                                             infrastructure.                   decline in revenue.
Informal debt standstill, current                                                                                 Good progress.
  items on hold while debt is         Implementation of expanded         Operating model changes from
    restructured as a part of                                            build, own and run everything to   Final step will be term sheet.
                                        MTN roaming agreement
         capitalisation.               commenced 1 May 2020.             focused investment, partnering
                                     Transition will take 36 months.         and a buyer of services.

        Complete                            Complete                             Ongoing     ...                In progress

  CELL C OF THE FUTURE                          Lean             Agile          Responsive

             AUDITED RESULTS for the year ended May 2020                                                                                     9
AUDITED RESULTS For the year ended 31 May 2020 - Blue Label Telecoms
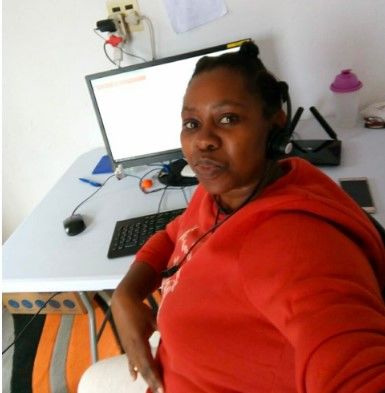
2020 Operational Overview
For June 2019 to May 2020

• A reduction in approximately a third of
  the customer base but only a 2%                                  2020     2019
                                                                                    % change
                                                                    R’m      R’m
  decline in service revenue.

• Resulting in a quality base of                        Service
                                                                  13 901   14 247       -2%
  subscribers.                                          revenue

• Not wasting commercial expenses to
  acquire customers that are not                        EBITDA     3 744    3 391       10%
  providing a return.

          AUDITED RESULTS for the year ended May 2020                                          10
Evolution of the customer base in pursuit of profitability

• We have been actively managing our customer
  base by pursuing more profitable customers.                                                    Service Revenue vs Total Subscribers

• This has resulted in a reduction in the Cell C          Million                                                 2019               2018               % change

  customer base. With a decline on 28% of the
  base, we have maintained and grown revenue

                                                           TOTAL SUBSCRIBERS

                                                                                                                                                                           SERVICE REVENUE
  based on the trend.

• Cell C removed non-profitable products and
  increased its focus on retail product pricing.

                                                                               Jun-19   Jul-19   Aug-19 Sep-19 Oct-19 Nov-19 Dec-19 Jan-20   Feb-20 Mar-20 Apr-20 May-20

                                                                                                              Service Revenue     Total Subscribers

            AUDITED RESULTS for the year ended May 2020                                                                                                                                      11
Cigicell                                                                                                                                                                                                                                                                                                            REVENUE COLLECTION       REVENUE PROTECTION

 Gross electricity sales continue to show resilience – increased 13% to R22.7 billion

 Covid-19 resulted in a strong March, April, May sales figures                                                                                                                                                                                                                                                                                  ELECTRICITY AND
                                                                                                                                                                                                                                                                                                                       PREPAID ELECTRICITY      WATER METER AUDITS
                                                                                                                                                                                                                                                                                                                        AND WATER SALES         AND REPLACEMENTS
 Launched Free Basic Electricity via zero-rated USSD and WhatsApp
 Revenue assurance – find, fix, replace - business gaining momentum:
    • 350 000 bill payments (via our own Cigicell direct contracts)
                                                                                                                                                                                                                                                                                                                        BILL PAYMENT AND
    • 10 500 residential prepaid meter installations                                                                                                                                                                                                                                                                       TRAFFIC FINE           CREDIT CONTROL
                                                                                                                                                                                                                                                                                                                                                     SERVICES
                                                                                                                                                                                                                                                                                                                           COLLECTION
    • 17 000 residential meter audits
    • 162 000 credit control actions
    • 10 000 indigent registrations                Gross sales
                                                                                                                                                                                                                                                                                                                                                  DATA CLEANSING
                              2 500                                                                                                                                                                                                                                                                                      ERP AND BILLING            GEOSPACIAL
                  R'million

                                                                                                                                                                                                                                                                                                                        SOFTWARE SERVICE             SERVICES
                              2 000

                              1 500

                              1 000                                                                                                                                                                                                                                                                                                                  INDIGENT
                                                                                                                                                                                                                                                                                                                         PROJECT FUNDING           REGISTRATION
                                                                                                                                                                                                                                                                                                                        ADVANCED REVENUE             SERVICES
                               500

                                 -
                                      Jul-15

                                                                 Jan-16

                                                                                            Jul-16

                                                                                                                       Jan-17

                                                                                                                                                  Jul-17

                                                                                                                                                                             Jan-18

                                                                                                                                                                                                        Jul-18

                                                                                                                                                                                                                                   Jan-19

                                                                                                                                                                                                                                                              Jul-19

                                                                                                                                                                                                                                                                                         Jan-20
                                                                          Mar-16

                                                                                                                                Mar-17

                                                                                                                                                                                      Mar-18

                                                                                                                                                                                                                                            Mar-19

                                                                                                                                                                                                                                                                                                  Mar-20
                                                        Nov-15

                                                                                                              Nov-16

                                                                                                                                                                    Nov-17

                                                                                                                                                                                                                          Nov-18

                                                                                                                                                                                                                                                                                Nov-19
                                               Sep-15

                                                                                                     Sep-16

                                                                                                                                                           Sep-17

                                                                                                                                                                                                                 Sep-18

                                                                                                                                                                                                                                                                       Sep-19
                                                                                   May-16

                                                                                                                                         May-17

                                                                                                                                                                                               May-18

                                                                                                                                                                                                                                                     May-19

                                                                                                                                                                                                                                                                                                           May-20
                                                                                                                                                                                                                                                                                                                                                   “SMART GRID”
                                                                                                                                                                                                                                                                                                                                                     SOLUTION

              AUDITED RESULTS for the year ended May 2020                                                                                                                                                                                                                                                                                                          12
Blue Label Data Solutions

 Covid-19 severely interrupted operations (no new sales in April & May) with 800+ call
  centre agents furloughed
                                                                                                          May 2020   May 2019
 Intensive efforts to assist call centre agents to work from home and slowly return to                      R’000      R’000
  office as lockdown eased                                                                    Revenue      189 104    203 238
 Currently, 526 agents work remotely, 400 back in office; in 12 months 50% - 65% of           EBITDA       40 330     37 786
  agents will be offsite
                                                                                          Core headline     40 910     43 563
 Greater use made of BluNova for intelligent data leads – new substantial contracts           earnings
  signed

 Deployed world leading decision engine called FICA

 BluNova now leading practitioner of data & decision science in SA

 Opt–In base (consumers consenting to receive marketing info) now at 28 million,

  growing 100 000 per month

 Strengthened in-house compliance and legal expertise dealing with POPIA, CPA etc

 Covid-19 forcing new acquisition methodologies and cost of acquisition reduction

                AUDITED RESULTS for the year ended May 2020                                                                 13
Ticketpro

 Ticketpro was on track to have its most profitable year – then Covid-19 struck, crippling
  the industry
 Despite this major setback, Ticketpro has used the time to rebuild and technically
  develop new and improved systems and infrastructure
 Continue to expand the largest ticketing footprint in SA
 Launched an online streaming events platform to maintain relevance
 Providing artists and fans a platform to share & enjoy content safely
 Covid Zero empowers entertainers and raises funds for charities to provide less
  fortunate South Africans with face masks, hand sanitizers and food parcels
 In November 2020, we launch South Africa’s first truly all in one fan based “experience”
  platform. Innovating the event industry
    • Online streaming
    • Cashless payment solutions
    • Wireless event-based connectivity
    • NFC transport technology making commuter travel safe and secure
    • More than 8 new innovative products on the platform

              AUDITED RESULTS for the year ended May 2020                                     14
Technology – Innovation and Digital Enablement

 Created digital capabilities – accelerated go-to-market strategies with digital transformation pipeline
    • Entrenching our entrepreneurial culture and agile practices has accelerated our ability to execute on strategic growth objectives

    • Innovative tokenized products deployed: food vouchers with cash redemption; virtual vouchers for partner redemption (BluVoucher)
      and airtime (Ringas) with consumer-ready digital redemption mechanisms (USSD, Online)

    • Expanded consumer convenience with universal bus flows and new carriers for long-haul bus transport

    • Hyperautomation and RPA technologies deployed to assist the merchant and consumer experience

    • Democratization of design: we expanded the software development stack with low-code, no-code application development functions to
      empower the citizen-developer to fast-track our go-to-market strategies
                                                                                                                      We are fintech specialists,
    • Employees fully enabled with digital remote working tools
                                                                                                                     enabling financial inclusion
 Continued expansion of our digital solution footprint                                                              through platform innovation

    • Active POPs (Points of Presence) in the main market, retail and petroleum channels grew by 5%

    • Consumer-enabling payment mechanisms launched into trusted consumer apps to purchase VAS products

    • Created the ability to white label our core technology offerings

    • Deployed consumer applications to specific communities with content and bespoke service requirements

                AUDITED RESULTS for the year ended May 2020                                                                                   15
Technology – Security, Risk and Compliance

 Specific concentration on scalability and platform refactoring
    ▪ Optimal scalability achieved for high-speed throughput
    ▪ Expanded hybrid-cloud strategy, enabling uptime of business-critical applications
    ▪ Infrastructure and software investments to improve stability and ensure future capacity in line with up- and downstream
    ▪ Simplified integration mechanisms deployed as restful APIs, on a roadmap towards an open integration gateway and marketplace

 Investments made into significant additional redundancy for improved stability and business continuity
    ▪ Activ Activ deployed
    ▪ Transactional success rates and uptime increased to beyond 99%
    ▪ Transactional volume growth sustained at over 20% p/a
    ▪ 71% reduction in production defects from prior years

 New framework for cyber security & governance – customer confidence
    • Security vigilance, POPIA, GDPR, ECT Act compliance and vulnerability checks entrenched into our

      approach to enable our data-driven business model

    • Technology roadmaps and strategy leveraging hyperscaling enterprise agreements

 Increased cyber security investments have resulted in a zero impact, reliable ecosystem of platforms in our landscape

                AUDITED RESULTS for the year ended May 2020                                                                          16
Financial Results May 2020
                  Dean Suntup
FINANCIAL
 HIGHLIGHTS                                                   EBITDA of
                              Revenue of
                                                              R1.21
                              R21.1                           billion
    Successful
  completion of               billion                     net of extraneous
the disposal of the                                         expenditure
Blue Label Mobile
  Group and the
 Handset division
   of 3G Mobile

                                                                               Net cash
                                           Increase in                      generated from
                                           gross profit                    operating activities
                                           margin from                             of
                                         from                                     R1.3
            Gross profit of             9.21%                                    billion
              R2.12                   to 10.05%
              billion
                                                                                                   Core headline
                                                           Interest-bearing                         earnings of
                                                              borrowings
                                                              reduced to
                                                                                                     86.13
                                                                                                   cents per share
                                                               R2.3                               net of extraneous
                                                                                                     expenditure
                                                              billion
                                                          (2019: R3.2 billion)
Income Statement
for the year ended 31 May 2020

                                                                               Extraneous                                  Extraneous
                                                                   Group         costs*         Remaining     Group          costs**      Remaining     Growth    Growth
                                                                  May 2020      May 2020        May 2020     May 2019       May 2019      May 2019     remaining remaining
                                                                   R'000          R'000           R'000       R'000           R'000         R'000        R'000      %
                  Revenue                                         21,135,326             - 21,135,326        23,602,264               - 23,602,264     (2,466,938)   (10%)
                  Gross Profit                                     2,124,611             - 2,124,611          2,173,685               - 2,173,685         (49,074)    (2%)
                  EBITDA                                             825,364     (387,754) 1,213,118            257,300     (1,066,437) 1,323,737        (110,619)    (8%)

                  Impairments on associates and joint venture              -                -            -   (2,639,564)    (2,639,564)            -             -
                  Share of profits/(losses) from associates and
                  joint ventures                                     16,598              -         16,598    (3,693,431)    (3,696,133)        2,702       13,896    514%
                     - Cell C                                              -             -               -   (3,609,496)    (3,609,496)            -            -
                     - Oxigen Services India                               -             -               -      (86,637)       (86,637)            -            -
                     - Blue Label Mexico                             (5,806)             -         (5,806)      (24,096)              -     (24,096)       18,290     76%
                     - Other                                         22,404              -         22,404         26,798              -       26,798      (4,394)    (16%)
                  Net profit/(loss) from continuing operations      226,786      (376,824)        603,610    (6,672,923)    (7,372,270)     699,347      (95,737)    (14%)

                  Core headline earnings                            562,132      (209,979)        772,111    (2,783,155)    (3,655,111)     871,956      (99,845)    (11%)
                    - from continuing operations                    469,113      (163,240)        632,353    (2,904,973)    (3,642,066)     737,093     (104,740)    (14%)
                    - from discontinued operations                   93,019       (46,739)        139,758        121,818       (13,045)     134,863         4,895      4%

                  Gross profit margin                                10.05%                        10.05%         9.21%                       9.21%
                  EBITDA margin                                       3.91%                         5.74%         1.09%                       5.61%

                  Weighted ave shares ('000)                        896,409                       896,409      913,208                      913,208
                  EPS (cents)                                         13.89                         82.04      (727.81)                       88.41         (6.37)    (7%)
                  HEPS (cents)                                        58.16                         81.58      (312.49)                       88.90         (7.32)    (8%)
                  Core HEPS (cents)                                   62.71                         86.13      (304.77)                       95.48         (9.35)   (10%)
                    - from continuing operations                      52.33                         70.54      (318.11)                       80.71
                    - from discontinued operations                    10.38                         15.59         13.34                       14.77

           AUDITED RESULTS for the year ended May 2020                                                                                                                       19
Extraneous costs
for the year ended 31 May 2019

** The predominant negative contributions to Group earnings
in the prior year were attributable to:

• Cell C’s trading losses, impairment of its property, plant
  and equipment, the impact of a derecognition of its
  deferred tax asset and the consequent impairment of Blue
  Label’s total investment therein(1);                                                                         Extraneous                     Fair value                             OSI
                                                                                                                  costs      Cell C (1)        losses (2)       Impairments (3) adjustments (4) WiConnect (5) Once-offs (6)
                                                                                                                May 2019     May 2019         May 2019            May 2019        May 2019       May 2019      May 2019
• fair value downward adjustments of the complete                                                                 R'000       R'000              R'000              R'000           R'000          R'000        R'000
  exposure relating to SPV1 and SPV2 and the Glocell
  loan(2);
                                                               EBITDA                                          (1,066,437)                -      (873,877)            (50,398)       (193,364)              -       51,202

• partial impairments of goodwill relating to Viamedia and     Impairments on associates and joint venture     (2,639,564) (2,521,152)                      -                -       (118,412)              -             -
  Blue Label Connect and a partial impairment of the           Share of profits/(losses) from associates and
  investment in the SupaPesa joint venture(3);                 joint ventures                                  (3,696,133) (3,609,496)                   -                   -        (86,637)              -            -
                                                                  - Cell C                                     (3,609,496) (3,609,496)                   -                   -               -              -            -
                                                                  - Oxigen Services India                         (86,637)           -                   -                   -        (86,637)              -            -
• an Impairment of Blue Label’s total investment in the        Net profit/(loss) from continuing operations    (7,372,270) (6,130,647)           (837,831)            (50,398)       (398,412)              -       45,018
  Oxigen India Group, including 2DFine Holdings Mauritius,     Core headline earnings                          (3,655,111) (2,616,427)           (837,831)                   -       (232,826)       (13,045)       45,018
  as well as providing for loan impairments and guarantees       - from continuing operations                  (3,642,066) (2,616,427)           (837,831)                   -       (232,826)              -       45,018
  payable thereon(4);                                            - from discontinued operations                   (13,045)           -                   -                   -               -       (13,045)            -

• expenditure within the Retail division of the WiConnect
  stores(5); and

• once-off expenditure and income(6).

               AUDITED RESULTS for the year ended May 2020                                                                                                                                                                    20
Extraneous costs
for the year ended 31 May 2020

*The predominant negative contributions to Group earnings
in the current year were attributable to:                                                                        Extraneous    Fair value                                         Once-offs
                                                                                                                    costs       losses (7)    Impairments   (8)
                                                                                                                                                                  WiConnect(9)       (10)

                                                                                                                  May 2020     May 2020         May 2020           May 2020       May 2020
• fair value downward adjustments of the Glocell loan and an
                                                                                                                    R'000         R'000           R'000              R'000         R'000
unrealised foreign exchange loss on the USD20 million
liquidity support provided to SPV2(7);
                                                                  EBITDA                                           (387,754)      (115,065)       (213,584)                   -     (59,105)
• impairments of goodwill relating to Blue Label Connect and      Net profit/(loss) from continuing operations     (376,824)       (96,481)       (213,584)                   -     (66,759)
a partial impairment relating to Glocell Distribution(8);
                                                                  Core headline earnings                           (209,979)       (96,481)                  -      (183,773)         70,275
                                                                    - from continuing operations                   (163,240)       (96,481)                  -              -       (66,759)
• extraneous expenditure within the Retail division as a result
                                                                    - from discontinued operations                  (46,739)              -                  -      (183,773)       137,034
of the closure of the WiConnect stores(9); and

• once-off expenditure and income(10).

                AUDITED RESULTS for the year ended May 2020                                                                                                                                    21
Revenue
for the year ended 31 May 2020

                                                      Group          Group
                                                     May 2020       May 2019      Growth         Growth
                                                      R'000          R'000         R'000           %

       Prepaid airtime, data and related revenue     33,875,843     32,347,879      1,527,964      5%
             - Prepaid airtime and data              18,842,481     20,780,969    (1,938,488)     (9%)
             - "PINless" airtime top-ups             15,033,362     11,566,910      3,466,452     30%
                                                                                                          • Group revenue generated by the continuing
       Postpaid airtime, data and related revenue       137,922        141,405         (3,483)    (2%)
       Prepaid & Postpaid SIM cards                     634,809        964,054      (329,245)    (34%)
                                                                                                            operations within the Group declined by 10% to
       Services                                         319,623        350,081        (30,458)    (9%)      R21.1 billion.
       Gross electricity revenue                     22,668,739     20,020,374      2,648,365     13%
             - Electricity commission                   358,728        347,538          11,190     3%     • As only the gross profit earned on PINless top-ups,
             - Gross electricity revenue             22,310,011     19,672,836      2,637,175     13%       prepaid electricity, ticketing and gaming is recognised
       Handsets, tablets and other devices              262,926        432,374      (169,448)    (39%)      as revenue, on imputing the gross revenue generated
       Finance revenue                                  378,839        427,753        (48,914)   (11%)      thereon, the effective growth in revenue equated to
       Gross ticketing revenue                          550,192        598,335        (48,143)    (8%)      7% from R56.0 billion to R59.9 billion.
       Gross gaming revenue                             931,737        643,359        288,378     45%
       Other revenue                                    129,489        112,898          16,591    15%

       Gross revenue                                 59,890,120     56,038,513     3,851,608      7%
       Less: imputed gross revenue                  (38,754,794)   (32,436,249)   (6,318,546)     19%
       Reported revenue                              21,135,326     23,602,264    (2,466,938)    (10%)

            AUDITED RESULTS for the year ended May 2020                                                                                                               22
Balance sheet
as at 31 May 2020

                                                               Group             Group         • Of the net decrease in intangible assets and goodwill of R1
                                                              May 2020          May 2019         billion, R682 million related to the disposal of the Handset
                                                               R'000             R'000           division of 3G Mobile and Blue Label Mobile, R151 million
 Non- current assets                                               2,357,620       3,477,070     to the amortisation of intangibles and R259 million to the
 Property, plant and equipment                                       198,688         237,657     impairment of goodwill
 Intangible assets and goodwill                                    1,215,096       2,318,323
 Investment in associates and joint ventures                         197,455         218,842   • The material net decline in current assets included
 Advances to customers                                               449,825         584,440     decreases in inventory of R938 million and trade and other
 Other non-current assets                                            296,556         117,808     receivables of R328 million, offset by increases in cash
                                                                                                 and cash equivalents of R629 million and advances to
 Current assets                                                    7,996,086       8,604,302
                                                                                                 customers of R200 million.
 Inventories                                                         576,950       1,514,649
 Trade and other receivables                                       3,929,743       4,257,266
                                                                                               • The stock turn from continuing operations equated to 11
 Advances to customers                                             1,232,250       1,032,657
 Other current assets                                                242,226         414,134
                                                                                                 days compared to 21 days for the financial year ended 31
 Cash and cash equivalents                                         2,014,917       1,385,596     May 2019.

 Total assets                                                     10,353,706     12,081,372    • The debtor’s collection period from continuing operations
 Capital and reserves                                              2,485,117       2,491,562     increased to 57 days compared to 50 days for the financial
 Non-current liabilities                                            208,689       1,951,920
                                                                                                 year ended 31 May 2019.

 Current liabilities                                               7,659,900      7,637,890    • Trade and other payables decreased by R760 million, with
 Trade and other payables                                           4,611,643      5,371,386     average credit terms from continuing operations equating
 Other current liabilities                                          3,048,257      2,266,504     to 80 days compared to 78 days for the financial year
 Total equity and liabilities                                     10,353,706     12,081,372      ended 31 May 2019.

                    AUDITED RESULTS for the year ended May 2020                                                                                                 23
Cash Flow
for the year ended 31 May 2020

                                                                                            • Cash generated from trading operations included working
                                                                                              capital movements comprising an increase in trade
                                                                                              receivables of R148 million, an increase in advances to
                                                                                              customers of R65 million and a decrease in trade payables
                                                              Group          Group
                                                                                              of R397 million, offset by a decrease in inventory of R795
                                                             May 2020       May 2019
                                                                                              million.
                                                              R'000          R'000
                                                                                            • Investing activities included a receipt of funds, net of cash
    Cash generated by operations                                1,702,491        431,287      disposed, amounting to R698 million from the disposal of
    Interest received                                              93,053          88,416     the 3G Mobile handset division and the Blue Label Mobile
    Interest paid                                               (214,166)      (231,131)      Group, proceeds on disposal of capital assets of R34
    Taxation paid                                               (324,553)      (369,086)      million, dividends received from associates and joint
    Cash flows from operating activities                        1,256,825        (80,514)     ventures of R6 million, offset by the purchase of intangible
    Cash flows from investing activities                          453,620        561,274      assets of R31 million, capital expenditure of R139 million
    Cash flows from financing activities                      (1,079,059)        (42,441)     and net loans granted of R127 million.
    Increase/(decrease) in cash and cash equivalents              631,386        438,319
    Cash and cash equivalents at the beginning of the year      1,377,753        947,888    • Cash flows utilised in financing included R902 million
    Translation difference                                          5,586         (8,454)     related to the net decrease in borrowings, dividend
                                                                                              payments of R67 million to non-controlling interests, lease
    Cash and cash equivalents at the end of the year            2,014,725      1,377,753
                                                                                              payments of R53 million, settlement of a financial
                                                                                              guarantee amounting to R44 million, treasury shares
                                                                                              acquired of R46 million, offset by R34 million from the
                                                                                              dilution of shares in a subsidiary.

              AUDITED RESULTS for the year ended May 2020                                                                                                     24
You can also read