Passenger Rail Usage: Quality and Methodology Report Contact information: ORR Data Portal
←
→
Page content transcription
If your browser does not render page correctly, please read the page content below

Passenger Rail Usage:
Quality and Methodology Report
03 June 2021

Contact information:
Responsible statistician: Tom Leveson Gower
Public enquiries: rail.stats@orr.gov.uk
Media Enquiries: Tel: 020 7282 2094

Contents
Introduction                                2

Data sources, methodology and definitions   3

Historical background                       10

Relevance                                   12

Accuracy and reliability                    13

Timeliness and punctuality                  16

Accessibility and clarity                   17

Coherence and comparability                 18

1
Introduction
This is a report on the quality of the quarterly Passenger Rail Usage statistical release and
associated data tables. It helps users to understand the quality of our statistics, and also
ensures ORR is compliant with the three quality principles in the Code of Practice for
Official Statistics - Q1: Suitable data sources, Q2: Sound methods, and Q3: Assured
quality. This report also provides information on the methodology and data sources used
to produce the statistics.

This report covers the following areas:

    ●   Data sources, methodology and definitions – detail on the various data sources,
        methodology used to compile the statistics, and definitions;

    ●   Historic background – a background to rail usage statistics and details of any
        changes throughout the time series;

    ●   Relevance to users – the users of the statistics, and our engagement;

    ●   Accuracy and reliability – the accuracy, data coverage and quality assurance of the
        statistics;

    ●   Timeliness and punctuality – our timescales for the production and publication of the
        statistics;

    ●   Accessibility and clarity – the format of our statistics and where they can be found;

    ●   Coherence and comparability – similar statistics published elsewhere and the degree
        in which the statistics can be compared over time.

Rail usage data on passenger services are supplied by a number of different sources and
are measured using a range of metrics: passenger kilometres, journeys and revenue, and
passenger train kilometres. These are covered in detail in the methodology section.

2
Data sources, methodology and
definitions
The data contained within the release and the data tables are sourced from:
● LENNON system – most of the data contained within the statistical release are
sourced from the rail industry’s LENNON (Latest Earnings Networked Nationally Over
Night) ticketing and revenue system, for which the ORR has an access agreement.
● Non-LENNON data – five train operators provide data to ORR detailing the number
of passenger journeys and kilometres that are recorded outside of the LENNON
system. These include journeys on tickets such as operator specific tickets and
Passenger Transport Executive (PTE) multi-modal tickets. These are referred to as
non-LENNON data. Most of the revenue associated with such journeys is captured
by the LENNON system. These data are provided to the ORR as part of
memorandums of understanding between the ORR and TOCs.
● London Overground train load data – passenger journey and kilometre estimates
for this operator are aligned to data captured by a train load weight system.
● Network Rail – passenger train kilometres are derived from Network Rail’s Track
Access Billing System (TABS), which Network Rail use to bill train operators. TABS
captures the actual train distance operated on Network Rail’s infrastructure.
Kilometres travelled on other infrastructure, such as London Underground, are not
included in the data. These data are provided to the ORR as part of a data protocol
agreed with Network Rail.
Passenger train kilometres for Heathrow Express have been estimated between
2013-14 Quarter 1 to 2017-18 Quarter 4, as they were not billed through TABS.
Heathrow Express have since been billed through TABS for their electricity usage.
● Department for Transport – data for the years 1938 to 1985-86 in Tables 1220
(annual passenger journeys) and 1230 (annual passenger kilometres) are sourced
from the DfT (see Table RAI0101).
● National Infrastructure Commission – data for the years 1872 to 1937 in Tables
1220 (annual passenger journeys) and 1230 (annual passenger kilometres) are
sourced from the National Infrastructure Commission (sourced from: Mitchell, B.R.
British Historical Statistics. Cambridge: Cambridge University Press, 2011. Print. pp.
545-547, 1843-1938 Railway Returns).
3Definitions
● Passenger journeys are estimated based on travel from an origin station to a
destination station. For the purpose of these statistics, where travel includes one or
more changes of train, each train used is counted as one journey. For example, a
journey from Leicester to Manchester would be classed as two journeys due to the
need to change trains. This differs from the definition used in the Regional Rail
Usage statistical release, which would class this example as one journey.
● Passenger kilometres are calculated by multiplying the number of passenger
journeys on a particular flow by the number of corresponding track kilometres
between stations.
● Passenger revenue statistics include all ticket revenue and miscellaneous charges
associated with passenger travel on national railways.
● Passenger train kilometres refers to the number of train kilometres (million)
travelled by revenue earning passenger trains, sourced from Network Rail’s Track
Access Billing System (TABS). It replaced timetabled train kilometres in 2015-16 Q3.
Train kilometres run on other infrastructure, such as London Overground, are not
included. TABS still covers the Core Valley Lines, which were transferred to Amey
Keolis Limited (AKIL) on 28 March 2020, so data remain comparable over time.
● The data presented in this release are for mainline operators in Great Britain. The
data do not include Eurostar, London Underground, light rail, heritage and charter
services. Franchised operators run services as part of contracts awarded by
government. Data for such operators are also presented for three sectors:
o London and South East – based on the British Rail Network South East
services, this sector includes commuter trains in the London area and inter-urban
services in South East England. It extends as far west as Bristol and Exeter (both
South Western Railway) and as far northwest as Kidderminster (Chiltern
Railways). The following operators are included (all services unless stated):
- Greater Anglia
- c2c
- Chiltern Railways
- Great Western Railway (London and Thames Valley services)
4- Govia Thameslink Railway
- London Overground
- Southeastern
- South Western Railway
- TfL Rail
- West Midlands Trains (London Euston to Milton Keynes/Northampton,
Watford to St Albans Abbey, and Bletchley to Bedford)
o Long Distance – based on the British Rail InterCity services, this sector covers
long distance services on the East Coast, West Coast, Midland, and Great
Western mainlines. The following operators are included (all services unless
stated):
- Avanti West Coast
- CrossCountry
- East Midlands Railway (services to and from London St Pancras)
- Great Western Railway (London Paddington to Bristol, Devon, Cornwall,
South Wales, and The Cotswolds
- London North Eastern Railway
o Regional – based on the British Rail Regional Railways services, this sector
covers other services. The following operators are included (all services unless
stated):
- Caledonian Sleeper
- East Midlands Railway (except services to and from London St Pancras;
includes the Liverpool to Norwich service as well as local services in and
around Derby, Nottingham, Lincoln and Newark)
- Great Western Railway (includes the Cardiff to Portsmouth service as well
as local services in the West of England)
- Merseyrail
5- Northern Trains
- ScotRail
- TransPennine Express
- Transport for Wales (TfW) Rail (Includes journeys made on TfW Rail
services operated on the Core Valley Lines)
- West Midlands Trains (West Coast Main Line services north of Milton
Keynes/Northampton as well as services in and around Birmingham)
● Non-franchised (open access) operators – licenced by the ORR to run services on
specific routes. The datasets that accompany this publication contain data for such
operators: Grand Central, Heathrow Express, Hull Trains, and Wrexham &
Shropshire (ceased trading 28 January 2011).
● Ticket types:
o Advance (ordinary ticket) – single one-way tickets for a specific train. They are
usually cheaper than other ticket types.
o Anytime/peak (ordinary ticket) – fully flexible tickets that can be used on most
trains and at most times. They are usually more expensive.
o Off-Peak (ordinary ticket) – cheaper than anytime fares, but cannot be used
during busier times of day.
o Other (ordinary ticket) – includes usage on regional products, rover tickets, some
group tickets, and package products (e.g. includes accommodation and/or
onward travel with other forms of transport). Non-travel income (e.g. car parking)
is also included in this category for passenger revenue, as too are refunds,
which can result in this category showing negative numbers.
6o Season – allow unlimited travel between two locations for a specified period
(from a week up to a year). Such tickets are generally cheaper than daily return
tickets for those travelling more than three times a week. The number of journeys
estimated for a season ticket varies by the length of the period. The journeys
factors used for the main season tickets are as follows:
Season ticket validity Journey factor
Weekly 10.3
Monthly 45
3 monthly 135
6 monthly 270
Annual 480
The coronavirus (COVID-19) pandemic necessitated the use of an alternative
methodology for estimating usage with season tickets. This is described below.
LENNON system
LENNON holds information on the vast majority of national rail tickets purchased in Great
Britain and is used to allocate the revenue from ticket sales between TOCs. LENNON
contains two datasets; pre-allocation (sales) and post-allocation (earnings). Passenger
usage statistics in the Passenger rail usage statistical release are based on the post-
allocation dataset so that kilometres, journeys and revenue data can be assigned to TOCs.
The pre-allocation dataset does not disaggregate data by TOCs. The pre-allocation
dataset collects total kilometres, journeys and revenue by flow and then, based on pre-
designated allocation factors, apportions the data to the appropriate TOCs. For example in
the pre-allocation dataset, a passenger may purchase a ticket for “ANY PERMITTED”
route between London Terminals and Birmingham BR. LENNON then uses the allocation
factors to split kilometres, journeys, and revenue between the relevant TOCs for which the
journey could be made.
Allocations are created for each tickets group by ORCATS (Operational Research
Computerised Allocation of Tickets to Services), dependent on sales levels. These
allocations are principally used to apportion kilometres, journeys and revenue between
TOCs.
ORCATS is a mathematical model which uses a similar logic to journey planning systems
and identifies passenger ‘opportunities to travel’ from an origin station to a destination
station using timetable information. It is used for real time reservation and revenue sharing
7on inter-available tickets between TOCs which divides ticket revenue in instances where a ticket or journey is on a flow that is operated by multiple TOCs. Impact of the coronavirus (COVID-19) pandemic In response to the coronavirus (COVID-19) pandemic, the UK government issued advice against all unnecessary travel was announced on 16 March 2020, with further guidance on ‘staying at home’ on 23 March 2020 (‘lockdown’). This in turn resulted in a large number of refund applications for both ordinary and season tickets. The LENNON system does not remove existing records when a refund is processed. Instead, a negative item of usage is created to offset the original usage. These records are categorised in the “other” ticket category. When a monthly or annual season ticket is purchased, the estimated usage is distributed in the post-allocation dataset over the period for which the ticket is valid. For example, an annual season ticket purchased on 6 January 2020 will contribute usage through to 5 January 2021. Refunds for such season tickets are distributed in LENNON in the same way as the original season ticket. However, they are only done so from the point at which the refund is issued. Moreover, there will be unused tickets for which refunds were not claimed. Given that the coronavirus pandemic affected usage towards only the end of the quarter, no changes were made to the methodology for the 2019-20 Q4 passenger rail usage release with an acknowledgment that usage was likely to have been slightly overstated due to many expected refunds having not been issued. However, had the regular methodology been used in its entirety in 2020-21, a more substantial overestimate of usage for each quarter would have resulted. The estimates for usage with advance, anytime, and off-peak tickets were made in the usual way as such tickets are very likely to have been purchased and used within 2020-21. These were supplemented with estimates for usage with season and other tickets using alternative methodologies. For both season tickets and other tickets there is more uncertainty around the estimates in 2020-21 compared with previous years. The number of journeys using season tickets was estimated using a combination of pre-allocation (sales) data, which attributes all expected usage to the point of purchase, and weekly season ticket usage in the post-allocation data, which splits usage by train operator. The methodology was refined in 2020-21 Q3 to provide a better estimate of the distribution of journeys made with season tickets between train operators and sectors. Usage with other ticket types includes an estimate for refunds that were not related to tickets purchased before the start of the pandemic. This was done by assessing refund rates against train service reliability. It should be noted that the refund estimates for 2020- 8
21 Q3 are likely to underestimate the actual extent to which purchased tickets were not
used. The increase in the prevalence of the coronavirus during the quarter resulted in
more restrictions on movement around Britain. In particular, plans to allow travel during the
Christmas holiday were scaled back or abandoned completely. Even where refunds were
made available, such as in England for passengers who had booked rail travel during the
Christmas travel window, it was not possible to quantify the level of refunds due to new
travel restrictions.

Non-LENNON data
Since 2010-11 Q1, non-LENNON data for passenger journeys and kilometres have been
provided to ORR each quarter from a number of TOCs. These include journeys on tickets
such as operator specific tickets and PTE multi-modal tickets. Most of the revenue
associated with such journeys is captured by the LENNON system.

The non-LENNON component for Merseyrail has not been available since 2017-18 Q1.
Starting with 2017-18 Q2, an estimate has been produced each quarter for Merseyrail non-
LENNON data. To begin with, this was done using the percentage change in usage
indicated by the LENNON data for the regional sector. This was done on a quarterly basis,
comparing usage in one quarter with usage in the same quarter a year earlier. Since 2018-
19 Q1, this has been done using only the Merseyrail LENNON data as this is judged to be
a better estimate of non-LENNON usage for this operator.

9
Historical background
Passenger train kilometres
Network Rail bills train operators (both passenger and freight) for all train movements on
their infrastructure. Billing was previously done by separate systems for passenger and
freight operators (PABS & BIFS respectively). From 1 April 2009, billing has been done by
a single system, known as TABS (Track Access Billing System).

Passenger journeys, passenger kilometres and passenger
revenue
Passenger journey and kilometre data before 1986 are sourced from historic transport
statistics. Information on rail usage before 1947 is available from the Rail Delivery Group.

Historically (1986/87 to 2002/03) passenger usage data was calculated from CAPRI
(Computer Analysis of Passenger Revenue Information) which was the rail industry’s
former central ticketing system. Data for this period is available on the ORR data portal as
well as in the archived Strategic Rail Authority (SRA) National Rail Trends publications
available from Archived National Rail Trends. CAPRI was, however, unable to correctly
record sales of certain products, including some operator-specific tickets and Passenger
Transport Executive (PTE) multi-modal tickets. Following a review by SRA and with
significant assistance of TOCs robust estimates for these products were included in the
passenger kilometres and journey data from the beginning of 2001-02, although they were
backdated to the beginning of 1999-00. Passenger revenue data were not included in
these estimates and as such the data remained unaffected.

Since 2003/04 the rail industry’s central ticketing and revenue system, LENNON, is the
basis for passenger journeys, kilometres and revenue data.

Prior to 2010-11, non-LENNON data were provided annually to ORR at the end of the
financial year and were apportioned out to each financial quarter. The apportionment of
the additional kilometres and journeys data to each quarter was based on the split of
LENNON data. For example, if 26% of LENNON journeys were in Q1, 26% of the
additional non-LENNON journeys would be assigned to Q1.

Data for non-franchised operators were not collected prior to 2008-09 Q3. Since this time
LENNON data for non-franchised operators includes Hull Trains and Grand Central but not
Heathrow Express whose total revenue (and associated journeys and kilometres) are not
included within the LENNON system. Between 2008-09 Q4 and 2010-11 Q4, the data also
included Wrexham and Shropshire but they ceased trading on 28 January 2011.

10
Since 2012-13 Q2 passenger journeys, kilometres and revenue data by ticket type for
ordinary fares have been disaggregated further based on Advance, Anytime (Peak), Off
Peak (including Super Off Peak) and Other (non-LENNON tickets and promotional tickets).
It is not possible to provide a time series prior to 2011-12 for this level of disaggregation
because LENNON only maps the data back to 2011-12 Q1.

11
Relevance
The degree to which the statistical product meets the user needs in both coverage and
content.

Measures of rail usage are key indicators of the levels of rail use in Great Britain. They
provide a clear indication of the number of passengers using and journeys made on the
network, providing an indication of the levels of demand for rail travel. This can help in
both short-term and long-term planning for the industry and wider stakeholders, both at a
National level and within the rail sectors.

Passenger revenue data provides data an insight into revenue levels within the industry as
well as the levels of revenue generated through each ticket type, which can provide an
indication of changes in ticket purchasing trends.

Rail usage data published on our data portal is used by a range of individuals for planning,
analysis, decision making and data validation.

ORR’s last user survey took place from mid-January to mid-April 2020. The aim of the
survey was to gather feedback on ORR’s new data portal; this includes statistical releases,
data tables and other supplementary material. There were 42 responses to the survey.
ORR created an implementation plan following the 2020 user survey.

More detailed information on users of ORR statistics and meeting the needs of users is
available on our user engagement webpage.

12
Accuracy and reliability
The proximity between an estimate and the unknown true value.

Passenger journeys, kilometres and revenue
Passenger journeys, kilometres, and revenue data are sourced directly from LENNON
(LENNON data) and train operators (non-LENNON data) for passenger journeys and
kilometres. The LENNON system automatically records the majority of ticket sales, with
non-LENNON data capturing the tickets sold through outlets not linked to the LENNON
system. Combining the two sets of data provides a best estimate of passenger ticket sales
from which passenger journeys and kilometres can be derived. The LENNON system is
primarily an accounting tool and therefore faces limitations when being used for statistical
reporting. With all large data sources there may be input errors which are more likely to
occur in the journeys, rather than revenue data. Due to the size and complexity of the
dataset we are unable to validate each and every entry.

Known problems in the data capture include those relating to travelcards, return and single
journey tickets, multiple tickets, rail staff passes, ticketless travel and other rail systems.
Furthermore, the coronavirus (COVID-19) pandemic generated further uncertainty around
the use of season tickets at the end of 2019-20 and during 2020-21.

It should also be noted that revenue, in addition to ticket revenue, includes other
miscellaneous charges associated with passenger travel on national railways, such as car
parking charges. There may be differences between the actual values and published
statistics resulting from tickets involving travel on London transport, the receipts for which
are apportioned.

The passenger journeys and kilometres statistics, which are based on the LENNON data
and non-LENNON data received from TOCs, may also differ from actual passenger
kilometres and passenger journeys because the data does not make adjustments for
unused tickets and passengers cutting journeys short (i.e. alighting a train before the
destination station stipulated on their ticket).

Whilst the LENNON system is updated overnight there maybe circumstances in which
passenger revenue figures would be revised and therefore change the revenue figures in
LENNON. These are likely to occur within the first two weeks after the end of each period.
Therefore to minimise the risk using incorrect data, ORR waits at least one month before
extracting the data from LENNON.

13
It should also be noted that rail usage sector data do not align with rail performance sector
data in some cases, e.g. for TransPennine Express.

Data coverage
The data presented in this release are for mainline operators in Great Britain. The data do
not include Eurostar, London Underground, light rail, heritage and charter services. The
datasets that accompany this publication contain data for such operators: Grand Central,
Heathrow Express, Hull Trains, and Wrexham & Shropshire (ceased trading 28 January
2011).

Passenger kilometres, journeys and revenue data are based on a combination of data
sources. The data used to derive passenger kilometres and journeys data are derived from
a combination of LENNON data and data provided directly from train operators (non-
LENNON data). The two sources of passenger kilometres and journey data are required to
capture the full volume of passenger kilometres and journeys on the rail network as the
LENNON system does not include all methods of and types of products sold.

Non-LENNON data are supplied directly by train operators who are coherent in use of the
LENNON system and the products which it is able to capture. As a result, TOCs are fully
aware of the types of product which are not captured and the resultant passenger
kilometres and journeys which should be reported through the non-LENNON data
submission to ORR. This product knowledge minimises the chances of double reporting
occurring.

Quality assurance
Data extracted from the LENNON system is converted into a standard format and subject
to a series of quality assurance checks. Similarly all non-LENNON data that are received
from TOCs are subject to a series of quality assurance checks. We check the data is
provided in the correct format, there are no inconsistencies in the data and trends over
time are similar, to ensure accurate data is published.

Any arising issues from our internal quality assurance processes are queried with Network
Rail (for Passenger train kilometres), the Rail Delivery Group (for queries regarding
LENNON data), or TOCs (for non-LENNON data). Explanations from the data suppliers
regarding data anomalies are included within our commentary to explain the data and
trends. For example, the Rail Delivery Group provides information on the timing of
technical payments for such things as contactless data and TfL sold travelcards. The
estimates of usage for each TOC extracted from the LENNON system are also cross-
referenced against estimates provided by the TOCs themselves.

14
These data are then prepared for publication. The process includes quality assuring the
tables and charts produced and providing supporting commentary regarding the key
trends, methodology and quality measures. These reports are subject to peer review.

The final stage of the quality assurance process is a sign off by the statistics Head of
Profession confirming the data meets the quality standards and are fit for publication.

Revisions policy
ORR’s statement on orderly release and revisions policy outlines ORR’s revision policy.
Details of any revisions are available in the revisions log. Further information on revisions
and data series breaks can also be found in the data tables.

15
Timeliness and punctuality
Timeliness refers to the time gap between publication and the reference period.
Punctuality refers to the gap between planned and actual publication dates.

ORR aims to publish these statistics as soon as possible after the end quarter. Passenger
rail usage data is typically available on the ORR data portal approximately two months
after the end of the quarter.

The publication schedule available on the data portal outlines the publication dates for
National Statistics quarterly and annual statistical releases and other official statistics up to
12 months in advance.

ORR is committed to releasing its statistics in an open and transparent manner that
promotes confidence.

16
Accessibility and clarity
Accessibility is the ease with which users are able to access the data, also reflecting the
format in which the data are available and the availability of supporting information. Clarity
refers to the quality and sufficiency of the metadata, illustrations and accompanying
advice.

All rail statistics data tables can be accessed free of charge on the ORR Data Portal.
Commentary about the statistics and trends are provided in the statistical releases. An
interactive dashboard (PowerBI) is available on the Passenger Rail Usage theme page

The passenger rail usage data tables currently published on the data portal are:

Passenger journeys
●    Passenger journeys (franchised only) - annual – Table 1220
●    Passenger journeys by sector - quarterly – Table 1221
●    Passenger journeys by ticket type - quarterly – Table 1222
●    Passenger journeys by train operator - quarterly – Table 1223

Passenger kilometres
●    Passenger kilometres (franchised only) - annual – Table 1230
●    Passenger kilometres by sector - quarterly – Table 1231
●    Passenger kilometres by ticket type - quarterly – Table 1232
●    Passenger kilometres by train operator - quarterly – Table 1233

Passenger revenue
●    Passenger revenue by sector - quarterly – Table 1211
●    Passenger revenue by ticket type - quarterly – Table 1212
●    Revenue per passenger kilometre and per passenger journey (franchised only) -
     quarterly – Table 1210

Passenger train kilometres
Passenger train kilometres by operator - quarterly – Table 1243

Passenger rail usage data, particularly passenger revenue data, is viewed as
commercially sensitive. Therefore, lower levels of disaggregation are not possible without
permission from TOCs and RDG.

17
Coherence and comparability Coherence is the degree to which data that are derived from different sources or methods, but refer to the same topic, are similar. Comparability is the degree to which data can be compared over time and domain. Other related data The Department for Transport (DfT) also publishes a range of rail statistics which can be found at DfT Rail Statistics. This includes Rail passenger numbers and crowding statistics which provides information on the number of passengers travelling by rail into and out of major city centres in England and Wales. The statistics represent passengers on National Rail services on a ‘typical’ weekday. For more information on COVID-19 impacts see: ● Transport use during the COVID-19 pandemic (Department for Transport) ● All Change? Travel tracker (Department for Transport) ● Coronavirus and the social impacts on Great Britain (Office for National Statistics) ● Weekly travel during COVID-19 survey (Transport Focus) ● Public transport journeys by type of transport (Transport for London) The passenger journey totals should not be compared with those published as part of ORR's Regional Rail Usage release as they are calculated on a different basis. For example, a journey from Leicester to Manchester would be classed as two journeys due to the need to change trains. However, in Regional Rail Usage, it is treated as one journey reflecting the origin and destination shown on the ticket. Please see Passenger journeys in Great Britain which explains the differences in more detail. For more information on comparability of data over time see Historical background section above which describes changes to the data over time. 18
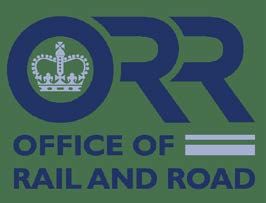
Length of comparable time series
Measures          Disaggregation        Start of time series    Any break in series

                                        1872 - journeys         GB journeys and kilometres
                                                                are shown for calendar
                  Great Britain         1938 - kilometres
                                                                years before 1984-85.
                                        1986-87 - revenue
                                                                Data before 1938 sourced
                                                                from the National
                  Ordinary and season   1986-87 - annual
                                                                Infrastructure Commission.
                  tickets               1994-95 Q1
                                                                Data between 1938 and
                                                                1985-86 sourced from DfT.
Passenger
                  Advance,                                      Data between 1986-87 and
journeys,
                  anytime/peak, off-    2010-11 Q1              2002-03 sourced from
kilometres, and
                  peak, other tickets                           CAPRI. Additional TOC
revenue
                                                                data included from 1999-00.

                  Sectors               1994-95 Q1              Data since 2003-04 sourced
                                                                from LENNON and train
                                                                operators.
                                        2011-12 Q1 (revenue
                                                                Alternative methodology
                  Train operators       figures not available
                                                                used in 2020-21 due to
                                        by TOC)
                                                                coronavirus (COVID-19).

Passenger train
                  Train operators       2010-11 Q1
kilometres

19
© Crown copyright 2021 This publication is licensed under the terms of the Open Government Licence v3.0 except where otherwise stated. Where we have identified any third party copyright information you will need to obtain permission from the copyright holders concerned. This publication is available on the ORR data portal Any media enquiries regarding this publication should be sent to us at orr.gov.uk/contact-us. 20
You can also read