Journal of Computer Networks, Architecture and High Performance Computing - ITScience
←
→
Page content transcription
If your browser does not render page correctly, please read the page content below

Journal of Computer Networks, Architecture and
                                                                                             Submitted : 31 January 2021
High Performance Computing                                                                   Accepted : 2 February 2021
Volume 3, Number 1, January 2021                                                             Published : 6 February 2021
https://doi.org/10.47709/cnahpc.v3i1.930

Centralized and Mapped GIS Web-Based Covid-19 Data Reporting
Application with The Waterfall Method
(Case Study: Information Communication Department of North Sumatra Province)

Rizki Muliono1)*
1)
     Universitas Medan Area, Indonesia
1)
     rizkimuliono@gmail.com

                                                         Abstract

 Covid-19 pandemic cases are currently increasing and expanding throughout the world, especially in Indonesia in
 the province of North Sumatra. Data on the number of cases spread in the province of North Sumatra which is
 summarized and published, sometimes there are still disputes over the number and lack of organization in the
 number of records and their distribution, so there are often errors in the data collected by the health department and
 which will be published to the public. The case study in this research is the design of an information system that
 regulates the process of recording, moving, accumulating, and mapping GIS data maps to the publication of Positive
 case data, Patient Under Surveillance, Polymerase Chain Reaction, and Rapid Test results directly through a web-
 based covid-19 data reporting application. Sourced from each user of every health facility in each district and city
 from each sub-district in the province of North Sumatra to support the accuracy of data in decision-making built at
 the North Sumatra Province Information and Communication Office. The method used in developing the
 application uses the waterfall method, starting from the needs analysis stage, design, implementation to testing
 until maintenance. The results of the implementation and testing were carried out using the Blackbox and Whitebox
 methods. Presentation of GIS web data using google maps has not used a threshold value based on a calculated
 algorithm, but still uses the determination of crisp values so that the results cannot be said to be relevant as a
 determinant.

 Keywords: covid-19; application; web-gis; North Sumatra; reporting

                                                     INTRODUCTION
     Cases of the covid-19 pandemic are now increasing and expanding throughout the world, especially in Indonesia
in the province of North Sumatra. Data on the number of cases reported in the province of North Sumatra that is
summarized and published sometimes there is still a dispute over the number and less organized number of records
and distribution, so there is often a data error collected by the health service and that will be published to the public.
The difference in the number of accumulated cases of covid-19 is due to the existence of less organized data sources
and data distribution parties in the health service and covid-19 task force in the province of North Sumatra. The
submission of covid-19 case data information will be published legally by the provincial information office of North
Sumatra. Bureaucratic delivery of data parties or agencies involved in reporting covid-19 data in north Sumatra is
starting from health facilities such as health centers and hospitals in each district of the city number of 450 districts
that register the initial data of patients recorded based on the population master number with the type of classification
and update the status of patients who have been previously recorded, then the health office in the city district area of
33 regions in the province of North Sumatra verify the data reported by the health center and hospitals. Furthermore,
the data is given to the provincial health office to be ratified and then the information office of North Sumatra can
publish the data to the public, but in reality, the situation in the field does not run according to the bureaucracy of the
data that should be. If the reported spec has symptoms of covid-19 and those who have just arrived from the regional
trip will be classified as Patients Under Surveillance (PDP), if the spec has been tested Polymerase Chain Reaction
(PCR) with positive results calculated in positive data Polymerase Chain Reaction (PCR) and a spec that has reactive
results through Rapid Test will be summed up in the classified data. The current state of information is that each
district/city does its calculations and displays them on the corona website page in each area so that each has its version
in displaying information on covid-19 cases.

* Corresponding author
                      This is an Creative Commons License This work is licensed under a Creative
                      Commons Attribution-NoDerivatives 4.0 International License.                                   30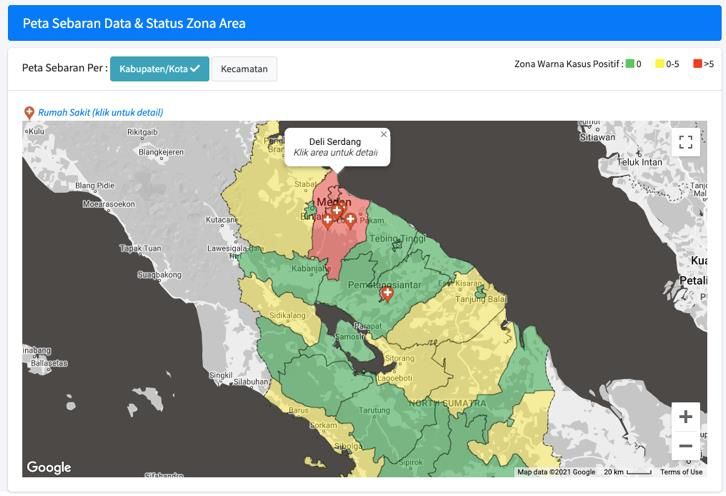
Journal of Computer Networks, Architecture and
                                                                                          Submitted : 31 January 2021
High Performance Computing                                                                Accepted : 2 February 2021
Volume 3, Number 1, January 2021                                                          Published : 6 February 2021
https://doi.org/10.47709/cnahpc.v3i1.930

      Based on the background of the problem, became a case study in the design of a system that regulates the process
of recording, transfer, accumulation, and mapping GIS maps data until the publication of Positive data, Patients Under
Surveillance, Polymerase Chain Reaction (PCR) Test and Rapid Test directly through a web-based covid-19 data
reporting application sourced from each user of every health facility in each district of the city from each sub-district
in the province of North Sumatra to support the accuracy of data in decision making. The use of a GIS-based
information model will provide more ease of visual data reading (Triyani, 2020) in showing the conclusion of data
based on district and city district maps, this infographic will be needed by the Governor of North Sumatra Province
in determining decisions and handling actions ranging from policies and rules that will be applied to each region in
the province of North Sumatra.

                                                LITERATURE REVIEW
      The latest covid-19 case data in Indonesia has reached up to one million positive cases with positive details of
1,066,313, Recovered 862,502 and Died 29,728, While in North Sumatra recorded 21,233 cases with a total of 18,381
recovered and 753 deaths that can be obtained on the website https://covid19.go.id (Task Force handling COVID-19,
2021). This situation is a serious problem faced by the Indonesian state today, many things are happening and
impacting in all sectors, among others, social, economic, tourism, entertainment venues, public transportation,
shopping centers have decreased drastically as the spread of Covid-19 (Syafrida & Hartati, 2020). In north Sumatra
Province, the increase of covid-19 cases is still high even though the provincial government of North Sumatra
continues to enforce the Regulation of Restrictions on Community Activities (PPKM) and based on a task force (task
force) handling the covid-19 pandemic in north Sumatra, adding positive cases of Covid-19. 19 in the area since the
implementation of PPKM on January 13, 2021, to Monday (18/1/2021), there were 1,048 confirmed cases of covid-
19 (Sianturi & Hidayat, 2021). Tracing the history behind how the first case of coronavirus or covid-19 was first
discovered from the spread of respiratory diseases that occurred in December 2019 identified in Wuhan area, Hubei
Province, China. Until February 11, 2020, the outbreak of this virus was a concern by the International World Health
Organization (WHO) which informed the existence of a new virus with the name coronavirus 2019 (COVID-19).
Where it is known the source of new coronavirus transmission has not been determined definitively so far. From
various evidence shows that the source of new coronavirus infection comes from wild animals (Rothe, et al., 2020).
The state of the international disaster-scale pandemic has led the local government of North Sumatra Province to issue
emergency regulations such as the Temporary Closure of Tourism Industry Operational Activities to Be Aware of the
Transmission of Corona Virus Disease (COVID-19) by the Governor of North Sumatra Province (Rahmayadi, Circular
Letter, 2020). Economic and social conditions at that time were very worried in addition to the political situation that
is heating up with the negative issues related to covid-19 that are always in the news as if scaring and haunting people
to do activities outside the home, thus affecting the trading conditions and the economy of course, among others, the
number of businesses and companies that may be closed, responding to the situation of the governor of North Sumatra
province took a stance to calm the community as well as convey the handling of covid-19 in the northern province of
Sumatra as well as delivering health facilities specifically hospitals that become referral centers and services in the
handling of patients indicated coronavirus (Rahmayadi, Website Covid19 North Sumatra, 2020). And in terms of
operational order and office administration carried out the enforcement of work from home or Work From Home
(WFH) by the governor's regulations in the letter (Rahmayadi, covid19.sumutprov.go.id/document, 2020). At the task
force meeting on April 17, 2020, one of the problems related to provincial and central data has begun to be well
integrated, but there are still some areas where the data is not good, there are still differences. Laboratories that have
been recorded in the Ministry of Health there are 78 labs, but not all labs can work properly. The regional task force
can make sure which labs are operational properly. Data that is still needed from the area is the data of patients who
have recovered and the number of rooms for isolation. The data of recovered patients can be used to conduct campaigns
for the community. The provincial government has prepared 26 hospitals spread across Kab/Kota with 8 main referral
hospitals and referral hospitals in 6 districts/cities as well as reserve hospitals with a capacity of 1,500 patients
(COVID-19 Task Force, 2020). With the problem of data sources and data integration between regions and centers, it
is necessary to have information systems that can be used together as in the Ciampea sub-district with an information
model in the form of covid-19 healing data distribution map in the form of GIS (Graphic Information System) (Triyani,
2020). To provide transparency of covid-19 data before publication one of the causes is patient tracking data with the
public so that the lack of open data information creates panic in the community that causes "panic buying" (Farizi &
Harmawan, 2020). The flow of covid-19 problem solving by the government should have to develop a model of

                     This is an Creative Commons License This work is licensed under a Creative
                     Commons Attribution-NoDerivatives 4.0 International License.                                   31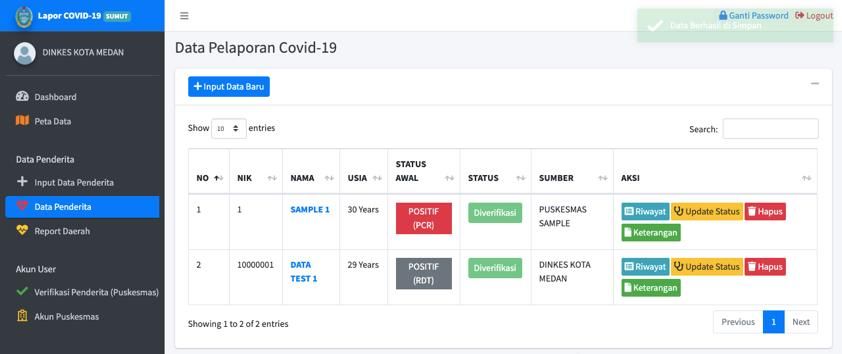
Journal of Computer Networks, Architecture and
                                                                                          Submitted : 31 January 2021
High Performance Computing                                                                Accepted : 2 February 2021
Volume 3, Number 1, January 2021                                                          Published : 6 February 2021
https://doi.org/10.47709/cnahpc.v3i1.930

problem-solving by e-governance in the face of the global covid-19 pandemic until the future that has sustainability
such as research (Ullah, Pinglu, Ullah, Abbas, & Khan, 2021). One solution in the problem of data reporting is with a
web-based information system with centralized data and with an application architecture like this can serve many
users at once (Dissanayake & Dias, 2017) which was developed by the Communication and Infrmatika office of North
Sumatra to a display that will provide convenience in decision making, which is displayed with GIS (Graphic
Information System) model through the display of google maps (Ramadhan, A., Sensuse, D. & Arymurthy, A. (2011).
The importance of the implementation of this Web-GIS to run an electrification-based government as the goal of e-
government as a tool to control and monitor health in the government environment (Nugroho Joshua et al., 2017), it
can be implemented especially in covid-19 data that until now has not been controlled. Completion in an application
development should refer to the application architecture itself whether the structure will be static or dynamic by
looking at three perspectives, referred to as displays: application display, design, and program Felderer M. et al. (2020).
The importance of presenting data with the GIS model is to provide ease of visual reading of data by the leadership
when in a quick situation to determine a decision.

                                                    METHOD
     In the design of covid-19 data reporting application in north Sumatra province, it uses waterfall method while
designing this system model using Unified Modelling Language (UML) with Use Case Diagram. This waterfall
method is one of the methods often used in software application development. "This method proposes an approach to
systematic and sequential software development starting from the level of system progress in all analysis, design,
code, testing, and maintenance" (Wijaya, 2019). In the research of system design using the waterfall method that can
be seen in figure 1.

                                               Requirement Analysis

                                                         Design

                                                   Implementation

                                                         Testing

                                                    Maintenance
                                                Figure 1. Research Flow

      In the Analysis stage, the data used in this study is sourced from covid-19 data on the website
of covid19.sumutprov.go.id owned by the provincial government of North Sumatra then from the data of each report
in the city district presented on the website of each city district. The absence of uniformity of data between regional
institutions with central or level in publishing data to the public and the frequent loss of case data or loss of data
information when handling patients and the bureaucracy of data distribution that is not well organized is the main
problem today. So it is designed a system that has a business process structure that can reduce data loss and redundant
patient data. In North Sumatra, there are 33 regencies/cities that have hospitals in the sub-district. The initial data
source is actually through health facilities that conduct tests such as Polymerase Chain Reaction (PCR) Test and Rapid
Test, and also those who report that they come from travel or PDP then also transfer patient data based on referral
between hospitals. The case data is reported through the covid19 reporting application with patient status based on the
patient's NIK as unique data to overcome the double data. More details can be seen in figure 2 below.

                     This is an Creative Commons License This work is licensed under a Creative
                     Commons Attribution-NoDerivatives 4.0 International License.                                   32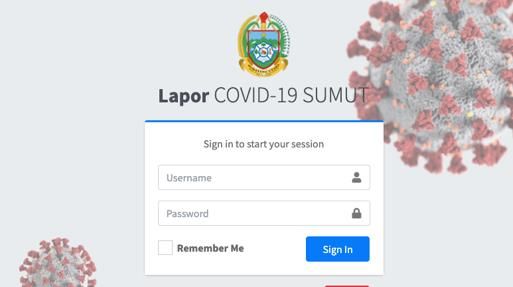
Journal of Computer Networks, Architecture and
                                                                                               Submitted : 31 January 2021
High Performance Computing                                                                     Accepted : 2 February 2021
Volume 3, Number 1, January 2021                                                               Published : 6 February 2021
https://doi.org/10.47709/cnahpc.v3i1.930

                                                                      Registration / Update
                                     data covid-19 is                Status of case data per
                                     published to the                  patient by hospital
                                    public through the                 health facilities and
                                      covid19 report                 Puskesmas in the sub-
                                    application system                       district

                                               Data                       data
                                           verification               verification
                                              by the                by the District
                                            Provincial               / City Health
                                          Health Office                  Office

                               Figure 2. Business Data Distribution Process Covid19

   The next step is to design the application based on the results of the analysis of existing problems. Application
design, in this case, includes database design and UI/UX design in covid-19 reporting application developed. Design
Front end uses HTML, CSS bootstrap templates, and technology for backend using code igniter 3 frameworks with
PHP programming language. Use of google maps library as tools in GIS development. The implementation stage of
the application is created by displaying the main menu of data management on the left side, starting from the
Dashboard menu, data map, Patient Data Input, Patient Data, Regional Report, Data transfer of patients Verification
Puskesmas and Puskesmas Account, the process flow and data transfer in the system based on the user level can be
seen in Figure 3 below.

                                         Figure 3. System Use Case Diagram

   At the experiment stage using the WhiteBox method experiment and Blackox method by connecting the
experiment with case data whether there are errors in the application UI / UX and back-end process before the
implementation in bulk, if there is an error then the program code will be corrected immediately.

                    This is an Creative Commons License This work is licensed under a Creative
                    Commons Attribution-NoDerivatives 4.0 International License.                                      33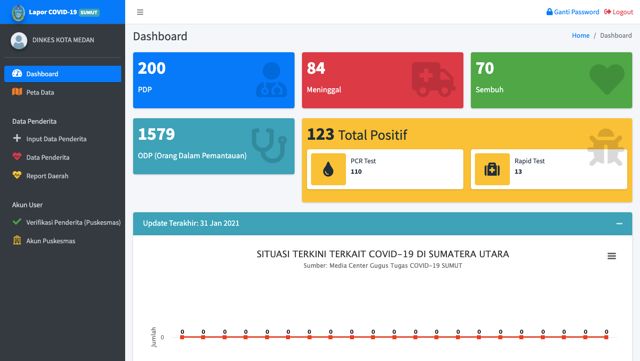
Journal of Computer Networks, Architecture and
                                                                                         Submitted : 31 January 2021
High Performance Computing                                                               Accepted : 2 February 2021
Volume 3, Number 1, January 2021                                                         Published : 6 February 2021
https://doi.org/10.47709/cnahpc.v3i1.930

                                                   RESULT
   The username and password of each user are created first by the app creator. Covid19 reporting application in
north Sumatra province has produced a design as admin can be seen in figure 4 below.

                                           Figure 4. Application Login Page

    After successfully logging in with the account of each level the user is directed to the dashboard page showing
statistics of the overall amount viewed in figure 5.

                                              Figure 5. Dashboard Page

   Here is a view of the data input form of patients according to the case of covid19 seen in figure 6.

                    This is an Creative Commons License This work is licensed under a Creative
                    Commons Attribution-NoDerivatives 4.0 International License.                                34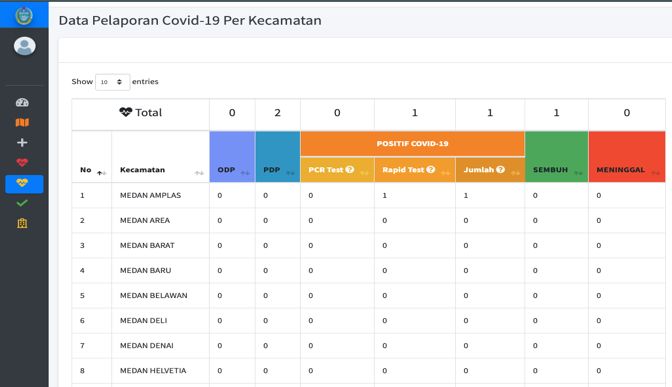
Journal of Computer Networks, Architecture and
                                                                                         Submitted : 31 January 2021
High Performance Computing                                                               Accepted : 2 February 2021
Volume 3, Number 1, January 2021                                                         Published : 6 February 2021
https://doi.org/10.47709/cnahpc.v3i1.930

                                  Figure 6. Case or Patient Data Registration Form

  The patient data view can display patient details, update patient status, and patient information seen in Figure 7.

                                       Figure 7. Registered Patient Table Data

                    This is an Creative Commons License This work is licensed under a Creative
                    Commons Attribution-NoDerivatives 4.0 International License.                                  35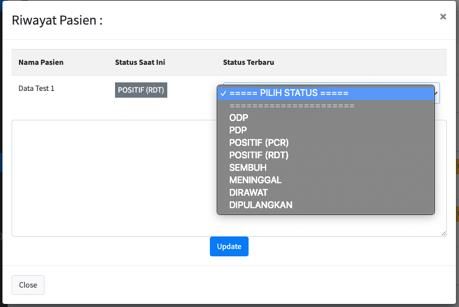
Journal of Computer Networks, Architecture and
                                                                                         Submitted : 31 January 2021
High Performance Computing                                                               Accepted : 2 February 2021
Volume 3, Number 1, January 2021                                                         Published : 6 February 2021
https://doi.org/10.47709/cnahpc.v3i1.930

   To update patient data using the status update menu that will bring up a form such as Figure 8.

                                        Figure 8. Patient Status Update Form.

Details of the patient's history can also be seen in the History button menu, which displays information from the first
in the initial data input until the final status update healed or died can be seen in Figure 9.

                                           Figure 9. Patient History Details

   The next result is the display of the results of reporting accumulated data based on the group of sub-districts in
each district/city that can be seen in Figure 10.

                    This is an Creative Commons License This work is licensed under a Creative
                    Commons Attribution-NoDerivatives 4.0 International License.                                 36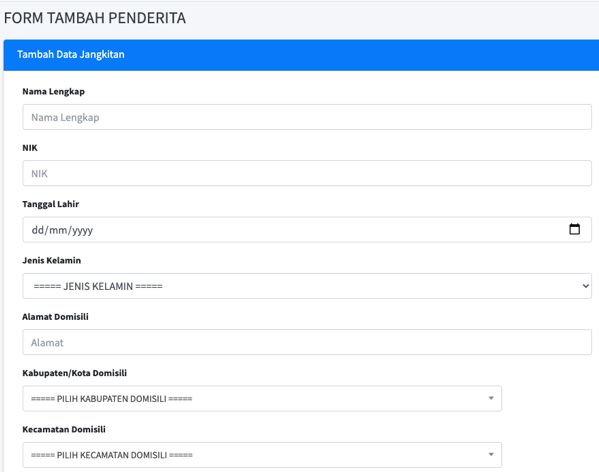
Journal of Computer Networks, Architecture and
                                                                                         Submitted : 31 January 2021
High Performance Computing                                                               Accepted : 2 February 2021
Volume 3, Number 1, January 2021                                                         Published : 6 February 2021
https://doi.org/10.47709/cnahpc.v3i1.930

                         Figure 10. Accumulated Data of The Number of Each Sub-District.

Next is the GIS maps display on google maps that displays color zones according to case data in each district and city
in the province of North Sumatra, the colors consist of red, yellow, and green zones seen in Figure 11.

                 Figure 11. Web-GIS Maps Color Zones by The Number of Cases per District/City.

And the last is gis maps display on google maps that shows color zones according to case data in each district in each
district and city in the province of North Sumatra, the color consists of red, yellow, and green zones seen in Figure
12.

                    This is an Creative Commons License This work is licensed under a Creative
                    Commons Attribution-NoDerivatives 4.0 International License.                                37
Journal of Computer Networks, Architecture and
Submitted : 31 January 2021
High Performance Computing Accepted : 2 February 2021
Volume 3, Number 1, January 2021 Published : 6 February 2021
https://doi.org/10.47709/cnahpc.v3i1.930
Figure 12. GIS Color Zones Based on The Number of Cases per Subdistrict.
DISCUSSIONS
In the design of the Covid19 report application for the province of North Sumatra, there are 4 main accounts in
centralized, organized, and monitored data distribution, namely the health center user account at the sub-district level,
the user account at the regional hospital level, and the health service user in the district/city and the user for the
department. the health of the province of North Sumatra which contains a recap of each district/city. Changes in patient
status can be made by the sub-district office and hospital accounts, transfer of patient status and moving hospitals can
be done by the hospital account, and data at that time will also move to the hospital that is the next referral. This
control structure and data processing is a solution for data loss and redundancy on Covid19 data which will later be
published to the public. The assignment of zone colors on the GIS maps still uses definite value stopping, namely for
0 cases it is green, for 0-5 cases it is yellow and >5 is red, which of course this is still not relevant. After the application
is completed, the testing phase is carried out using the Blackbox method, Whitebox.
Blackbox Testing
In the system test using the BlackBox method, which is to test the overall account at the existing levels of data input,
update data, delete data there are no constraints and results displayed as desired and according to the design of business
processes in the distribution of data on the screen of the application user.
This is an Creative Commons License This work is licensed under a Creative
Commons Attribution-NoDerivatives 4.0 International License. 38Journal of Computer Networks, Architecture and
Submitted : 31 January 2021
High Performance Computing Accepted : 2 February 2021
Volume 3, Number 1, January 2021 Published : 6 February 2021
https://doi.org/10.47709/cnahpc.v3i1.930
Table 1
Application Test Results With Blackbox Test
No Function Status
1 Login to the admin page of regional health facilities. valid
2 If entering a greeting username and password then the system refuses and displays an error valid
notification.
3 Data input on data input menu Covid-19 patients all forms function properly until submitting data. valid
4 The information displayed in the data table according to the data in each region based on the user valid
level.
5 Information that is announced when the history button is pressed correctly according to the data valid
in that row.
6 The patient status update form is functioning properly and the data has successfully changed status valid
and in the patient, history has recorded the addition of status data history.
7 Accumulated data table according to covid-19 case criteria displays the amount corresponding to valid
the correct region and total value.
8 North Sumatra polygon GIS-map page on google maps has been displayed with the correct zone valid
color according to this covid-19 data input.
10 When the regional or sub-district polygon displays information on the appropriate amount of valid
covid-19 data.
11 When the application exit button (Logout) is pressed the user will be directed to the login page valid
and cannot return to the previous page by clicking the previous button on the browser to function
correctly.
This test includes the official Admin account, testing of hospital and health center data addition page, testing on patient
history update page to the promotion of GIS view on maps of value data displayed according to the amount in the data
table. Test the login page if it is logged in and successful then it will be directed to the dashboard page. The test on
logout will return to the login page and can not display the dashboard page if clicked the previous page in the browser
because the session has been deleted by the logout process.
Whitebox Testing
This test checks the base path, from the program logic that is run after carrying out a series of experiments from the
BlackBox method, on the login page if the username/password does not match, an error notification will appear and
return to the login page the logical path is appropriate, as well as the registration page patient data to the patient data
page, update the patient status back to the patient data page with changes to the data table. If the page security path is
based on the session, when logged incorrectly it leads to the dashboard page and if it is logged out the logic is correct
displays the login page and as long as the session data has been deleted it will not be able to go to the dashboard page
and others in the application.
Maintenance
At this stage is a process where if there is an error from the desired output, then there is an error in the data in the
results displayed on the user page, because the value or results displayed are not by the intended as reported by the
application user, especially the user with the initial data input level. This process will go back to the early stages of
the waterfall method of problem analysis until the improvement of the program code and conduct the testing stage, so
on until the application can run properly and correctly by the wishes of the leadership and distribution of covid-19
data in north Sumatra is running well and monitored by all parties involved in the system.
CONCLUSION
The final result of this research is the conclusion of the results of analysts and implementation of application testing
that can be described in general, among others, this application provides ease in monitoring data from the basic level
of data sources to record to a higher level, namely the province. The data presented has complete details and presented
with a simple UI/UX design and easy to use by the user. Currently at the bureaucratic level of the regional health
center in the city district can provide data at one door and the movement of data can be monitored in the validation
process by users at the district and city office-level so that no data is missed during the reporting process to the central
agency, namely the provincial health office of North Sumatra, which provides data authentication that will then be
published by the communique and informatics office of north Sumatra province. The process is much more organized,
This is an Creative Commons License This work is licensed under a Creative
Commons Attribution-NoDerivatives 4.0 International License. 39Journal of Computer Networks, Architecture and
Submitted : 31 January 2021
High Performance Computing Accepted : 2 February 2021
Volume 3, Number 1, January 2021 Published : 6 February 2021
https://doi.org/10.47709/cnahpc.v3i1.930
centralized, and monitored in every move and change of data from downstream to upstream. In the provision of color
zone determinant values on GIS maps still use the whole certainty value for 0 cases is green, for 0-5 cases is yellow
and >5 is red, for future research the determination of values for zone colors can be done with one of the fuzzy
algorithms or clustering methods that are more balanced in providing existing threshold values to harmonize the
calculation of values for more relevant zoning colors. Making applications with the waterfall method is very suitable
to be applied to the government environment, especially in the province of North Sumatra whose developer is the
communication and informatics office of North Sumatra that can easily adjust to the state of bureaucracy between
agencies in the north Sumatra provincial government, especially in handling covid-19 data.
REFERENCES
Dissanayake, N. R., & Dias, K. A. (2017). Web-based Applications: Extending the General Perspective of the Service
of Web. 10th International Research Conference of KDU (KDU-IRC 2017) on Changing Dynamics in the
Global Environment: Challenges and Opportunities. Rathmalana.
Farizi, S. A., & Harmawan, B. N. (2020). Data Transparency And Information Sharing: Coronavirus Prevention
Problems In Indonesia. Jurnal Administrasi Kesehatan Indonesia, 8(1), 35-50.
Felderer M. et al. (2020) Ernst Denert Software Engineering Awards 2019. In: Felderer M. et al. (eds) Ernst Denert
Award for Software Engineering 2019. Springer, Cham. https://doi.org/10.1007/978-3-030-58617-1_1
Muliono, R., Muhathir, Khairina, N., & Harahap, M. K. (2019). Analysis of Frequent Itemsets Mining Algorithm
Againts Models of Different Datasets. In Journal of Physics: Conference Series (Vol. 1361). Institute of
Physics Publishing. https://doi.org/10.1088/1742-6596/1361/1/012036
Muliono, R., Lubis, J. H., & Khairina, N. (2020). Analysis K-Nearest Neighbor Algorithm for Improving Prediction
Student Graduation Time. Sinkron : Jurnal Dan Penelitian Teknik Informatika, 4(2), 42-46.
https://doi.org/10.33395/sinkron.v4i2.10480
Nugroho Joshua, J. W., Agus Swastika, I. P., & Windha Daniaty, T. O. (2017). E-Government Integration through
Implementation of web-based GIS on Community Health monitoring in Jembrana Regency, Bali. Procedia
Computer Science, 124, 552–559. https://doi.org/https://doi.org/10.1016/j.procs.2017.12.189
Rahmayadi, E. (2020, April 20). covid19.sumutprov.go.id/document. Retrieved January 2021, from
covid19.sumutprov.go.id:https://covid19.sumutprov.go.id/content/userfiles/surat_edaran/Surat_Edaran_Gub
su.pdf
Rahmayadi, E. (2020, Maret). Surat Edaran. Retrieved January 2021, from covid19.sumutprov.go.id:
https://covid19.sumutprov.go.id/content/userfiles/surat_edaran/Surat_edaran_Gubsu_Penutupan_Sementara
.pdf
Rahmayadi, E. (2020, Maret). Website Covid19 Sumatera Utara. Retrieved January 2021, from
covid19.sumutprov.go.id: https://covid19.sumutprov.go.id/content/userfiles/seruan/Seruan%20Gubsu.pdf
Ramadhan, A., Sensuse, D. & Arymurthy, A. (2011). Assessment of GIS implementation in Indonesian e-Government
system. Proceedings of the 2011 International Conference on Electrical Engineering and Informatics. DOI:
10.1109/ICEEI.2011.6021515
Rothe, C., Schunk, M., Sothmann, P., Bretzel, G., Froeschl, G., Wallrauch, C., & Zimmer, T. (2020). ransmission of
2019-NCOV infection from an asymptomatic contact in Germany. N. Engl. J. Med, 382(10), 970–971.
Satgas Covid-19. (2020, April 17). Notulen Rapat Gugus Tugas Covid19. Retrieved January 2021, from
ovid19.sumutprov.go.id:https://covid19.sumutprov.go.id/content/userfiles/seruan/NOTULEN_RAKOR_G
UGUS_TUGAS_17APRIL2020.pdf
Satuan Tugas Penanganan Covid-19. (2021, January). Peta Sebaran Covid-19. Retrieved from Peta Sebaran Covid-
19: https://covid19.go.id/peta-sebaran-covid19
Sianturi, A. H., & Hidayat, F. A. (2021, January 19). Penambahan Kasus Positif Covid-19 di Sumut Masih Tinggi.
Retrieved January 2021, from beritasatu.com: https://www.beritasatu.com/nasional/721797/penambahan-
kasus-positif-covid19-di-sumut-masih-tinggi
Syafrida, & Hartati, R. (2020). Bersama Melawan Virus Covid 19 di Indonesia. SALAM; Jurnal Sosial & Budaya
Syar-i, 7(6), 495-508.
Triyani, E. (2020). Sistem Informasi Geografis Peta Sebaran Data Penyembuhan Covid-19 Daerah Kecamatan
Ciampea. PKM Maju UDA, 1(2), 56-64.
Ullah, A., Pinglu, C., Ullah, S., Abbas, H. S., & Khan, S. (2021). The Role of E‑ Governance in Combating
This is an Creative Commons License This work is licensed under a Creative
Commons Attribution-NoDerivatives 4.0 International License. 40Journal of Computer Networks, Architecture and
Submitted : 31 January 2021
High Performance Computing Accepted : 2 February 2021
Volume 3, Number 1, January 2021 Published : 6 February 2021
https://doi.org/10.47709/cnahpc.v3i1.930
COVID‑ 19 and Promoting Sustainable Development: A Comparative Study of China and Pakistan. Chinese
Political Science Review, 86-118.
Wijaya, Y. D. (2019). Sistem Informasi Penjualan Tiket Wisata Berbasis Web Menggunakan Metode Waterfall.
Seminar Nasional Teknologi Informasi dan Komunikasi 2019 (pp. 273-276). Universitas PGRI Madiun.
This is an Creative Commons License This work is licensed under a Creative
Commons Attribution-NoDerivatives 4.0 International License. 41You can also read