Atlantic salmon at West Greenland Summary of the advice for 2021-2023 - ICES
←
→
Page content transcription
If your browser does not render page correctly, please read the page content below
ICES Advice on fishing opportunities, catch, and effort
West of Greenland and Greenland Sea ecoregions
Published 7 May 2021
Version 2: 13 may 2021
Atlantic salmon at West Greenland

Summary of the advice for 2021–2023

ICES advises that, in line with the management objectives agreed by the North Atlantic Salmon Organization (NASCO) and
consistent with the MSY approach, the catch at West Greenland in 2021, 2022, and 2023 should be zero.

Mixed-stock fisheries present particular threats and should be managed based on the individual status of all stocks
exploited in the fishery.

The Framework of Indicators (FWI) was updated in support of the multiyear catch advice and the potential approval of
multiyear regulatory measures. The FWI can be applied at the beginning of 2022, using the returns or return rate data for
2021 to evaluate the appropriateness of the advice for 2022, and again at the beginning of 2023, using with the returns or
return rate data for 2022 to evaluate the appropriateness of the advice for 2023.

NASCO 4.1           Describe the key events of the 2020 fishery

Fishing for salmon using hooks and fixed gillnets is currently allowed along the entire west coast of Greenland (Figure 1).
Commercial fishers are allowed to fish using single gillnets fixed to the shore, with no limit on the number of gillnets that
can be used. Driftnetting has not been allowed since 2020. Private licensed fishers can only use one gillnet fixed to the
shore. Gillnets are the preferred gear in Greenland, but rod and reel catches and bycatch in poundnets are also noted in
small amounts within the catch reports.

The commercial fishery for export closed in 1998; the fishery for internal use, however, continues to date. Since 2002,
licensed commercial fishers have only been allowed to sell salmon to hotels, institutions, local markets, and factories when
factory landings were allowed. People fishing for private consumption only were not required to have a licence until 2018
and are prohibited from selling salmon.

In 2018, the Government of Greenland set a total quota for all components of the 2018–2020 fisheries to 30 t annually.
Within the regulatory measure (NASCO, 2018), the government agreed to continue its ban on the export of wild Atlantic
salmon or its products from Greenland and to prohibit landings and sales to fish processing factories. The government also
agreed to restrict the fishery from 15 August to no later than 31 October each year, and any overharvest in a particular
year would result in an equal reduction in the total allowable catch (TAC) the following year. The regulatory measure also
set out a number of provisions aimed at improving the monitoring, management control, and surveillance of the fishery.
These included a new requirement for all fishers (private and commercial) to obtain a licence to fish for Atlantic salmon,
an agreement to collect catch and fishing activity data from all licensed fishers, and mandatory reporting requirements of
all fishers. The measure also stated that as a condition of the licence, all fishers will be required to allow international
samplers to take samples of their catches upon request. The measure was applied to the 2018–2020 fisheries as the FWI
indicated no significant change in the catch advice provided prior to the 2019 and 2020 fisheries. Given the 2018 fishery
overharvest, the 2019 quota was set to 19.5 t. Given the 2019 fishery overharvest, the 2020 fishery quota was set to 20.7 t.

Reported (i.e. nominal) catches of Atlantic salmon at West Greenland (Figure 2; Table 1) increased through the 1960s,
reached a peak of approximately 2700 t in 1971, and then decreased until the closure of the commercial fishery for export
in 1998. Catches are reported from all six NAFO divisions, and proportions vary annually (Table 2). A total salmon catch of
31.7 t was reported for the 2020 fishery, an increase from the 2019 catch (29.8 t) but a harvest of 11 t over the 20.7 t quota
(Table 2). In 2020, commercial landings represented the majority of the harvest at 22.0 t (79.5%) and the remaining 9.7 t
(30.5%) was for private use, compared to 21.8 t and 7.6 t, respectively, in 2019 (Table 3). The mean percentage of
commercial landings registered for private use was 41 from 1997 to 2017 (excluding 2000 and 2001) and 0.2 from 2018 to
2020. Reported commercial and private landings by NAFO/ICES areas in 2020 are presented in Table 4. The number of
licences issued, the number of fishers that reported, and the number of reports received have all increased greatly since
2017, a result of the new regulatory measure requirements both for all fishers to obtain a licence and for mandatory
reporting (Figure 3).

The 2020 fishery opened on 1 September. On 17 September, more than 15 t of landings had been registered and, given
landings projections, the Government of Greenland announced the fishing season would end on 20 September. However,

ICES Advice 2021 – sal.wgc.all – https://doi.org/10.17895/ices.advice.8111
ICES advice, as adopted by its Advisory Committee (ACOM), is developed upon request
by ICES clients (European Union, Iceland, NASCO, NEAFC, Norway, and UK).                                                    1
ICES Advice on fishing opportunities, catch, and effort                                              Published 7 May 2021
sal.wgc.all

an approximate one-week delay from landings to registration of landings resulted in the quota being exceeded by 11 t.
Unreported catch is assumed to have been at the same level (10 t) as historically reported by the Greenlandic authorities.

An adjustment for some of the unreported catch has been carried out since 2002 using two approaches: 1) comparisons
of the sampling programme statistics and reported landings (adjusted landings [survey]) and 2) utilizing results from the
previously implemented phone surveys (adjusted landings [sampling]). Adjusted landings (sampling) are estimated by
comparing the weight of salmon observed by the sampling teams and the corresponding community-specific reported
landings for the entire fishing season. Sampling is not random and only occurs during part of the fishing season; it is
therefore not representative of the total unreported catch. An evaluation of non-reporting of harvest was not possible in
2020 due to international samplers not being in Greenland given travel restrictions associated with the COVID-19
pandemic. Adjusted landings (survey) are estimated from results of phone surveys, conducted after each of the fishing
seasons 2014–2016 in order to gain further information on inconsistencies in the reported catch data. Adjusted landings
(survey) are added to the adjusted landings (sampling) and reported landings to estimate the landings for assessment
(Table 5). Landings for assessment do not replace the official reported statistics.

The sampling programme for 2020 was modified from past efforts, because travel restrictions associated with the COVID-
19 pandemic meant that international samplers were not able to travel to Greenland to sample harvested Atlantic salmon.
Instead, individual sampling kits were provided to three groups of potential samplers located within Greenland: wildlife
officers from the Greenland Fisheries License Control Authority (GFLK), staff from the Greenland Institute of Nature
Resources (GINR), and individual fishers as part of a citizen science initiative. The sampling programme was marginally
successful because of the short fishing season and challenges associated with the COVID-19 pandemic. A total of 114
Atlantic salmon were sampled, but shipping delays prevented these samples from being processed. The samples will be
processed in 2021 and made available to support future assessment efforts.

A summary of the biological characteristics and continent and region of contributions to the harvest is therefore not
available for the 2020 catch, although the time-series of salmon sampled that were determined to be of North American
and European origin is presented in Figure 4. To mitigate for the lack of biological characteristics data and continent of
origin estimates for the 2020 fishery, five-year mean values were used in the North American Commission (NAC) and
North-East Atlantic Commission (NEAC) pre-fishery abundance run-reconstruction models, which generated estimates of
the number of North American (9600) and European (3200) fish harvested in 2020 (Figure 5). The total number of fish
harvested in 2020 (12 800) is an increase from the estimated number harvested in 2019 (9400) and approximate to the
previous ten-year mean (2010–2019; 11 900).

ICES Advice 2021                                                                                                        2
ICES Advice on fishing opportunities, catch, and effort                                                               Published 7 May 2021
sal.wgc.all

Table 1                Reported catches of salmon at West Greenland since 1960 (tonnes, round fresh weight) by participating nations. For
                       Greenlandic vessels specifically, all catches up to 1968 were taken with set gillnets only; catches 1968–2019 were
                       taken with both set gillnets and driftnets; and catches from 2020 to the present were taken with set gillnets only. All
                       non-Greenlandic vessel catches 1969–1975 were taken with driftnets. The quota figures applied to Greenlandic vessels
                       only, and entries in parentheses identify when quotas did not apply to all sectors of the fishery.
 Year     Norway          Faroes    Sweden     Denmark      Greenland    Total    Quota                       Comments
 1960              -            -          -            -          60       60
 1961              -            -          -            -         127      127
 1962              -            -          -            -         244      244
 1963              -            -          -            -         466      466
 1964              -            -          -            -        1539     1539
                                                                                           Norwegian harvest figures not available, but
 1965              -          36           -            -          825     858
                                                                                           known to be less than Faroese catch
 1966          32             87          -            -         1251     1370
 1967          78            155          -           85         1283     1601
 1968         138            134          4          272          579     1127
 1969         250            215         30          355         1360     2210
                                                                                           Greenlandic catch includes 7 t caught by
 1970         270            259           8         358         1244     2139
                                                                                           longlines in the Labrador Sea
 1971         340            255           -         645         1449     2689        -
 1972         158            144           -         401         1410     2113     1100
 1973         200            171           -         385         1585     2341     1100
 1974         140            110           -         505         1162     1917     1191
 1975         217            260           -         382         1171     2030     1191
 1976           -              -           -           -         1175     1175     1191
 1977           -              -           -           -         1420     1420     1191
 1978           -              -           -           -          984      984     1191
 1979           -              -           -           -         1395     1395     1191
 1980           -              -           -           -         1194     1194     1191
                                                                                           Quota set to a specific opening date for the
 1981              -            -          -            -        1264     1264     1265
                                                                                           fishery
                                                                                           Quota set to a specific opening date for the
 1982              -            -          -            -        1077     1077     1253
                                                                                           fishery
 1983              -            -          -            -          310     310     1191
 1984              -            -          -            -          297     297      870
 1985              -            -          -            -          864     864      852
 1986              -            -          -            -          960     960      909
 1987              -            -          -            -          966     966      935
                                                                                           Quota for 1988–1990 was 2520 t with an
                                                                                           opening date of 1 August. Annual catches were
 1988              -            -          -            -          893     893      840
                                                                                           not to exceed an annual average (840 t) by more
                                                                                           than 10%.
 1989              -            -          -            -          337     337      900    Quota adjusted to 900 t for later opening date
 1990              -            -          -            -          274     274      924    Quota adjusted to 924 t for later opening date
 1991              -            -          -            -          472     472      840
 1992              -            -          -            -          237     237      258
                                                                                           The fishery was suspended. NASCO adopt a new
 1993              -            -          -            -                             89
                                                                                           quota allocation model
                                                                                           The fishery was suspended and the quota was
 1994              -            -          -            -                           137
                                                                                           bought out
 1995              -            -          -            -           83      83       77
 1996              -            -          -            -           92      92      174
                                                                                           Private (non-commercial) catches to be
 1997              -            -          -            -           58      58        57
                                                                                           reported after 1997
                                                                                           Fishery restricted to catches used for internal
 1998              -            -          -            -           11      11        20
                                                                                           consumption in Greenland
 1999              -            -          -            -           19      19        20   Same as previous year
 2000              -            -          -            -           21      21        20   Same as previous year

ICES Advice 2021                                                                                                                           3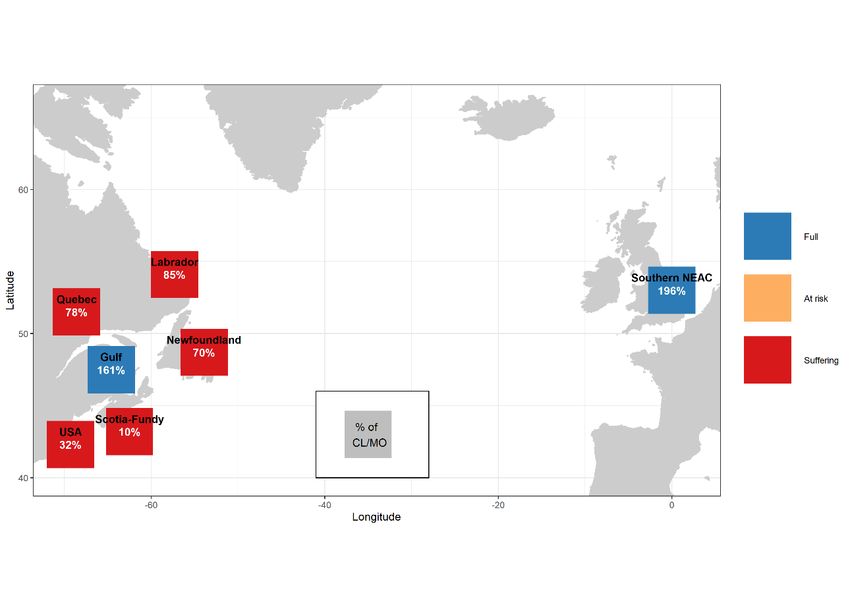
ICES Advice on fishing opportunities, catch, and effort                                                          Published 7 May 2021
sal.wgc.all

 Year     Norway       Faroes   Sweden     Denmark        Greenland   Total   Quota                     Comments
                                                                                      Final quota calculated according to the ad hoc
 2001              -        -          -            -            43     43      114
                                                                                      management system
                                                                                      Quota bought out; quota represented the
 2002              -        -          -            -             9      9       55   maximum allowable catch (no factory landing
                                                                                      allowed).
                                                                                      Quota set to nil (no factory landing allowed);
 2003              -        -          -            -             9      9            fishery restricted to catches used for internal
                                                                                      consumption in Greenland
 2004              -        -          -            -            15     15            Same as previous year
 2005              -        -          -            -            15     15            Same as previous year
 2006              -        -          -            -            22     22            Same as previous year
 2007              -        -          -            -            25     25            Same as previous year
 2008              -        -          -            -            26     26            Same as previous year
 2009              -        -          -            -            26     26            Same as previous year
 2010              -        -          -            -            40     40            Same as previous year
 2011              -        -          -            -            28     28            Same as previous year
 2012              -        -          -            -            33     33     (35)   35 t quota for factory landings only
 2013              -        -          -            -            47     47     (35)   Same as previous year
 2014              -        -          -            -            58     58     (30)   Quota for factory landings only
                                                                                      Quota for all sectors (private and commercial) of
 2015              -        -          -            -            57     57       45
                                                                                      the fishery
 2016              -        -          -            -            27     27      32    Same as previous year
 2017              -        -          -            -            28     28      45    Same as previous year
 2018              -        -          -            -            40     40      30    Same as previous year
 2019              -        -          -            -            30     30     19.5   Same as previous year
 2020              -        -          -            -            32     32      21    Same as previous year

ICES Advice 2021                                                                                                                      4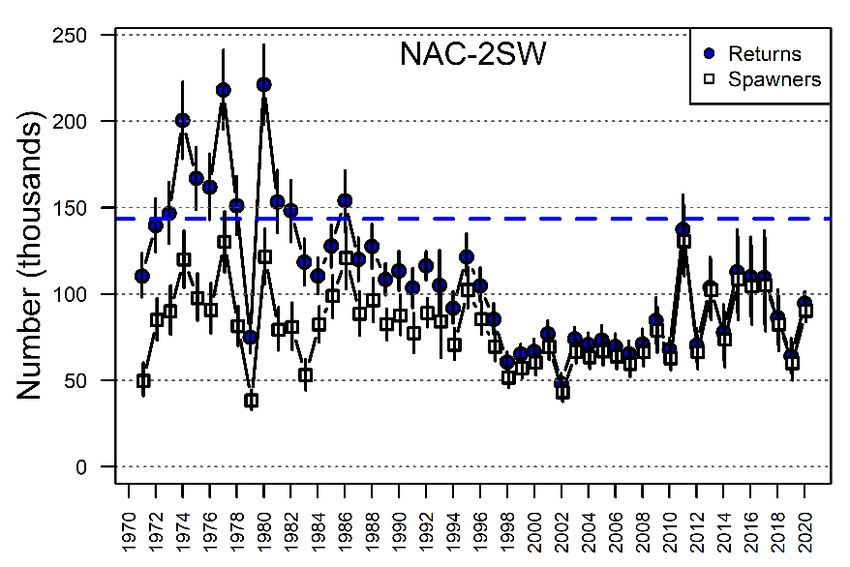
ICES Advice on fishing opportunities, catch, and effort Published 7 May 2021
sal.wgc.all
Table 2 Annual distribution of reported catches (in tonnes) at Greenland by NAFO division (when known). NAFO divisions are
shown in Figure 1. Since 2005, gutted weights have been reported and converted to total weight by a factor of 1.11.
Rounding issues are evident for some totals.
NAFO Division
Year Unknown West Greenland East Greenland Total
1A 1B 1C 1D 1E 1F
1960 60 60 60
1961 127 127 127
1962 244 244 244
1963 1 172 180 68 45 466 466
1964 21 326 564 182 339 107 1539 1539
1965 19 234 274 86 202 10 36 861 861
1966 17 223 321 207 353 130 87 1338 1338
1967 2 205 382 228 336 125 236 1514 1514
1968 1 90 241 125 70 34 272 833 833
1969 41 396 245 234 370 867 2153 2153
1970 58 239 122 123 496 207 862 2107 2107
1971 144 355 724 302 410 159 560 2654 2654
1972 117 136 190 374 385 118 703 2023 2023
1973 220 271 262 440 619 329 200 2341 2341
1974 44 175 272 298 395 88 645 1917 1917
1975 147 468 212 224 352 185 442 2030 2030
1976 166 302 262 225 182 38 1175 1175
1977 201 393 336 207 237 46 - 1420 6 1426
1978 81 349 245 186 113 10 - 984 8 992
1979 120 343 524 213 164 31 - 1395 + 1395
1980 52 275 404 231 158 74 - 1194 + 1194
1981 105 403 348 203 153 32 20 1264 + 1264
1982 111 330 239 136 167 76 18 1077 + 1077
1983 14 77 93 41 55 30 - 310 + 310
1984 33 116 64 4 43 32 5 297 + 297
1985 85 124 198 207 147 103 - 864 7 871
1986 46 73 128 203 233 277 - 960 19 979
1987 48 114 229 205 261 109 - 966 + 966
1988 24 100 213 191 198 167 - 893 4 897
1989 9 28 81 73 75 71 - 337 - 337
1990 4 20 132 54 16 48 - 274 - 274
1991 12 36 120 38 108 158 - 472 4 476
1992 - 4 23 5 75 130 - 237 5 242
1993* - - - - - - - - - -
1994* - - - - - - - - - -
1995 + 10 28 17 22 5 - 83 2 85
1996 + + 50 8 23 10 - 92 + 92
1997 1 5 15 4 16 17 - 58 1 59
1998 1 2 2 4 1 2 - 11 - 11
1999 + 2 3 9 2 2 - 19 + 19
2000 + + 1 7 + 13 - 21 - 21
2001 + 1 4 5 3 28 - 43 - 43
2002 + + 2 4 1 2 - 9 - 9
2003 1 + 2 1 1 5 - 9 - 9
2004 3 1 4 2 3 2 - 15 - 15
2005 1 3 2 1 3 5 - 15 - 15
2006 6 2 3 4 2 4 - 22 - 22
2007 2 5 6 4 5 2 - 25 - 25
2008 4.9 2.2 10.0 1.6 2.5 5.0 0 26.2 0 26.2
2009 0.2 6.2 7.1 3.0 4.3 4.8 0 25.6 0.8 26.3
2010 17.3 4.6 2.4 2.7 6.8 4.3 0 38.1 1.7 39.6
2011 1.8 3.7 5.3 8.0 4.0 4.6 0 27.4 0.1 27.5
2012 5.4 0.8 15.0 4.6 4.0 3.0 0 32.6 0.5 33.1
2013 3.1 2.4 17.9 13.4 6.4 3.8 0 47.0 0.0 47.0
ICES Advice 2021 5ICES Advice on fishing opportunities, catch, and effort Published 7 May 2021
sal.wgc.all
NAFO Division
Year Unknown West Greenland East Greenland Total
1A 1B 1C 1D 1E 1F
2014 3.6 2.8 13.8 19.1 15.0 3.4 0 57.8 0.1 57.9
2015 0.8 8.8 10.0 18.0 4.2 14.1 0 55.9 1.0 56.8
2016 0.8 1.2 7.3 4.6 4.5 7.3 0 25.7 1.5 27.1
2017 1.1 1.7 9.3 6.9 3.2 5.6 0 27.8 0.3 28.0
2018 2.4 5.7 13.7 8.2 4.2 4.8 0 39.0 0.8 39.9
2019 0.8 3.0 4.4 8.0 4.8 7.3 0 28.3 1.4 29.8
2020 0.9 3.6 6.6 9.7 3.0 7.1 0 30.9 0.8 31.7
* The fishery was suspended.
+ Small catches, < 0.5 t.
- No catch.
Table 3 Reported 2019 and 2020 catches (in tonnes) by license type and landings category. Licences for private fishers were
introduced in 2018. Entries of 0.0 represent reported values of < 0.1. Note: Due to rounding, numbers presented may
not add up precisely to the totals indicated.
Licence status Landings type Reported 2019 catch Reported 2020 catch
Commercial (from commercial fishers) 21.8 22.0
Licensed
Private use (from commercial fishers) 0.1 0
Commercial use (from private fishers) 0.2 0
Private use (from private fishers) 7.6 9.7
Total commercial catch 22.0 22.0
Total private use catch 7.7 9.7
Total catch 29.8 31.7
Table 4 Reported 2020 landings in NAFO/ICES areas (in tonnes) by licence type, landing category, the number of fishers
reporting, and the total number of landing reports received. Empty cells identify categories with no reported landings
and 0.0 entries represent reported values of < 0.1. Note: due to rounding, numbers presented may not add up
precisely to the totals indicated.
NAFO/ICES Licence type No. of fishers No. of reports Commercial Private Total
Private 41 58 0.2 0.2
NAFO 1A Commercial 59 120 0.7 0.7
Total 100 178 0.7 0.2 0.9
Private 42 92 0.5 0.5
NAFO 1B Commercial 47 147 3.1 3.1
Total 89 239 3.1 0.5 3.6
Private 28 47 0.8 0.8
NAFO 1C Commercial 75 181 5.8 5.8
Total 103 228 5.8 0.8 6.6
Private 116 171 2.8 2.8
NAFO 1D Commercial 35 102 7.0 7.0
Total 151 273 7.0 2.8 9.7
Private 27 47 1.1 1.1
NAFO 1E Commercial 20 44 1.9 1.9
Total 47 91 1.9 1.1 3.0
Private 79 191 3.9 3.9
NAFO 1F Commercial 39 93 3.2 3.2
Total 118 284 3.2 3.9 7.1
Private 8 23 0.5 0.5
ICES Subarea 14 Commercial 2 5 0.3 0.3
Total 10 28 0.3 0.5 0.8
Private 341 629 9.7 9.7
ALL Commercial 277 692 22.0 22.0
Total 618 1321 22.0 9.7 31.7
ICES Advice 2021 6ICES Advice on fishing opportunities, catch, and effort Published 7 May 2021
sal.wgc.all
Table 5 Reported landings and adjusted landings (in tonnes) for the assessment of Atlantic salmon at West Greenland 2002–
2020. The total adjusted landings do not include the unreported catch (ten tonnes per year since 2000).
Reported landings Adjustment to landings Adjustment to landings Total adjusted
Year
(West Greenland) (sampling) (survey) landings
2002 9.0 0.7 - 9.8
2003 8.7 3.6 - 12.3
2004 14.7 2.5 - 17.2
2005 15.3 2.0 - 17.3
2006 23.0 0.0 - 23.0
2007 24.6 0.2 - 24.8
2008 26.1 2.5 - 28.6
2009 25.5 2.5 - 28.0
2010 37.9 5.1 - 43.1
2011 27.4 0.0 - 27.4
2012 32.6 2.0 - 34.6
2013 46.9 0.7 - 47.7
2014 57.7 0.6 12.2 70.5
2015 55.9 0.0 5.0 60.9
2016 25.7 0.3 4.2 30.2
2017 27.8 0.3 - 28.0
2018 39.0 0.0 - 39.0
2019 28.3 0.0 - 28.3
2020 30.9 - -
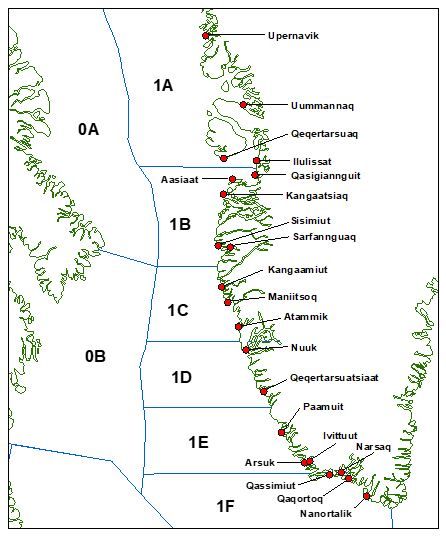
Figure 1 Map of communities in West Greenland where Atlantic salmon have historically been landed and the corresponding
NAFO divisions (1A–1F).
ICES Advice 2021 7ICES Advice on fishing opportunities, catch, and effort Published 7 May 2021
sal.wgc.all
3000 Total Quota
2500
2000
Catches (t)
1500
1000
500
0
1960 1967 1974 1981 1988 1995 2002 2009 2016
Year
Commercial fisher (Commercial use)
60.0 Commercial fisher (Private use)
Private fisher (Private use)
50.0 Factory
Total Quota
40.0
Catches (t)
30.0
20.0
10.0
0.0
2011 2012 2013 2014 2015 2016 2017 2018 2019 2020
Year
Figure 2 Reported landings and commercial quotas (tonnes, round fresh weight) of salmon at West Greenland from 1960 to
2020 (upper panel). Landings from 2011 to 2020 are also displayed by landing type (lower panel). No quotas were set
for 2002–2011, and the quotas for 2012–2014 were for factory landings only.
ICES Advice 2021 8ICES Advice on fishing opportunities, catch, and effort Published 7 May 2021
sal.wgc.all
800
No. licenses (Total)
No. licenses (Comm.)
No. licenses (Priv.)
600
400
200
0
1998 2000 2002 2004 2006 2008 2010 2012 2014 2016 2018 2020
800
No. Reporting (Total)
No. Reporting (Comm.)
No. Reporting (Priv.)
600
400
200
0
1998 2000 2002 2004 2006 2008 2010 2012 2014 2016 2018 2020
100%
% Reporting (Comm.)
80% % Reporting (Priv.)
60%
40%
20%
0%
1998 2000 2002 2004 2006 2008 2010 2012 2014 2016 2018 2020
Figure 3 Number of licences issued by licence type (upper panel), number of fishers reporting by licence type (middle panel),
and percent of licensed fishers reporting by licence type (lower panel). Starting in 2018 all fishers were required to
have a licence.
ICES Advice 2021 9ICES Advice on fishing opportunities, catch, and effort Published 7 May 2021
sal.wgc.all
100%
80%
60%
Percent
40%
European
20%
North American
0%
1982 1986 1990 1994 1998 2002 2006 2010 2014 2018
Year
Figure 4 Estimated percent of continental origin of Atlantic salmon harvested at West Greenland from 1982 to 2019. No
estimate is available for 2020 because of restrictions associated with the COVID-19 pandemic.
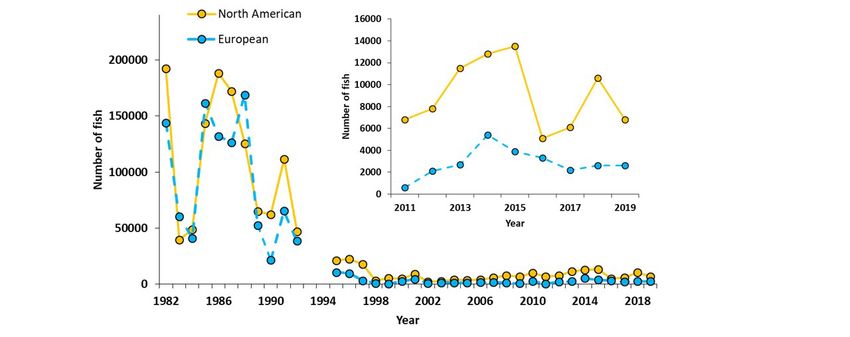
Figure 5 Number of North American and European Atlantic salmon caught at West Greenland in 1982–2019 and 2011–2019
(inset). Estimates are based on continent of origin by NAFO division, weighted by catch (weight) in each division.
Unreported catch is not included. No estimate is available for 2020 because of restrictions associated with the
COVID-19 pandemic.
ICES Advice 2021 10ICES Advice on fishing opportunities, catch, and effort Published 7 May 2021 sal.wgc.all NASCO 4.2 Describe the status of the stocks Recruitment (pre-fishery abundance [PFA]) estimates of non-maturing 1SW salmon at Greenland show continued low abundance compared to historical levels. PFA estimates are currently below the spawner escapement reserves (SER) for the NAC stock complex (Figure 6) but above for the Southern NEAC stock complex (Figure 7). The CLs and SERs for the Southern NEAC complexes have been revised downwards substantially compared to last year due to changes in UK (Northern Ireland) and particularly UK (Scotland) estimates. In 2020, the estimates (median) of 2SW salmon returns to rivers and spawners were below CLs (suffering reduced reproductive capacity) in the NAC assessment regions except for the Gulf region; for spawners, the percentage of the CL ranged from 10% in Scotia–Fundy to 161% in Gulf (Figure 8). Particularly large deficits relative to CLs and rebuilding management objectives are noted in the Scotia–Fundy and USA regions. The Gulf status was assessed using the previous five-year mean as a proxy for the unavailable 2020 input data. This is not expected to have caused the substantial increase in returns and spawners to this region in 2020 compared to the previous year. The increase appears to be a true reflection of the increased escapement in the region, which was also mirrored to a degree in the adjacent areas Quebec, Labrador, and Newfoundland in 2020 relative to 2019. The exploitation rate (catch in Greenland divided by PFA) in 2019 was 6.0% for NAC fish and 0.7% for Southern NEAC fish (Figure 9). Despite major changes in fisheries management in the past few decades and increasingly more restrictive fisheries measures, returns have remained low compared to historical levels. It is likely, therefore, that other factors besides fisheries are constraining production. ICES Advice 2021 11
ICES Advice on fishing opportunities, catch, and effort Published 7 May 2021
sal.wgc.all
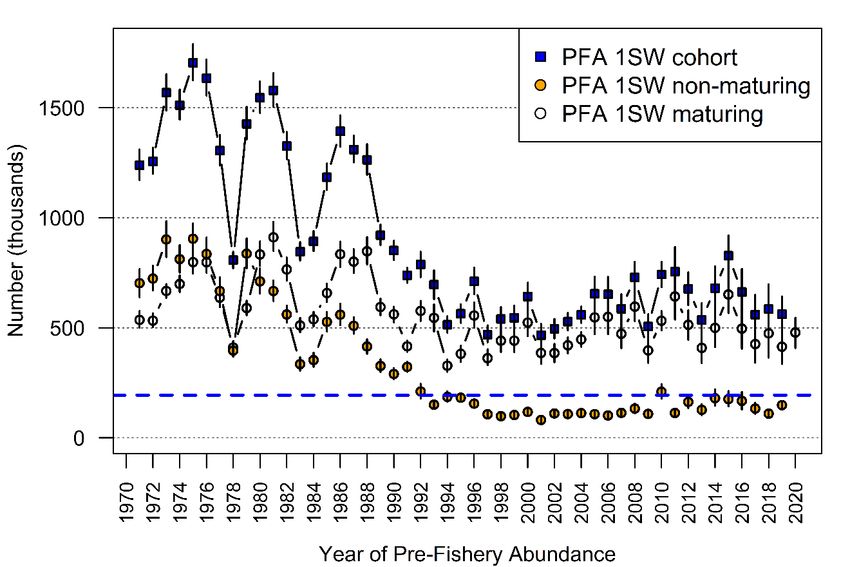
Figure 6 Upper panel: estimated (median, 5th to 95th percentile range; in thousands) returns (blue circles) and spawners
(white squares) of 2SW salmon for the NAC area in 1971–2020. The dashed blue line is the corresponding 2SW CL for
NAC. Bottom panel: estimated (median, 5th to 95th percentile range; in thousands) PFA for 1SW maturing, 1SW
non-maturing, and the total cohort of 1SW salmon for the NAC area in PFA years 1971–2019. The dashed horizontal
blue line is the corresponding sum of the 2SW CLs for NAC, corrected for 11 months of natural mortality against which
1SW non-maturing salmon are assessed.
ICES Advice 2021 12ICES Advice on fishing opportunities, catch, and effort Published 7 May 2021
sal.wgc.all
Figure 7 Estimated spawners with 90% confidence limits for MSW salmon for Southern NEAC (right panel). The dashed line is
the corresponding MSW conservation limit for Southern NEAC. Estimated PFA with 90% confidence limits for
non-maturing 1SW salmon for Southern NEAC (left panel). The dashed line is the corresponding SER for Southern
NEAC.
Figure 8 Summary of 2SW (NAC regions) and MSW (Southern NEAC) 2020 median (from the Monte Carlo posterior
distributions) spawner estimates in relation to CLs or management objectives (only for USA and Scotia–Fundy). The
colours used as shading represent the three ICES stock status designations: blue – Full (at full reproductive capacity:
the 5th percentile of the spawner estimate is above the CL); orange – At risk (at risk of suffering reduced reproductive
capacity: the median spawner estimate is above but the 5th percentile below the CL); and red – Suffering (suffering
reduced reproductive capacity: the median spawner estimate is below the CL).
ICES Advice 2021 13ICES Advice on fishing opportunities, catch, and effort Published 7 May 2021
sal.wgc.all
North American European
45%
40%
35%
30%
Exploitation rate
25%
20%
15%
10%
5%
0%
1971 1976 1981 1986 1991 1996 2001 2006 2011 2016
Year
15%
Exploitation rate
10%
5%
0%
2010 2011 2012 2013 2014 2015 2016 2017 2018 2019
Year
Figure 9 Exploitation rate (%) for NAC 1SW non-maturing and Southern NEAC non-maturing Atlantic salmon at West Greenland
in 1971–2019 (upper panel) and 2010–2019 (lower panel). Exploitation rate estimates are only available up to 2019,
as 2020 exploitation rates are dependent on 2021 returns.
NASCO 4.3 Provide catch options or alternative management advice for 2021–2023 with an assessment of
risk relative to the objective of exceeding stock conservation limits, or pre-defined NASCO
Management Objectives, and advise on the implications of these options for stock rebuilding
The management advice for the West Greenland fishery for 2021 to 2023 is based on the models used by ICES since 2003
and was most recently revised in 2018 (ICES, 2018). ICES followed the processes developed in previous years for providing
management advice and catch options for West Greenland using the PFA and CLs or alternate management objectives for
the NAC and NEAC areas (Table 6). The risks of the Greenland fishery to NAC and NEAC stock complexes are developed in
parallel and combined into a single catch options table (Table 7). In summary, none of the stated management objectives
would allow a mixed-stock fishery at West Greenland to take place in 2021, 2022, or 2023. Specifically:
• Newfoundland has the lowest probabilities of any of the four northern regions of reaching the CLs; these were
estimated to be 0.51, 0.44, and 0.30 for the years 2021, 2022, and 2023, respectively (Table 7).
• In the absence of any marine fishing mortality at Greenland and North America, there is a low probability (from
0.01 to 0.03) that the returns in the southern region of Scotia–Fundy will be sufficient to meet the stock
ICES Advice 2021 14ICES Advice on fishing opportunities, catch, and effort Published 7 May 2021
sal.wgc.all
rebuilding objective during the period 2021–2023 (Table 7). The probability of meeting or exceeding the stock
rebuilding objective of the USA region is estimated at 0.11–0.23 over the three years.
• In the absence of any marine fishing mortality at Greenland and in NEAC, the probabilities of meeting or
exceeding the SER for the Southern NEAC MSW complex are 0.93, 0.83, and 0.75 in 2021–2023, respectively
(Table 7).
• In the absence of any fishing mortality on these stocks, there is a near zero probability (0.004–0.006) of meeting
or exceeding the seven management objectives simultaneously in 2021–2023 (Table 7).
Relevant factors to be considered in management
The management of all fisheries should be based upon assessments of the status of individual stocks. Fisheries on
mixed-stocks, particularly in coastal waters or on the high seas, pose particular difficulties for management as they target
all stocks present, whether or not they are meeting their individual CLs. Conservation would be best achieved if fisheries
target stocks that have been shown to be meeting CLs. Fisheries in estuaries and especially rivers are more likely to meet
this requirement.
The salmon caught in the West Greenland fishery are mostly (> 90%) non-maturing 1SW salmon, most of which are
destined to return to home waters in Europe or North America as 2SW fish. European stocks contributing to the fishery in
West Greenland mainly originate in the southern MSW stock complex, although small numbers may also originate in
northern Europe. Most MSW stocks in North America contribute to the fishery at West Greenland. Previous spawners,
including salmon that spawned first as 1SW and 2SW salmon, also contribute to the fishery although in low (< 5%)
proportions.
Table 6 Management objectives and equivalent number of fish relevant to the development of catch options at West
Greenland for the six geographic areas in the NAC area and the Southern NEAC non-maturing complex.
Area Objective Number of fish
USA 2SW proportion of recovery criteria 4549
25% increase from 2SW returns during
Scotia–Fundy 10976
1992 to 1997
Gulf 2SW conservation limit 18737
Québec 2SW conservation limit 32085
Newfoundland 2SW conservation limit 4022
Labrador 2SW conservation limit 34746
MSW conservation limit 174735
Southern NEAC non-maturing complex (Spawner escapement reserve to Jan. 1 of 295582
first winter at sea)
ICES Advice 2021 15ICES Advice on fishing opportunities, catch, and effort Published 7 May 2021
sal.wgc.all
Table 7 Catch options tables for the mixed-stock fishery at West Greenland by PFA year 2021 to 2023.
Probability of meeting or exceeding region-specific management objectives
S COTIA – S OUTHERN
L ABRADOR N EWFOUNDLAND Q UÉBEC G ULF USA S IMULTANEOUS
F UNDY NEAC
2021 Catch options (tonnes)
0 0.75 0.51 0.60 0.92 0.01 0.11 0.93 0.004
10 0.73 0.49 0.58 0.91 0.01 0.10 0.93 0.004
20 0.72 0.47 0.55 0.90 0.01 0.10 0.93 0.004
30 0.70 0.45 0.52 0.88 0.01 0.09 0.92 0.004
40 0.68 0.44 0.50 0.87 0.01 0.09 0.92 0.004
50 0.67 0.42 0.47 0.86 0.01 0.08 0.92 0.003
60 0.65 0.40 0.45 0.84 0.01 0.08 0.92 0.003
70 0.63 0.38 0.42 0.83 0.01 0.08 0.92 0.003
80 0.61 0.36 0.40 0.81 0.01 0.07 0.91 0.003
90 0.59 0.34 0.37 0.79 0.01 0.07 0.91 0.003
100 0.57 0.32 0.35 0.77 0.01 0.07 0.91 0.003
2022
0 0.73 0.44 0.47 0.90 0.03 0.15 0.83 0.006
10 0.72 0.42 0.44 0.88 0.03 0.15 0.82 0.006
20 0.70 0.40 0.42 0.87 0.03 0.15 0.82 0.005
30 0.68 0.39 0.40 0.86 0.03 0.14 0.81 0.004
40 0.67 0.37 0.38 0.85 0.03 0.14 0.81 0.004
50 0.65 0.35 0.37 0.83 0.03 0.13 0.81 0.004
60 0.63 0.34 0.35 0.82 0.03 0.13 0.80 0.004
70 0.62 0.32 0.33 0.80 0.02 0.12 0.80 0.004
80 0.60 0.31 0.31 0.78 0.02 0.12 0.79 0.004
90 0.58 0.29 0.30 0.76 0.02 0.12 0.79 0.004
100 0.57 0.28 0.28 0.74 0.02 0.11 0.78 0.004
2023
0 0.67 0.30 0.46 0.83 0.03 0.23 0.75 0.005
10 0.66 0.28 0.44 0.82 0.03 0.22 0.74 0.005
20 0.64 0.27 0.43 0.80 0.03 0.22 0.74 0.005
30 0.63 0.26 0.41 0.79 0.03 0.21 0.74 0.005
40 0.61 0.25 0.39 0.77 0.03 0.21 0.73 0.005
50 0.60 0.24 0.37 0.76 0.02 0.20 0.73 0.004
60 0.58 0.23 0.35 0.73 0.02 0.19 0.72 0.004
70 0.56 0.22 0.34 0.72 0.02 0.19 0.72 0.004
80 0.55 0.20 0.32 0.70 0.02 0.18 0.71 0.004
90 0.53 0.19 0.30 0.69 0.02 0.18 0.71 0.004
100 0.51 0.18 0.29 0.67 0.02 0.17 0.70 0.003
NASCO 4.4 Update the Framework of Indicators used to identify any significant change in the previously
provided multi-annual management advice
An updated Framework of Indicators (FWI) that can be used to identify any significant change in the previously provided
multiannual management advice has been provided. The update consisted of:
• Adding the values of the indicator variables for the most recent years;
• Running the objective function spreadsheet for both each indicator variable and the variable of interest relative
to the management objectives;
• Quantifying the threshold value for the indicator variables and the probabilities of a true high state and a true low
state for those variables retained for the framework;
• Revising/adding the indicator variables and the functions for evaluating the indicator score to the framework
spreadsheet;
• Providing the spreadsheet for carrying out the FWI assessment.
ICES Advice 2021 16ICES Advice on fishing opportunities, catch, and effort Published 7 May 2021
sal.wgc.all
The updated FWI contains 19 indicator variables, represented by 13 different rivers (Figure 10). Of these variables, two
were survival rate indicators, while of the remainder 13 were indicators of 2SW and large salmon and four were indicators
of wild 1SW and small salmon returns to rivers. No indicator variables were retained for the Labrador, Newfoundland or
Southern NEAC. Although informative for the mixed fisheries in the NEAC, the Faroe FWI is uninformative for the West
Greenland fishery.
The FWI can be applied at the beginning of 2022, using the returns or return rate data for 2021 to evaluate the
appropriateness of the advice for 2022, and again at the beginning of 2023, using the returns or return rate data for 2022
to evaluate the appropriateness of the advice for 2023.
Figure 10 FWI spreadsheet for the West Greenland fishery. For illustrative purposes, the 2020 value of returns or survival rates
for the 19 retained indicators is entered in the cells corresponding to the annual indicator variable values.
ICES Advice 2021 17ICES Advice on fishing opportunities, catch, and effort Published 7 May 2021 sal.wgc.all Identify relevant data deficiencies, monitoring needs, and research requirements No data deficiencies, monitoring needs, or research requirements of relevance to the West Greenland Commission were identified. The full list of data deficiencies, monitoring needs, and research requirements for North Atlantic salmon is presented in Section 1.45 of the sal.oth.nasco advice (ICES, 2021c). References ICES. 2018. North Atlantic Salmon Stocks. In Report of the ICES Advisory Committee, 2018. ICES Advice 2018, Book 14, sal.oth.nasco. 33 pp. https://doi.org/10.17895/ices.pub.4335. NASCO. 2018. Multi-Annual Regulatory Measure for Fishing for Atlantic Salmon at West Greenland. NASCO WGC (18)11. 2 pp. http://www.nasco.int/2018commissiondocs.html. ICES. 2021a. Advice on fishing opportunities. In Report of the ICES Advisory Committee, 2021. ICES Advice 2021, section 1.1.1. https://doi.org/10.17895/ices.advice.7720. ICES. 2021b. Atlantic salmon Stock Annex (sal.27.neac_SA). In Working Group on North Atlantic Salmon (WGNAS). ICES Scientific Reports 3:29. 407 pp. https://doi.org/10.17895/ices.pub.7923. ICES. 2021c. Report of the Working Group on North Atlantic Salmon (WGNAS), 22 March–1 April 2021, Virtual meeting. ICES Scientific Reports, 3:29. 407 pp. http://doi.org/10.17895/ices.pub.7923. Recommended citation: ICES. 2021. Atlantic salmon at West Greenland. In Report of the ICES Advisory Committee, 2021. ICES Advice 2021, sal.wgc.all. https://doi.org/10.17895/ices.advice.8111 ICES Advice 2021 18
ICES Advice on fishing opportunities, catch, and effort                                               Published 7 May 2021
sal.wgc.all

Annex 1             Glossary of acronyms and abbreviations

1SW   one-sea-winter. Maiden adult salmon that has spent one winter at sea.
2SW   two-sea-winter. Maiden adult salmon that has spent two winters at sea.
CL(s) conservation limits(s), i.e. Slim. Demarcation of undesirable stock levels or levels of fishing activity; the ultimate
      objective when managing stocks and regulating fisheries is to ensure that there is a high probability that
      undesirable levels are avoided.
ICES  International Council for the Exploration of the Sea
NAC   North American Commission. A commission under NASCO.
NAFO Northwest Atlantic Fisheries Organization. An intergovernmental fisheries science and management organization
      that ensures the long-term conservation and sustainable use of fishery resources in the Northwest Atlantic.
NASCO North Atlantic Salmon Conservation Organization
NEAC North-East Atlantic Commission. A commission under NASCO.
PFA   pre-fishery abundance. The numbers of salmon estimated to be alive in the ocean from a particular stock at a
      specific time.

ICES Advice 2021                                                                                                        19
ICES Advice on fishing opportunities, catch, and effort Published 7 May 2021 sal.wgc.all Annex 2 General considerations Management plans The North Atlantic Salmon Conservation Organization (NASCO) has adopted an Action Plan for Application of the Precautionary Approach, which stipulates that management measures should be aimed at maintaining all stocks above their CLs by the use of management targets. CLs for North Atlantic salmon stock complexes have been defined by ICES as the level of a stock (number of spawners) that will achieve long-term average maximum sustainable yield (MSY). NASCO has adopted the region-specific CLs as limit reference points (Slim); having populations fall below these limits should be avoided with high probability. Within the management plan, a simultaneous risk level (probability) of 75% has been agreed for the provision of catch advice on the stock complexes exploited at West Greenland (non-maturing 1SW fish from North America and Southern NEAC). The management objectives are to meet (a) the Southern NEAC MSW CL, (b) the 2SW CLs for the four northern areas of the NAC (Labrador, Newfoundland, Quebec, and Gulf) to achieve a 25% increase in returns of 2SW salmon from the average returns in the period 1992–1996 for the Scotia–Fundy region of NAC, and (c) to achieve 2SW adult returns of 4549 fish or greater for USA region of NAC. An FWI of indicators has been developed in support of the multiannual catch options. Biology Atlantic salmon (Salmo salar) is an anadromous species found in rivers of countries bordering the North Atlantic. In the Northeast Atlantic area its current distribution extends from the Lima River (41°69’) in northern Portugal to the Pechora River (68°20’) in Northwest Russia and Iceland (66°44’). In the Northwest Atlantic distribution ranges from the Connecticut River (USA, 41°.6°’N) northwards to 60°29’ N in the Ungava Bay (Quebec, Canada). Juveniles migrate to the ocean at ages of between one and eight years (dependent on latitude) and generally return after one or two years at sea. Long-distance migrations to ocean feeding grounds are known to take place, with adult salmon from both the North American and Northeast Atlantic stocks migrating to Greenland to feed during their second summer and autumn at sea. Environmental and other influences on the stock * Environmental conditions in both freshwater and marine environments have a marked effect on the status of salmon stocks. Across the North Atlantic, a range of problems in the freshwater environment play a significant role in explaining the poor status of stocks. In many cases river damming and habitat deterioration have had a devastating effect on freshwater environmental conditions. In the marine environment, return rates of adult salmon have declined through the 1980s and are now at the lowest levels in the time-series for some stocks, even after closure of marine fisheries. Climatic factors modifying ecosystem conditions, and the impact of predators of salmon at sea, are considered to be the main factors contributing to lower productivity, which is expressed almost entirely in terms of lower marine survival. Effects of the fisheries on the ecosystem The current salmon fishery uses nearshore surface gillnets. There is no information on bycatch of other species with this gear. The fisheries probably have no influence, or only a minor influence, on the marine ecosystem. Quality considerations Uncertainties in input variables to the stock status and stock forecast models are incorporated in the assessment. Catch reporting at Greenland is considered to be incomplete. The COVID-19 pandemic prevented the international sampling programme from taking place, which resulted in no data on biological characteristics, continent/region of origin, and non-reporting of harvest being available for 2020. Previous five-year mean values were used for the 2020 biological characteristics of salmon in the fishery at West Greenland. For the * Version 2: Section header corrected. ICES Advice 2021 20
ICES Advice on fishing opportunities, catch, and effort                                                         Published 7 May 2021
sal.wgc.all

2020 assessment year, previous five-year mean values were used in some regions of NAC because of the impact of the
COVID-19 pandemic on field programmes.

Scientific basis

Table A1         Atlantic Salmon at West Greenland. The basis of the assessment.
 ICES stock data category        1 (ICES, 2021a)
 Assessment type                 Run–reconstruction models and Bayesian forecasts, taking into account uncertainties in the data
 Input data                      Reported (i.e. nominal) catches (by sea-age class and continent of origin) for internal use fisheries
                                 Estimates of unreported/illegal catches
                                 Estimates of exploitation rates
                                 Natural mortalities (from earlier assessments)
 Discards and bycatch            No salmon discards in the directed salmon fishery
 Indicators                      An FWI is used to indicate whether a significant change has occurred in the status of stocks in
                                 intermediate years where multi-annual management advice applies
 Other information               Advice subject to annual review. Stock annex completed in 2014 and updated in 2021 (ICES, 2021b)
 Working group                   Working Group on North Atlantic Salmon (WGNAS) (ICES, 2021c)

ICES Advice 2021                                                                                                                    21
You can also read