European Grocery Retailing - Change is the only constant Kelly Tackett - Planet Retail
←
→
Page content transcription
If your browser does not render page correctly, please read the page content below
European Grocery Retailing
    Change is the only constant

May 2014                             Kelly Tackett
planetretail.net
1                                 Research Director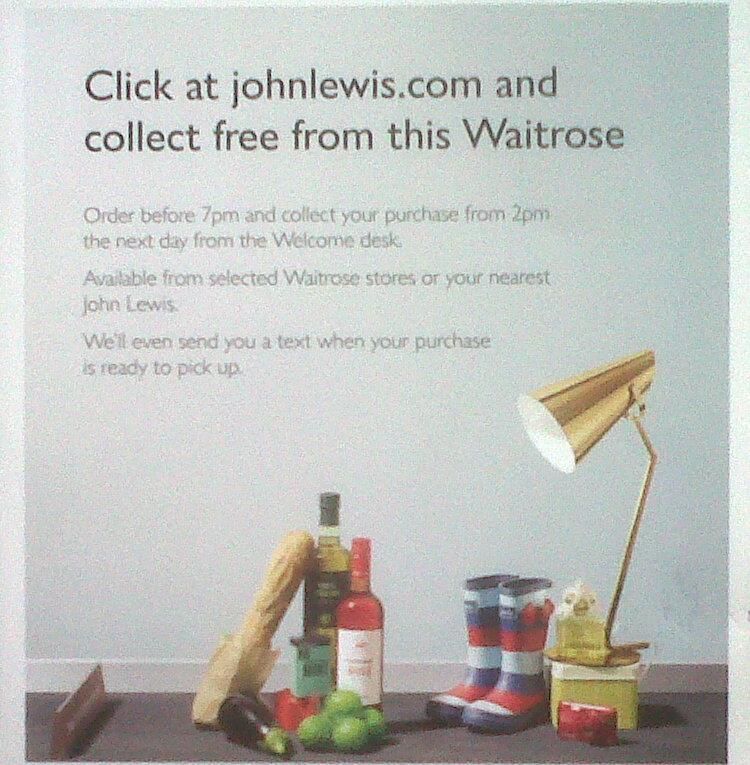
Agenda

    1. Market Overview
    2. Leading Retailers
    3. Key Trends
    4. Takeaways

2
1. Market Overview
Economic recovery is not universal…
                                                               GDP Real Growth 2013 (%)
                                                                               +1.5%                                  Finland
                                                          +0.8%
                                                                              Sweden
                                                                                                                      -1.4%
                                                          Norway
                                                                                                                +0.8%
                                                                                                                         +4.2%                                      +1.3%

                                                                                                      +3.1% Estonia
                                                              +0.4%                                                                                                 Russia
                                                                                                                        Latvia
                                                         Denmark
                                                                                                          Lithuania                +0.9%
                                 +1.8%                                                            +1.6%
                                                                                                                                  Belarus
          Ireland                               Netherlands      +0.5%
                                 United      +0.3%                                               Poland
                                Kingdom                                                                                                    +8.9%
          -0.3%                                       -0.8%     Germany                               +0.9%
                                            Belgium                              Czech Rep
                                                               +2.0%                            +1.1%                     +3.5%                    Ukraine
                                                                              +0.4%                  Slovakia
                                          +0.3%                                         -0.9%                                                      +0.0%
                                                                              Austria            Hungary
                                          France          Switzerland
                                                                                                             +2.5%       Romania        Moldova
                                                                               Slovenia           +1.2%
                                                                                     Croatia
                                                                      Italy                                           +3.1% +0.9%                                            +3.2%
                                                                                -1.1%            Bosnia &
                                                                                        -1.0% Herzegovina Serbia                                                                       +3.2%
                                                                                                                            Bulgaria                                                           +5.8%
                                                                  -1.9%                              +0.7%
                                                                                                                Macedonia                                                    Georgia
     Portugal
                             Spain                                                                  Albania                                                                          Armenia
                                                                                                                Greece

       -1.4%                                                                                                                                                                            Azerbaijan
                             -1.2%

                                                                                                                -3.9%
                                                                                                                                                           Cyprus

    Source: Planet Retail.
                                                                                                                                                           -1.0%
4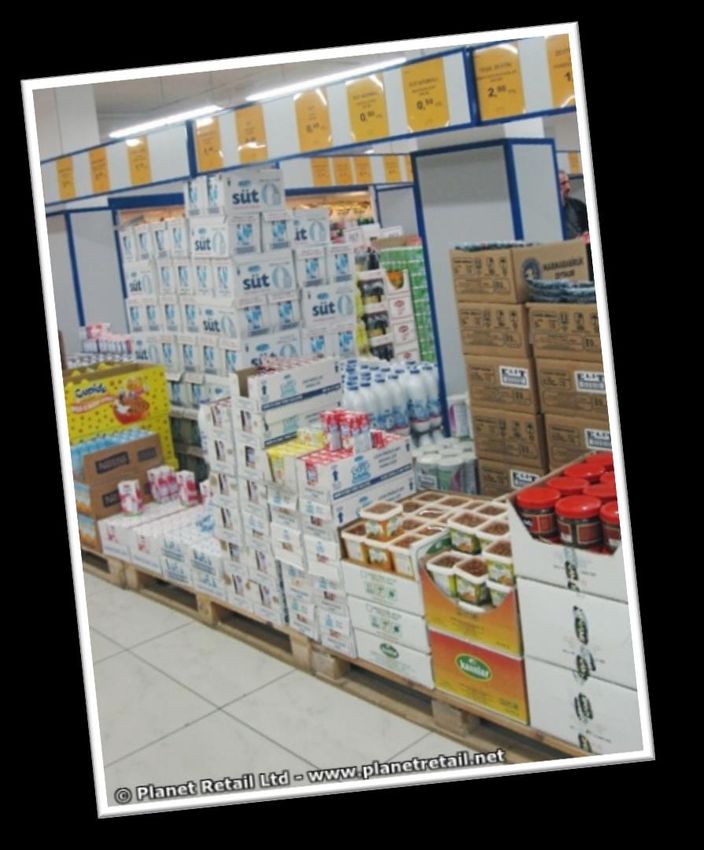
Spending power varies dramatically…
                                                                               MGD Grocery Spend per Capita 2013 (€ ‘000)
      6.0

              5.3
                    5.0
      5.0

                          4.2

      4.0                       3.8
                                      3.7
                                            3.6 3.5
                                                    3.4
                                                          3.3 3.2

      3.0                                                           2.8
                                                                          2.6 2.5 2.5
                                                                                        2.4
                                                                                              2.1 2.1
      2.0                                                                                               1.9 1.8 1.8
                                                                                                                      1.6 1.6
                                                                                                                                1.5 1.5 1.5
                                                                                                                                              1.4 1.4
                                                                                                                                                      1.3
                                                                                                                                                            1.1 1.1
                                                                                                                                                                      1.0
      1.0                                                                                                                                                                   0.9 0.8 0.8
                                                                                                                                                                                          0.6
                                                                                                                                                                                                0.5
                                                                                                                                                                                                      0.3 0.3 0.2 0.2
                                                                                                                                                                                                                      0.2

      0.0

                       Bulgaria

                       Ukraine
                             UK

                          Spain

                         Russia
                  Switzerland

                 Luxembourg

                     Germany

               Czech Republic
                      Slovenia

                       Georgia
                      Hungary

                      Moldova
                          Latvia

                        Poland

                        Greece

                         Serbia
              Bosnia and Herz.
                       Belgium

                           Italy
                        Ireland

                        Finland

                      Slovakia

                 Montenegro
                       Norway

                     Denmark

                         France

                  Netherlands

                        Estonia

                      Armenia
                        Croatia
                     Lithuania
                         Cyprus
                       Sweden

                        Iceland

                   Macedonia

                      Romania

                    Azerbaijan

                        Belarus
                        Austria

                      Portugal

    MGD Grocery Spend defined as sales of total grocery products (edible grocery, household & petcare, health & beauty and foodservice) from modern grocery distribution retailers and wholesale enterprises (MGD) per capita.
    Source: Planet Retail

5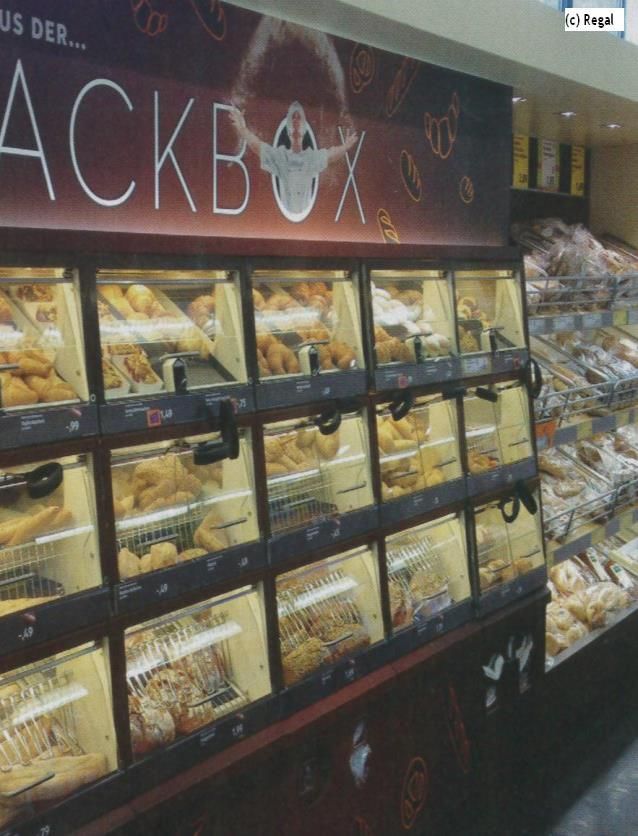
Consumers are very different…

    15 Groups                   67 Types

6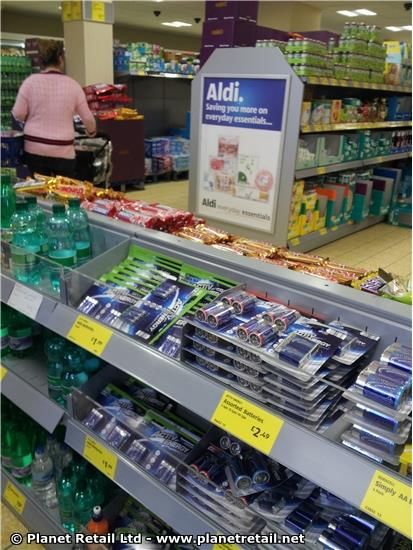
Grocery retail markets have different heritages…
                                                     Grocery Market: Breakdown by Channel 2002 (%)
       Positive retail sales do not necessarily reflect the full picture…
                         100%
                                                       2.8%
                                                       1.5%                                                                            6.8%

                         90%                          6.6%                                                                             1.5%
                                                                                                                                                 Cash & Carries & Wholesale
                                                                                                                                                 clubs
                         80%
                                                                                                                                                 Convenience & Forecourt
                                                                                                                                    32.2%        stores
                         70%
                                                    39.1%
                                                                                                                                                 Discount stores
    % of Grocery Sales

                         60%

                         50%                                                                                                                     Supermarkets &
                                                                                                                                                 Neighbourhood stores
                         40%                         15.1%                                                                         27.8%         Superstores

                         30%
                                                                                                                                                 Hypermarkets
                         20%
                                                    32.1%                                                                           12.6%
                         10%
                                                                                                                                     9.1%
                          0%
                                                      France                                                                        Germany

    ‘Other’ comprises Department & Variety Stores, Non-store Commerce, Other Grocery formats, Other Non-Food Formats, Catering and Wholesale..
    Source: Planet Retail.

7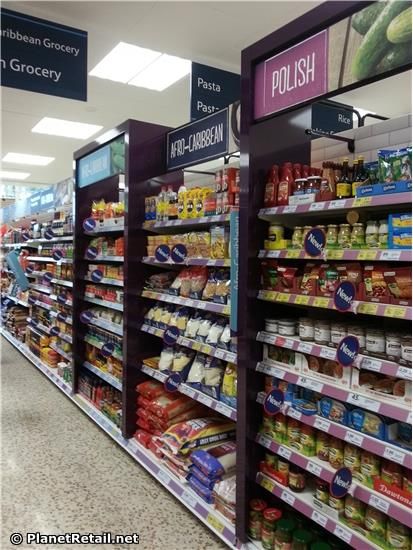
But ‘change’ is a common denominator…

                                            Hectic work/home schedules

                          Two working
                            parents

                                                                 Commuting
                                        Busy lifestyles
                                                                         Smartphone/tablet
                                                                            penetration
         Increasing single
        person households

                                                                                 Tech-savvy generations
                                                           Increasing            becoming key consumers
         Urban dwelling        Changing
                                                            access to
                             Demographics
                                                          technology
                                                                             Shoppers becoming more informed

                 Ageing population                              Home access to the internet

8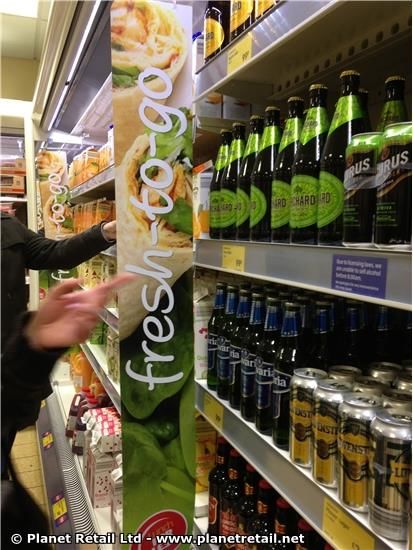
And grocery channels are changing around this…

    Positive retail sales do not necessarily reflect the full picture…

9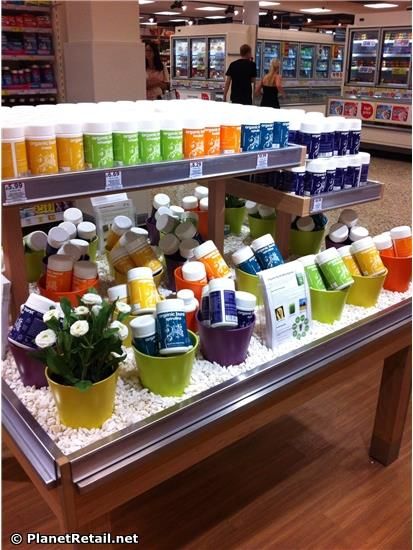
Growth by channel – Western Europe…

                                   Western Europe: Total Banner Sales by Channel, 2008-2018f (EUR bn)
                        450

                        400

                        350

                        300
       Sales (EUR bn)

                        250                                                                          2008
                                                                                                     2013
                        200                                                                          2018f

                        150

                        100

                         50

                          0
                              Hypermarkets & Supermarket &   Discount   Convenience &   Drugstores     Cash & Carries
     Note: f – forecast;
     Source: Planet Retail      Superstores Neighbourhood                 Forecourt

10
Key Markets – Germany
Top 3 Grocery Players by Total Banner Sales
(2013e) 3.2% 2.1%
GDP CAGR Grocery banner
2013-2018F retail sales CAGR
€50.2 bn 2013-2018F
€36.9 bn
€34.1 bn Germany: CAGR Growth by Channel, 2013-
2018f (%)**
Drugstores
Top 3 Grocery Players Supermarkets
by Food Retail Format Market Share
Discount stores
(2013e)
Convenience
25.7% Cash & Carries
18.5% Hypermarkets
0 2 4 6 8
16.0% CAGR (%)
Note: f – forecast
Source: Planet Retail
**Please note, hypermarkets includes superstores, convenience includes forecourts &
supermarket includes neighbourhood stores.
11Key Markets – France
Top 3 Grocery Players by Total Banner Sales
(2013e)
3.0% 2.7%
GDP CAGR Grocery banner
2013-2018F retail sales CAGR
€45 bn 2013-2018F
€42 bn
France: CAGR Growth by Channel, 2013-
€31 bn 2018f (%)**
Convenience
Top 3 Grocery Players Cash & Carries
by Food Retail Format Market Share
(2013e) Drugstores
Discount stores
Hypermarkets
18.7%
Supermarkets
17.3% 0 2 4 6
CAGR (%)
12.5% Note: f – forecast
Source: Planet Retail
**Please note, hypermarkets includes superstores, convenience includes forecourts &
supermarket includes neighbourhood stores.
12Key Markets – UK
Top 3 Grocery Players by Total Banner Sales
(2013e) 4.9% 4.0%
GDP CAGR Grocery banner
2013-2018F retail sales CAGR
€57.9 bn 2013-2018F
€31.7 bn
€30.4 bn
UK: CAGR Growth by Channel, 2013-2018f
Top 3 Grocery Players (%)**
by Food Retail Format Market Share Discount stores
(2013e)
Convenience
26.1% Cash & Carries
Supermarket
14.9%
Drugstores
14.0% Hypermarkets
0 2 4 6 8 10 12
CAGR (%)
Note: f – forecast
Source: Planet Retail
**Please note, hypermarkets includes superstores, convenience includes forecourts &
supermarket includes neighbourhood stores.
13Key Markets – Italy
Top 3 Grocery Players by
Total Banner Sales (2013e)
2.4% 2.1%
GDP CAGR Grocery banner
2013-2018F retail sales CAGR
€13 bn 2013-2018F
€10 bn
Italy: CAGR Growth by Channel, 2013-2018f
€9 bn (%)**
Discount stores
Top 3 Grocery Players by Food Drugstores
Retail Format Market Share
(2013e) Hypermarkets
Supermarkets
Convenience
8.0% Cash & Carries
6.4% -1 0 1 2 3 4 5
CAGR (%)
5.6% Note: f – forecast
Source: Planet Retail
**Please note, hypermarkets includes superstores, convenience includes forecourts &
supermarket includes neighbourhood stores. * Based on food retail format market share.
14Key Markets – Spain
Top 3 Grocery Players by Total Banner Sales
(2013e)
1.9% 3.8%
GDP CAGR Grocery banner
2013-2018F retail sales CAGR
€20 bn 2013-2018F
€16 bn
€9 bn Spain: CAGR Growth by Channel, 2013-2018f
(%)**
Drugstores
Top 3 Grocery Players
Convenience
by Food Retail Format Market Share
(2013e) Supermarkets
Cash & Carries
Discount stores
23.3%
Hypermarkets
14.3% 0 2 4 6 8 10 12
CAGR (%)
10.2% Note: f – forecast
Source: Planet Retail
**Please note, hypermarkets includes superstores, convenience includes forecourts &
supermarket includes neighbourhood stores. * Based on food retail format market share.
15Key Markets – Portugal
Top 3 Grocery Players by Total Banner Sales
(2013e)
3.0% 4.6%
GDP CAGR Grocery banner
2013-2018F retail sales CAGR
€5 bn 2013-2018F
€5 bn
€2 bn Portugal: CAGR Growth by Channel, 2013-
2018f (%)**
Drugstores
Top 3 Grocery Players by Food Retail
Discount stores
Format Market Share
(2013e) Supermarkets
Hypermarkets
20.3% Cash & Carries
Convenience
19.4% -2 0 2 4 6 8 10
CAGR (%)
8.1% Note: f – forecast
Source: Planet Retail
**Please note, hypermarkets includes superstores, convenience includes forecourts &
supermarket includes neighbourhood stores. * Based on food retail format market share.
162. Leading Retailers
Competitive Environment
                                         Western Europe: Top 10 Grocery Players by Total Banner Sales,
                                                               2013e (EUR bn)
                                    70   65.0   64.6
                                                       61.0
     Retail Banner Sales (EUR bn)

                                    60
                                                              51.6   50.2    49.2
                                    50                                              46.6
                                                                                           44.5
                                                                                                   39.0
                                    40
                                                                                                          32.8
                                    30

                                    20

                                    10

                                     0

      e – estimate
      Source: Planet Retail.

18
Competitive Environment
Western Europe: Top 10 Grocery Players by Total Banner Sales,
2018f (EUR bn)
90
Retail Banner Sales (EUR bn)
80
70
60
50
40
30
20
10
0
Note: f – forecast
Source: Planet Retail
19Key Players – Carrefour
#1 Carrefour
Carrefour is focussing on revitalising
operations in core markets – with further
disposals of peripheral operations a possibility.
Turn around ailing hypermarket format
Improve its price image
Multi-channel is a key priority for Carrefour with the
Expand smaller formats under the Carrefour Express,
expansion of the ‘Drive’ concept.
City and Contact banners
Grow multi-channel via drive format
Carrefour is expanding it’s smaller format s such as
Carrefour City above.
20Key Players – Schwarz Group
#2 Schwarz Group
Schwarz Group is one of the most aggressively
growing companies, with a presence in 25+
European markets.
Aims to become the largest food retailer in Europe
Schwarz Group’s Lidl banner is seeing continued
expansion albeit at a slower pace.
Working to propel Lidl past Aldi as largest
discounter in Europe
Introducing minimum turnover per outlet
requirements
Investing heavily on the instore experience
Lidl has been rolling out instore bakeries across
W Europe as it looks to attract a broader
spectrum of shoppers.
21Key Players – Tesco
#3 Tesco
Tesco has unveiled the next phase in its UK
improvement plan with seven areas targeted -
EDLP, product innovation, service, GM, destination
stores, convenience, Clubcard and multi-channel.
Strategic shifting to EDLP with incremental EUR 245
million investment
Focusing on the refurbishment of big-box stores in Tesco has successfully launched the Clubcard
Fuel Saver programme.
2014
Expanding convenience formats – will open 150
Express per annum
Will double the number of click & collect locations
Tesco is rapidly rolling out c-stores – Express and
One Stop.
22Key Players – Metro
#4 Metro Group
For some time now, Metro Group has been battling
on all divisional fronts due to its portfolio of
structurally troubled formats.
Exiting non-core markets to focus on core and key
emerging markets
Refining cash & carry concept in saturated markets The Casa dell’HoReCa features easier customer
of WE to boost attractiveness to business customers navigation with colour-coded departments.
Adapting to changing customer needs with diverse
formats
Closing unprofitable hypermarkets
Undertaking a series of long-overdue store
refurbishments
The Real remodels feature a higher-quality service
counter for fresh items, including bakery.
23Key Players – Edeka
#5 Edeka
Edeka is reviving its co-operative roots as it
refocuses on the strengths of its regional set-up and
its thriving independent retailers.
Diminish the diversity of banners and regional and
local idiosyncracies
The Für Dich (For You) ranged supplied by candy
manufacturer Katjes is available exclusively at Edeka.
Support its independent shopkeepers with the
development of new supermarket concepts
Reassess and reposition its Netto discount chain
Strengthen national buying by bundling sourcing at
the Hamburg headquarters
Edeka’s Omega 3 sausages were developed in collaboration
with the Frauenhofer Institute.
243. Key Trends
Death of the hypermarket?
                      Increasingly restrictive      Apparent ‘saturation’
     Positive retail sales  do   not    necessarily
                        planning legislation        reflect
                                                      in somethe   full picture…
                                                              markets

         Difficulty in finding /
         securing appropriate                                            Lack of investment
                  sites

           Rising land and                                                 Less ‘one-stop’
          development costs                                              shopping / ‘format
                                                                              fatigue’

                             Online migration (esp   Shifting consumer
                                  in General           trend towards
                                 Merchandise)           convenience

26
Countries most exposed to ‘Big Box’
Hypermarket (>5,000 sq m) Penetration of Grocery Market by Country (%)
35.0%
31%
30%
30.0% 29%
25.0% 24%
22% 21%
20%
20.0% 19% 19%
18% 18%
17%
15%
15.0% 14% 14%
10% 9%
10.0%
8% 8% 8%
7%
7% 6% 6%
5.0% 4%
4%
3%
1% 1%
0.0%
MGD Grocery Spend defined as sales of total grocery products (edible grocery, household & petcare, health & beauty and foodservice) from modern grocery distribution retailers and wholesale enterprises (MGD) per capita.
Source: Planet Retail
27Some perspective…
Hypermarkets are not dead, many will continue to prosper
Huge variations by location, generalizations are dangerous:
– Country / market
– Site / catchment
But we are likely to see an inevitable slowdown in development of new
hypermarket space in some countries
Hypermarket sales will continue to grow, although at a slower rate than some
other channels (discount stores, c-stores, E-commerce)
A large number of hypermarkets are very challenged and many have been
subject to under-investment
A number are ‘over-spaced’ and are in need of a radical rethink…
28Selected options for ‘over-spaced hypermarkets’…
No single ‘catch all’ cure, but a number of options – employed in
isolation or in unison, according to the needs of the individual
store and the catchment it serves….
Option 1 Downsize or sub-let surplus space to 3rd parties
Option 2 Re-allocate GM space to extend food offer
Option 3 Re-think product mix of GM space
Option 4 Improve in-store catering / foodservice
29Option 1 – downsize or sublet…
Nando’s
Wembley Park.
Sports Direct
Three UK sites.
Xercise4Less
Stockton-on-Tees.
30Option 2 – re-allocate GM to extend food offer… 31
Option 3 – rethink product mix of GM space…

32
Option 4 – improve in-store catering…

33
Flight to convenience…
                                  Western Europe: Total Banner Sales by Channel, 2008-2018f (EUR bn)

                        450

                        400                                                                     2008
                                                                                                2013

                        350                                                                     2018f

                        300
       Sales (EUR bn)

                        250

                        200

                        150

                        100

                         50

                          0
     Note: f – forecast;
                              Hypermarkets &   Supermarket &   Discount   Convenience &   Drugstores    Cash & Carries
     Source: Planet Retail      Superstores    Neighbourhood                Forecourt

34
C-stores – a pan-European perspective…
No. of C-stores and Forecourt Stores 2013 – Top 20 European Markets
30,000
25,442
25,000
20,000
15,000
11,940
10,000
8,286
6,585
5,000 4,023
3,034
2,370
1,931 1,907 1,808
1,340 1,308 1,187 1,178 1,161 1,071 980 921 781 696
0
Source: Planet Retail
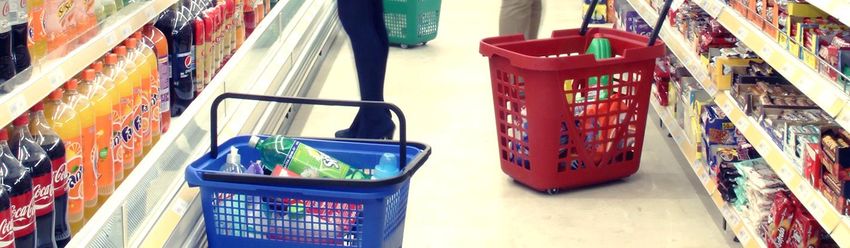
35C-stores – the recipe for success…
A new business model, different from supermarkets and big box
More strategic location planning
A higher cost model
Requiring a higher margin product mix
Focus on fresh foods and food-to-go
Greater emphasis on private labels
Catering for a wide range of shopping visits and occasions:
- ‘Top up’ shopping
- Breakfast and Lunch
- Evening meal solutions.
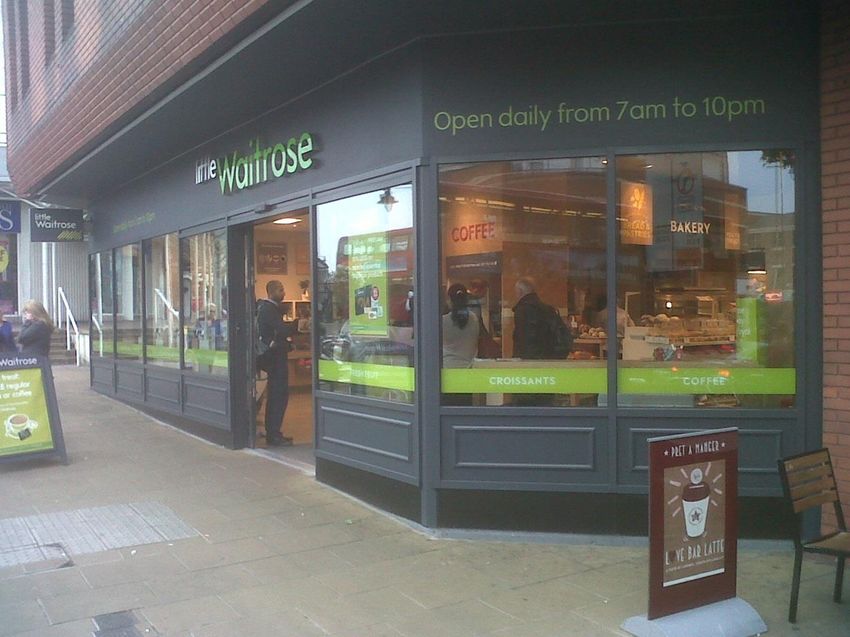
36C-stores go hand-in-hand with e-commerce… 37
Discounters – the march continues (?)…
                                  Western Europe: Total Banner Sales by Channel, 2008-2018f (EUR bn)

                        450

                        400                                                                     2008
                                                                                                2013

                        350                                                                     2018f

                        300
       Sales (EUR bn)

                        250

                        200

                        150

                        100

                         50

                          0
     Note: f – forecast;
                              Hypermarkets &   Supermarket &   Discount   Convenience &   Drugstores    Cash & Carries
     Source: Planet Retail      Superstores    Neighbourhood                Forecourt

38
What exactly is a discounter?
Limited assortment, low prices and no services
“I am convinced that the two
principles, that of small ranges
and low prices, cannot be
separated.”
Karl Albrecht
Aldi Founder & Owner
(1953)
39Discounters – the European Top 10…
Europe: Top 10 Discount Store Operators by Total Sales, 2007-2017f (EUR bn)
68.6
70
2007
65
2012
60
2017
53.8 53.4
55
Banner Sales (EUR bn)
50 46.2
45
40 37.5 38.1
35
30
25
20
15.4
13.7 13.6 13.3
15 11.9
9.4
10 8.2 8.3 9.3 7.3 8.3
6.6 7.1
5.3 5.6 5.7
4.2 5.2
5 2.6 3.6 2.6 2.8 3.3 3.7
0
Schwarz Group Aldi Edeka Rewe Group Dia* Jerónimo Reitan Dansk NorgesGruppen Norma
Martins Supermarked
Note: f – forecast; * part of Carrefour until 2011; ranked by 2012 sales.
Source: Planet Retail
40A one-dimensional model is diversifying…
In the face of saturation and decelerating growth, discounters are
having to change tact and adapt their business models….
Tactic 1 Shift in product mix towards freshness
Tactic 2 Increased brand listings
Tactic 3 Move towards convenience formats
41Shift towards freshness
Penny (Germany, Czech Dia Fresh Instore bakery trial, Aldi
Republic, Italy) (Spain) Süd’s Hofer (Austria)
42Shift towards brand listings - Aldi
Aldi: Brand listings of Top 10 FMCG brand companies
Rationale behind the brand additions:
Sales FMCG brand Brand listings
Revitalising sales in saturated markets rank company at Aldi*
Examples
Attracting more/new shoppers 1 Nestlé Nescafé in Switzerland
Increasing average spend 2 P&G Gillette in Austria
Countering the success of its main rival, 3 PepsiCo Pepsi in Slovenia
Schwarz Group’s Lidl 4 Unilever Lusso in Switzerland
Part of a strategy to become a one-stop 5 Mondelez Toblerone in Germany
destination 6 Coca-Cola Co. Römerquelle in Austria
7 ABInBev Stella Artois in the UK
8 Philip Morris Intl. Marlboro in Germany
9 L’Oréal Garnier Fructis in Hungary
10 Japan Tobacco Winston in Switzerland
Red: Recently added permanent listings (ca. 2010-2013)
Broad brand portfolio, in most markets
Limited brand portfolio, in selective markets
Minor brand portfolio, in a small number of markets
Ranking: OC&C Analysis for 2011, excluding regional meat companies.
Source: Planet Retail.
43Move towards convenience formats – Aldi and Lidl 44
Grocery E-commerce – fad or the future?…

          Proportion of web shoppers who have made grocery purchases online.

                                                           27%                      8%
                                            11%                   10%

                                                            10%                      33%
                                                                  7%

                                                                              31%
                                                                        13%

                                                           7%

     Source: Planet Retail’s Online Shopper Survey data.

45
The great unknown…
“We don’t know where the online
train is going and how fast it is
running. I only know that we need
to be on board.”
ALAIN
CAPARROS
CEO Rewe Group
Indicative of how many European grocery retailers currently feel.
46Still more questions than answers…
Can it ever be
profitable?
Home delivery
What’s the Which is the or Click &
Am I just
impact on best model – Collect?
cannabilising
bricks and store-picking or
existing sales?
mortar stores? dedicated DC?
How do
channels
interract?
What are the
geographic
implications?
Am I just doing
it because
everyone else is
Who are the doing it?
main key
customer
groups?
47Grocery E-commerce - ‘how not to do it’….
Grocery E-commerce may be high growth but it is not straightforward – it
needs to be high profile and executed skilfully.
48Grocery E-commerce – drive format…
The Drive concept is a blend between pure e-commerce and
Click & collect, external to a store or as a free-standing unit.
traditional bricks and mortar stores
49Drives – different business models….
Metro Group’s Real
integrated
infrastructure
alongside stores is the
Capital Expenditure
Ahold in the US is most common form of
experimenting with Drive to date.
Tesco operates “van
compact standalone
sheds” on store car
Drives by their stores.
parks for shoppers to
collect their groceries
quickly by car.
Catalan retailer
Bonpreu has invested
heavily in a
standalone Drive
format, designed to
secure a catchment
area in its own right.
Order Capacity
504. Key takeaways
Channel convergence…
                                HYPERMARKETS
      Big Box servicing                        Hypermarkets opening
      online home delivery,                    dedicated discount
      Click & Collect, Drive                   areas and formats.
      formats.

     E-COMMERCE                                         DISCOUNTERS

      C-stores deployed as E-                   Discounters opening
      commerce fulfillment                      more convenience-
      outlets.                                  based formats.
                                  C-STORES
52
Change is the only constant…
• European retail markets are undergoing substantial change
• Suppliers need to evolve to move with retail change
• Polarity of maintaining volumes and driving margin
• Different strategies for different channels (and markets, retailers)
• Retailers will be looking to suppliers to help them through change
• Key watchwords – FLEXIBILTY AND COLLABORATION.
53Thank You
planetretail.net

     United Kingdom               Germany                      USA                          India                          China                                           Hong Kong                                        Japan
     AirW1                        Dreieichstrasse 59           130 Fifth Avenue             ICC Chambers                   10-1-202                                        Suite 3201-03, 32/F, Tower 1                     c/o INSIGHT INC.
     20 Air Street                D-60594 Frankfurt am Main    7th Floor                    4th floor                      88 Tongxing Road                                The Gateway, Harbour City                        Atami Plaza 1401
     London                       Germany                      New York                     Saki Vihar Road                Qingdao 266034                                  25 Canton Road                                   Kasuga-cho 16-45, Atami-shi
     W1B 5AN                                                   NY 10011                     Andheri (E)-Mumbai - 400072    China                                           Tsimshatsui, Kowloon                             Shizuoka 413-0005
     UK                                                        USA                          India                                                                          Hong Kong                                        Japan

     T: +44 (0)20 7715 6000       T: +49 (0) 69 96 21 75-6     T: +1 (212) 201 6700         T: +852 2996 3157              T: +852 2996 3157                               T: +852 2996 3157                                T: +852 2996 3157
     E: infoUK@planetretail.net   E: infoDE@planetretail.net   E: infoUS@planetretail.net   E: infoIN@planetretail.net     E: infoCN@planetretail.net                      E: infoHK@planetretail.net                       E: infoJP@planetretail.net

                                                                                                                          Researched and published by Planet Retail Limited
                                                                                                                          Company No: 3994702 (England & Wales) - Registered Office: c/o Top Right Group Limited, The Prow, 1 Wilder Walk, London W1B 5AP
                                                                                                                          Terms of use and copyright conditions
                                                                                                                          This document is copyrighted. All rights reserved and no part of this publication may be reproduced, stored in a retrieval system or transmitted
                                                                                                                          in any form without the prior permission of the publishers. We have taken every precaution to ensure that details provided in this document are
55                                                                                                                        accurate. The publishers are not liable for any omissions, errors or incorrect insertions, nor for any interpretations made from the document.
You can also read