Banks' usage of TLTRO III funds - Main factors for using the June 2020 TLTRO III.4 operation and trends in the Italian lending market - European ...
←
→
Page content transcription
If your browser does not render page correctly, please read the page content below
Banks’ usage of TLTRO III funds
           Main factors for using the June 2020 TLTRO III.4 operation
           and trends in the Italian lending market

                                      ECB Money Market Contact Group
                                                 22nd September 2020
See Appendix for important notices.
1 Banks’ usage of TLTRO III funds 1 TLTRO’s take up fostered by sweetened conditions 2 Borrowed funds are flowing into new lending to corporates 3 Benefits in terms of pricing 4 Benefits in terms of bank’s regulatory ratios 5 Our expectations going forward 6 Trends in the italian lending market
2

TLTRO III structure has been sweetened over time

    Jun 2019                Sep 2019             12 Mar 2020              30 Apr 2020

• Gross Borrowing        • Maturity 3 year     • Gross Borrowing
                                                                        • Benchmark
  Allowance at 30%       • Rate = MRO flat       Allowance set at
                                                                          calculated on the
  of eligible lending      // Depo rate flat     50% of eligible
                                                                          period 1 March
  as of 28 February                              lending as of 28
                         • Possibility to                                 2019-31 March
  2019                                           February 2019
                           repay after two                                2021
• Maturity 2 year          years from Sep      • Rate in the period
                                                                        • Rate in the period
• Benchmark                2021.                 24/6/20-23/06/21=
                                                                          24/6/20-23/06/21=
  calculated on the                              MRO-25bp //
                                                                          MRO-50bp //
  period 1 April 2019-                           Depo rate-25bp.
                                                                          Depo rate-50bp.
  31 March 2021                                  After Jun 21 rate is
                                                                          After Jun 21 rate is
                                                 MRO or Depo
• Favourable rate if                                                      MRO or Depo
                                                 rate flat.
  credit growth +2.5%                                                     rate flat.
  benchmark                                    • No bid limit per
                                                 auction
• Rate = MRO+10bp
  // Depo rate+10bp                            • Possibility to repay
                                                 after one-year
• Max bid per                                    from September
  auction =10%                                   2021.
  allowance
Longer-term refinancing operations at the ECB
3
surged with the Covid outbreak
Longer-term refinancing operations at the ECB (EUR Bn)
Mar-May 2020 Jun 2020
300
254
250
210
200
150 130 126
100 85
56
42
50 29
16 14
3 2 2 2 1 1 00 00 0
0
FR DE IT ES NL BE AT GR FI PT LU SK CY EE LV IE SI LT MT
Source: ECB, Bloomberg, Intesa Sanpaolo4
Eligible lending started climbing in March 2020
• The revised structure of TLTRO III include a “special interest rate period”
between 24 Jun ’20 and 23 Jun ’21 in which the interest rate shall be the
average interest rate on the deposit rate minus 50 bp for counterparties that
maintain their levels of credit provision calculated on the “special reference
period” from 1 March 2020 to 31 March 2021.
• According with ECB data, the eligible loans (loans to non-fin corporations
and households excluding home mortgages) surged by 253 billion euros
between March 2020 and July 2020.
TLTRO 3 eligibile lending (Eur Bn change) TLTRO 3 eligibile lending (% yoy)
Mar-Jul 2020 Mar 19- Jul 20 DE FR IT ES EA
175.000 10%
155.000 8%
135.000 6%
115.000 4%
95.000 2%
75.000 0%
55.000 -2%
35.000 -4%
15.000 -6%
-5.000 -8%
-25.000 -10%
DE FR IT ES NL IE LU BE AT PT 01/17 07/17 01/18 07/18 01/19 07/19 01/20 07/20
Source: ECB, Bloomberg, Intesa SanpaoloTLTRO III.5 rate remains competitive vs other funding
5
sources
TLTRO III.5 cost vs other sources of funding for the banking system of major EA countries (%)
Germany France Italy Spain
Estimated max gross allowance TLTRO 3.5
(EUR Bn) 476 318 142 68
Avg TLTRO 3.5 rate % (*) -0.37 -0.37 -0.37 -0.37
Market funding sources
3Y Bonds 0.24 -0.07 0.43 0.41
5Y Covered Bonds -0.46 -0.45 -0.24 -0.34
12M Repo GC -0.57 -0.58 -0.41 -0.45
Deposit rate non fin corp -0.32 0.04 0.12 -0.21
ECB PELTRO -0.25 -0.25 -0.25 -0.25
Avg rate market funding -0.27 -0.26 -0.07 -0.17
Difference vs TLTRO 3.5 rate in bp 10 11 30 21
Cost difference
EUR bn 0.48 0.36 0.43 0.14
% of 2019 NII 1.5% 0.5% 1.4% 0.2%
For reference:
Avg rate market funding in Jun 2020 (*) -0.07 -0.10 0.29 0.13
Avg TLTRO 3.4 rate % (*) -0.42 -0.42 -0.42 -0.42
Avg rate difference in bp 34 31 71 54
Note: (*) the rate is a simple average of min and max rates. Min and max rate are an average over the 3 year maturity.
Source: ECB, Bloomberg, Intesa Sanpaolo6
Recent ECB measures has been aimed to increase
the disposable collateral
• The package of measures taken last April by the ECB in relation to the collateral framework
aims to ensure that banks have sufficient collateral at their disposal:
o ECB eased the conditions for the use of credit claims as collateral in particular
through the potential expansion of the additional credit claims (ACCs) frameworks.
o ECB adopted a general reduction of collateral valuation haircuts.
• The ACC framework provides the possibility to National Central Banks to enlarge the scope
of eligible credit claims for counterparties in their jurisdictions. This includes the possibility to
accept loans with lower credit quality, loans to other types of debtors, not accepted in the
ECB’s general framework, and foreign-currency loans.
Pledged collateral at the ECB by asset class (Eur Bn)
• Eligible marketable assets
2019 Q4 2020 Q2 amounts to 15.2 trillion euro
800
in 2Q20.
700
672
• At the end of 2Q20, 672
576
600 billion euros of non-
500 454 marketable credit
380 353 380 378
400
claims were posted as
269
300
collateral for Eurosystem
200
77
138
99 operations, an increase
100 52
of 287 billions with
0
Govt Unsecured Covered Corporate ABS Non-marketable respect to 1Q20.
Source: ECB, Bloomberg, Intesa Sanpaolo7
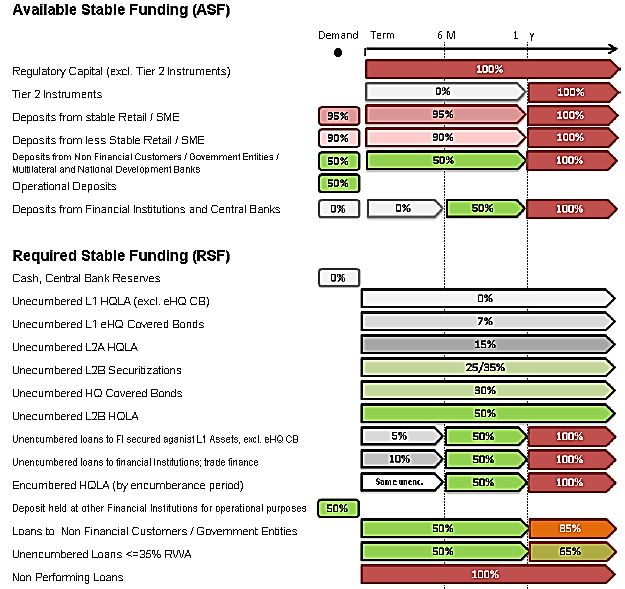
ECB financing has a relevant impact on NSFR
The ASF is calculated multiplying the asset
and liabilities items by ASF coefficients.
Extraordinary ECB financings are
weighted 100% if longer than one year,
50% is between one year and six months,
and zero for durations shorter than six
months.
The RSF is calculated by multiplying each
asset item by RSF coefficients.
The collateral used in extraordinary
operations with the central bank receives
extraordinary treatment: reduced
coefficients may be applied to assets
used as collateral for TLTRO operations
(encumbered), no lower than the
corresponding coefficients for the same
types of assets not used
(unencumbered).
European rules as laid out by the BCBS
have not yet been embraced, therefore
the application of the factors is
discretionary.
Source: ECB, Bloomberg, Intesa Sanpaolo8
TLTRO III: expected take up at the next 3 operations
Our main case scenario implies a gross take up at TLTRO operations close to
2.14 trillion euros.
TOTAL
IT ES FR DE NE BE IE PT OTHERS
Eurozone
Eligible loans 28/02/2019
935 638 1,329 1,511 399 168 78 235 490 5,784
Max take up = 50% of elig. Loans
468 319 665 755 200 84 39 118 245 2,892
ECB Longer-term refin.operations 3
256
Jul 20 349 350 283 112 74 4 31 127 1,586
of which:
- TLTRO II funds outstanding
(ISP estimate) 16 9 6 6 4 2 1 2 - 46
- TLTRO III funds outstanding
(ISP estimate) 319 245 344 277 108 72 3 29 127 1,524
- PELTROs
15 1 - - - - - - - 16
Expected long-term ref.operations
outstanding (31/3/21) 454 317 494 447 153 84 11 49 138 2,147
Change from current amount 105 62 144 164 41 10 7 18 11 5619
Eurosystem assets are expected to increase to 7 trillion
euros by the end of 2021
• Eurosystem’s long-term refinancing operations are expected to growth to 2.1
trillion euros in 1Q21.
• The ECB securities portfolios is expected to reach 5.1 trillion euros (1.8trn PEPP
and 3.3 trn APP).
Main case scenario Main case scenario
Outstanding TLTROs (EUR Bn) Eurosystem assets (EUR Bn)
TLTRO 2 TLTRO 3 TLTRO 2 TLTRO 2 change APP & PEPP portfolio PELTROs
2500
8000
7000
2000
6000
1500 5000
4000
1000
3000
2000
500
1000
0 0
06/19 09/19 12/19 03/20 06/20 09/20 12/20 03/21 06/19 09/19 12/19 03/20 06/20 09/20 12/20 03/21 06/21 09/21 12/21
Source: ECB, Bloomberg, Intesa Sanpaolo10
Excess liquidity will skyrocket above 4 trillion euros
• ECB refinancing operations are in normal times the main liquidity supply instrument for a
central bank. With its QE programme the ECB forces liquidity into the system, as assets are
acquired by the central bank against an increase in banks’ reserves holdings at the CB.
Latest figure for August 18, 2020 shows excess liquidity at just 2.88 trillion euros.
• If Eurozone banks net take up at TLTRO III and ECB bond purchases evolves in
accordance with our expectations, excess reserves will increase to an historical high of
4.5 trillion euros at the end of 2021.
Expected excess liquidity of the Eurosystem (EUR Bn)
5000,0
4500,0
4000,0
3500,0
3000,0
2500,0
2000,0
1500,0
1000,0
500,0
-
09/08 09/11 09/14 09/17 09/20
• Source: ECB, Bloomberg, Intesa Sanpaolo11
Italian Banks eased their credit standards for corporate
loans in 2Q, while demand reached a record high
Italian banks reported an easing in standards applied to business lending in the 2nd
quarter 2020. Demand for loans increased, both from large firms and SMEs, reaching the
highest level ever. Expectations for the third quarter are of a strong demand for loans.
Change in standards applied to business lending Business demand for loans and credit lines
(net %: tightening – easing) by firm size (*) (net %: increase – decrease)
60 100
realised Large firms
Tightening expected SMEs Increase
80
40
60
20
40
0 20
0
-20
-20
-40
Easing -40 Decrease
-60 -60
2Q12 2Q13 2Q14 2Q15 2Q16 2Q17 2Q18 2Q19 2Q20 2Q122Q132Q142Q152Q162Q172Q182Q192Q20
(*) The dotted part refers to expectations for the following quarter
Source: ECB, Euro Area Bank Lending Survey (BLS)Policy measures to support liquidity and credit are driving
12
a rebound in loans to businesses in Italy
Background: until February, loans to households maintained a solid growth of 2.5% yoy
while lending to businesses disappointed, down by -1.2%.
Since the COVID-19 outbreak, upturn in loans to non-financial companies, to 4.4% yoy
in July, from +1.4% in March and -1.9% at end-2019.
Slowdown in loans to households, to +1.1% yoy in April, mainly due to consumer credit,
then back up to 1.7% in June-July following a recover in loans to family businesses.
Loans to the private sector by Italian banks (*)
6 (yoy % change)
4
2
0
-2 Households
Non-financial corporations
-4
Private sector
-6
Jul11 Jul12 Jul13 Jul14 Jul15 Jul16 Jul17 Jul18 Jul19 Jul20
Note: (*) data adjusted to take into account securitisation and net of central counterparties.
Source: Bank of ItalyItalian banks are providing key support to businesses 13
through moratoriums and loans with a public guarantee
Despite some initial difficulties, public guaranteed loans are steadily increasing. As
of end-August, EUR 54Bn of loans backed by the SME Guarantee Fund were
disbursed, of which 18.4Bn of fully guaranteed loans of up to 30K (90% of requested).
Also for loans to larger companies backed by SACE guarantees, amounts granted
have become significant, to EUR 13Bn
Granted loans backed by the SME Guarantee Of which: granted loans of up to EUR 30 thousand
Fund pursuant to art. 13 of the ''Liquidity'' with a 100% public guarantee
Decree Law 23/2020 (1) Disbursed
90
EURBn 88 88 88 88 87
59 85 86 87
% disbursed
Disbursed EURBn 56 57 57 80
83
54 54,2 over requested
% disbursed over requested 52,3 76
50
49,1 50,2
47 68
44 45,8
63
42
40,8
38 18,4
36,9 17,4 17,718,1
34
33,2
50
16,0 16,5 17,1
30 15,2
29,9 14,6
27 14,0
13,3
25 26,0 36 12,1
21,8 10,4
18 18,3 9,1
15 14,9 6,6
12,4
8,1 4,0
5,0
Note: (1) Bank of Italy estimates based on a sample of banks that disburse slightly less than 90% of loans to businesses.
Source: Bank of Italy and Intesa Sanpaolo Research Department calculationsConsiderable increase in deposits of the corporate
14
sector
From the beginning of 2020 until
Net flows towards deposits from non-financial July, EUR 49Bn flowed into bank
corporations in Italy, half-yearly figures (EURBn)
accounts of Italian non-financial
35
overnight
firms, compared to just 5.6Bn in
30 deposits the same period of 2019. The
25 increase was driven by inflows to
with agreed overnight deposits, whose growth
20 maturity
accelerated to +21% yoy in July.
15
Business deposits are fuelled by
redeemable at
10
notice the increase in loans,
5 consequent to access to the
0 repos temporary measures activated to
-5
support liquidity and credit.
-10
This adds to the growth already
total deposits
achieved in previous years. Since
1H17
1H12
2H12
1H13
2H13
1H14
2H14
1H15
2H15
1H16
2H16
2H17
1H18
2H18
1H19
2H19
1H20
2012, deposits from non-financial
Source: ECB and Intesa Sanpaolo Research Department calculations corporations have shown a total
inflow of 186Bn (until July 2020) to
an outstanding amount of 356Bn.Lending rates remain at lows for loans to non-financial 15
corporations
Rates on new loans of up to EUR 1M to The 1H2020 saw new record lows for
Italian non-financial corporations (%)
the average rate on the flow of loans
4 to Italian non-financial corporations,
Overall new loans
down below 1.1% in March-April, to
loans over 1M
recover slightly in the following two
3
loans of up to 1M
months to 1.26% in June and down
again in July to 1.19%, from 1.37% in
Dec-2019.
2 The sharp reduction recorded in
March was mainly driven by the rate
on loans of up to 1M. The decrease
1
continued in May to the all-time low
of 1.60%, followed by 1.68% in July.
Also the rate on loans of over 1M was
0 at its all-time low in March, of 0.73%,
Jul14 Jul15 Jul16 Jul17 Jul18 Jul19 Jul20
to go back up in 2Q, to 1.01% in June,
Source: Bank of Italy and down again in July to 0.90%.16
Important Information
Analyst Certification
The financial analysts who prepared this report, and whose names and roles appear on the first page, certify that:
(1) The views expressed on companies mentioned herein accurately reflect independent, fair and balanced personal views;
(2) No direct or indirect compensation has been or will be received in exchange for any views expressed.
Specific disclosures
The analysts who prepared this report do not receive bonuses, salaries, or any other form of compensation that is based upon specific investment banking
transactions.
Important Disclosures
This research has been prepared by Intesa Sanpaolo S.p.A. and distributed by Intesa Sanpaolo SpA-London Branch (a member of the London Stock Exchange) and
Intesa Sanpaolo IMI Securities Corp (a member of the NYSE and FINRA). Intesa Sanpaolo S.p.A. accepts full responsibility for the contents of this report. Please also note
that Intesa Sanpaolo S.p.A. reserves the right to issue this document to its own clients. Intesa Sanpaolo S.p.A. is authorised by the Banca d'Italia and is regulated by the
FCA in the conduct of designated investment business in the UK and by the SEC for the conduct of US business.
Opinions and estimates in this research are as at the date of this material and are subject to change without notice to the recipient. Information and opinions have
been obtained from sources believed to be reliable, but no representation or warranty is made as to their accuracy or correctness.
Past performance is not a guarantee of future results.
The investments and strategies discussed in this research may not be suitable for all investors. If you are in any doubt you should consult your investment advisor.
This report has been prepared solely for information purposes and is not intended as an offer or solicitation with respect to the purchase or sale of any financial
products. It should not be regarded as a substitute for the exercise of the recipient’s own judgement.
No Intesa Sanpaolo S.p.A. entity accepts any liability whatsoever for any direct, consequential or indirect loss arising from any use of material contained in this report.
This document may only be reproduced or published with the name of Intesa Sanpaolo S.p.A..
This document has been prepared and issued for, and thereof is intended for use by, MiFID II eligible counterparties/professional clients (other than elective
professional clients) or otherwise by market professionals or institutional investors only, who are financially sophisticated and capable of evaluating investment risks
independently, both in general and with regard to particular transactions and investment strategies.
Therefore, such materials may not be suitable for all investors and recipients are urged to seek the advice of their independent financial advisor for any necessary
explanation of the contents thereof.
Person and residents in the UK: This document is not for distribution in the United Kingdom to persons who would be defined as private customers under rules of the FCA.
US persons: This document is intended for distribution in the United States only to Major US Institutional Investors as defined in SEC Rule 15a-6. US Customers wishing to
effect a transaction should do so only by contacting a representative at Intesa Sanpaolo IMI Securities Corp. in the US (see contact details below).
Intesa Sanpaolo S.p.A. issues and circulates research to Major Institutional Investors in the USA only through Intesa Sanpaolo IMI Securities Corp., 1 William Street, New
York, NY 10004, USA, Tel: (1) 212 326 1199.
.Inducements in relation to research
Pursuant to the provisions of Delegated Directive (EU) 2017/593, this document can be qualified as an acceptable minor non-monetary benefit as it is:
- macro-economic analysis or Fixed Income, Currencies and Commodities material made openly available to the general public on the Bank’s website - Q&A on
Investor Protection topics - ESMA 35-43-349, Question 8 & 9.17 Method of distribution This document is for the exclusive use of the recipient with whom it is shared by Intesa Sanpaolo and may not be reproduced, redistributed, directly or indirectly, to third parties or published, in whole or in part, for any reason, without prior consent expressed by Intesa Sanpaolo. The copyright and all other intellectual property rights on the data, information, opinions and assessments referred to in this information document are the exclusive domain of the Intesa Sanpaolo banking group, unless otherwise indicated. Such data, information, opinions and assessments cannot be the subject of further distribution or reproduction in any form and using any technique, even partially, except with express written consent by Intesa Sanpaolo. Persons who receive this document are obliged to comply with the above indications. Valuation Methodology Trading Ideas are based on the market’s expectations, investors’ positioning and technical, quantitative or qualitative aspects. They take into account the key macro and market events and to what extent they have already been discounted in yields and/or market spreads. They are also based on events which are expected to affect the market trend in terms of yields and/or spreads in the short-medium term. The Trading Ideas may refer to both cash and derivative instruments and indicate a precise target or yield range or a yield spread between different market curves or different maturities on the same curve. The relative valuations may be in terms of yield, asset swap spreads or benchmark spreads. Coverage Policy And Frequency Of Research Reports Intesa Sanpaolo S.p.A. trading ideas are made in both a very short time horizon (the current day or subsequent days) or in a horizon ranging from one week to three months, in conjunction with any exceptional event that affects the issuer’s operations. Disclosure of potential conflicts of interest Intesa Sanpaolo S.p.A. and the other companies belonging to the Intesa Sanpaolo Banking Group (jointly also the “Intesa Sanpaolo Banking Group”) have adopted written guidelines “Organisational, management and control model” pursuant to Legislative Decree 8 June, 2001 no. 231 (available at the Intesa Sanpaolo website, webpage https://group.intesasanpaolo.com/en/governance/leg-decree-231-2001) setting forth practices and procedures, in accordance with applicable regulations by the competent Italian authorities and best international practice, including those known as Information Barriers, to restrict the flow of information, namely inside and/or confidential information, to prevent the misuse of such information and to prevent any conflicts of interest arising from the many activities of the Intesa Sanpaolo Banking Group which may adversely affect the interests of the customer in accordance with current regulations. In particular, the description of the measures taken to manage interest and conflicts of interest – related to Articles 5 and 6 of the Commission Delegated Regulation (EU) 2016/958 of 9 March 2016 supplementing Regulation (EU) No. 596/2014 of the European Parliament and of the Council with regard to regulatory technical standards for the technical arrangements for objective presentation of investment recommendations or other information recommending or suggesting an investment strategy and for disclosure of particular interests or indications of conflicts of interest as subsequently amended and supplemented, the FINRA Rule 2241, as well as the FCA Conduct of Business Sourcebook rules COBS 12.4 - between the Intesa Sanpaolo Banking Group and issuers of financial instruments, and their group companies, and referred to in research products produced by analysts at Intesa Sanpaolo S.p.A. is available in the "Rules for Research " and in the extract of the "Corporate model on the management of inside information and conflicts of interest" published on the website of Intesa Sanpaolo S.p.A., webpage https://group.intesasanpaolo.com/en/research/RegulatoryDisclosures. This documentation is available to the recipient of this research upon making a written request to the Compliance Department, Intesa Sanpaolo S.p.A., Via Hoepli, 10 – 20121 Milan – Italy. Furthermore, in accordance with the aforesaid regulations, the disclosures of the Intesa Sanpaolo Banking Group’s interests and conflicts of interest are available through webpage https://group.intesasanpaolo.com/en/research/RegulatoryDisclosures/archive-of-intesa-sanpaolo-group-s-conflicts-of-interest. The conflicts of interest published on the internet site are updated to at least the day before the publishing date of this report. We highlight that disclosures are also available to the recipient of this report upon making a written request to Intesa Sanpaolo S.p.A. – Macroeconomic and Fixed Income Research, Via Romagnosi, 5 - 20121 Milan - Italy. Intesa Sanpaolo Spa acts as market maker in the wholesale markets for the government securities of the main European countries and also acts as Government Bond Specialist, or in comparable roles, for the government securities issued by the Republic of Italy, by the Federal Republic of Germany, by the Hellenic Republic, by the European Stability Mechanism and by the European Financial Stability Facility. Report prepared by: Maria Cristina Lege, Resp. Money Market e Pagamenti, Direzione Centrale Tesoreria e Finanza di Gruppo Group Chief Financial Officer Area
You can also read