INVESTING IN LIFE'S ENDURING EXPERIENCES - INVESTOR PRESENTATION - AUGUST 2017 - DATA IN THIS PRESENTATION IS AS OF 6/30/17 UNLESS OTHERWISE NOTED ...
←
→
Page content transcription
If your browser does not render page correctly, please read the page content below

INVESTING IN LIFE’S
  ENDURING EXPERIENCES

  INVESTOR PRESENTATION – AUGUST 2017

AMC THEATRE – COLUMBIA, MD            BASIS INDEPENDENT SCHOOL – BROOKLYN, NY   TOPGOLF – PHOENIX, AZ

  DATA IN THIS PRESENTATION IS AS OF 6/30/17 UNLESS OTHERWISE NOTED

DISCLAIMER

Statements made in this presentation may constitute "forward-looking statements" within the
meaning of Section 27A of the Securities Act of 1933, as amended, and Section 21E of the Securities
Exchange Act of 1934, as amended. Such forward-looking statements relate to, without limitation,
the Company’s future economic performance, plans and objectives for future operations and
projections of revenue and other financial items. Forward-looking statements can be identified by
the use of words such as "may," "will," "plan," "should," "expect,” "anticipate," "estimate," "continue"
or comparable terminology. Forward-looking statements are inherently subject to risks and
uncertainties, many of which the Company cannot predict with accuracy and some of which the
Company might not even anticipate. Although we believe that the expectations reflected in such
forward-looking statements are based upon reasonable assumptions at the time made, we can give
no assurance that such expectations will be achieved. Future events and actual results, financial and
otherwise, may differ materially from the results discussed in the forward-looking statements.
Readers are cautioned not to place undue reliance on these forward-looking statements and are
advised to consider the factors listed under the headings "Risk Factors" in the Company’s Annual
Report on Form 10-K, as may be supplemented or amended by the Company’s Quarterly Reports on
Form 10-Q and Current Reports on Form 8-K. The Company assumes no obligation to update and
supplement forward-looking statements that become untrue because of subsequent events, new
information or otherwise.

Definitions and reconciliations of the non-GAAP financial measures used in this presentation are
available in our investor supplemental dated June 30, 2017 available on our website at
www.eprkc.com.

2
COMPANY OVERVIEW

EPR PROPERTIES

 EPR IS A TRIPLE NET LEASE REIT, SPECIALIZING IN SELECT, NON-COMMODITY
            REAL ESTATE SEGMENTS THAT ARE HIGHLY ENDURING
 COMPANY SNAPSHOT*
  NYSE: EPR, FOUNDED: 1997                               LONG-TERM OUTPERFORMANCE**
                                                         LIFETIME TOTAL SHAREHOLDER RETURN
  $8.4B      TOTAL MARKET CAP

  $5.6B      EQUITY, $2.8B DEBT

  $6.3B+ TOTAL INVESTMENTS
  378 PROPERTIES, 43 STATES, DC & CANADA
*As of June 30, 2017
**Source: SNL, dates 11/18/1997 through 6/30/17

 PRIMARY INVESTMENTS SEGMENTS

      ENTERTAINMENT                               RECREATION                EDUCATION

 4
INVESTMENT THESIS AND CORE STRATEGIES

INVESTMENT THESIS            CORE STRATEGIES

DIFFERENTIATED INVESTMENTS         LONG TERM

STRONG RELATIONSHIP-BASED
GROWTH PIPELINE
                                   KNOWLEDGE DRIVEN

WELL CAPITALIZED
BALANCE SHEET
                                   FEWER CATEGORIES
                                   GREATER DEPTH
UNDERLYING INVESTMENT
SEGMENT STRENGTH

                                   TRIPLE NET STRUCTURE
CONSISTENT COVERAGE

5
HUMAN CAPITAL

                   OUR ORGANIZATIONAL DESIGN REFLECTS
                          OUR SEGMENT FOCUS
    Builds centers of knowledge in each          Creates competitive advantage to
    of our primary segments                      identify key market trends

                            EXECUTIVE MANAGEMENT
                            CHIEF INVESTMENT
                            OFFICER

          ENTERTAINMENT                   RECREATION              EDUCATION
              GROUP                         GROUP                   GROUP

6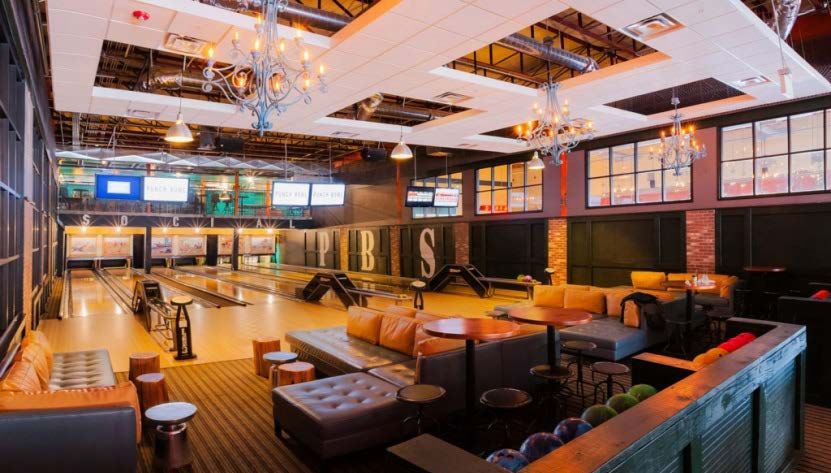
EXPERIENCE EVOLUTION

                               ARTS, ENTERTAINMENT AND RECREATION INDUSTRY
       MILLENNIALS                        CONTRIBUTION TO US GDP
                                                Total Industry Output (IN TRILLIONS)
                                $1.4            As a percent of Total US GDP Output                4.1%

        75.4M                   $1.2
                                                                                                   4.0%

                                                                                                   3.9%
        people aged 18-34                                                                          3.8%

                               $1.0                                                                3.7%

        LARGEST                                                                                    3.6%

        population segment     $0.8                                                                3.5%
                                         2010        2011        2012         2013   2014   2015
                               Source: US Bureau of Economic Analysis (BEA)
        they value
        EXPERIENCE             “We are on the threshold… of the
        over                    EXPERIENCE ECONOMY, a new economic
                                era in which businesses must orchestrate
        OWNERSHIP               memorable events for their customers.”
    Source: US Census Bureau                                  - The Experience Economy

7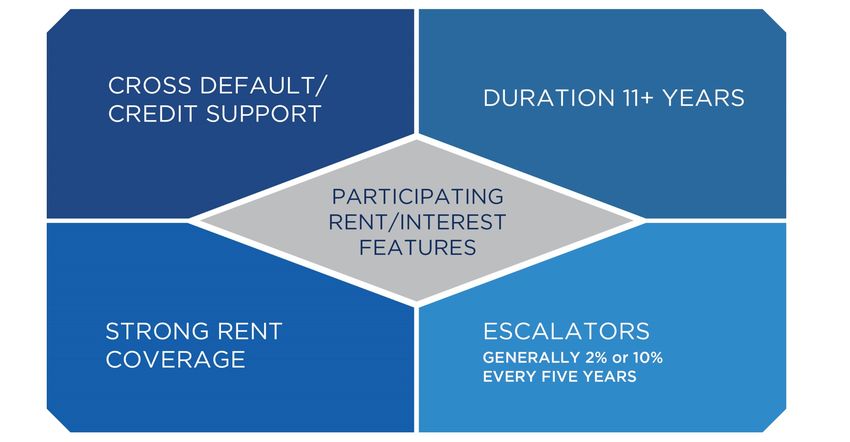
PORTFOLIO
PORTFOLIO VALUE

$6.3B+ PORTFOLIO
Generating $574M+* in NOI

BY INVESTMENT VALUE
378 locations with over 250
tenants in 43 states, DC & Canada
                                                                 32%
                                                                RECREATION

                                                                                22%
                                                                                EDUCATION

                                                                                   3%
                                                                  43%              OTHER

                                                                ENTERTAINMENT

*Represents annualized GAAP NOI – see supplemental for
 definition and reconciliations of certain Non-GAAP Financial
 measures.

9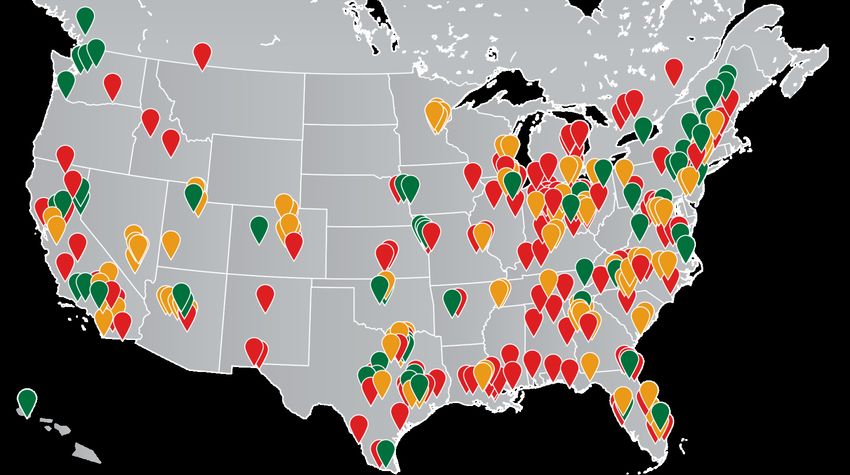
PORTFOLIO DETAIL

   PROPERTY TYPE                                    PROPERTIES                 NOI*      % of TOTALS        % LEASED
                                                                         (IN MILLIONS)

   MEGAPLEX THEATRES**                                         144           208.0               36.2%          100.0%
   ENTERTAINMENT RETAIL CENTERS (ERCS)                           7            40.8                 7.1%          96.3%
   FAMILY ENTERTAINMENT CENTERS (FECS)                           8             9.4                1.6%          100.0%
   TOTAL ENTERTAINMENT                                         159            258.2             44.9%            99.4%

   GOLF ENTERTAINMENT COMPLEXES                                 27             54.0               9.4%          100.0%
   METROPOLITAN SKI AREAS                                       26             57.0               9.9%          100.0%
   ATTRACTIONS (WATERPARKS)                                     20             64.4               11.2%         100.0%
   OTHER RECREATION                                              5              4.0               0.7%          100.0%
   TOTAL RECREATION                                              78           179.4              31.2%          100.0%

   PUBLIC CHARTER SCHOOLS                                       67              73.3             12.8%           97.9%
   PRIVATE SCHOOLS                                              14               27.1             4.7%          100.0%
   EARLY CHILDHOOD EDUCATION                                    59              28.7              5.0%          100.0%
   TOTAL EDUCATION                                             140             129.1             22.5%            98.5%

   ADELAAR                                                         1             7.5               1.3%             N/A
   TOTAL OTHER                                                    1              7.5               1.3%             N/A

   TOTAL                                                       378          $574.2               100%            99.3%

* Represents
         annualized GAAP NOI – see supplemental for quarter ended June 30, 2017 for definitions and reconciliation of certain
Non-GAAP financial measures
**Excludes   7 theatres in ERC’s
  10
CNL LIFESTYLE PROPERTIES TRANSACTION
EPR acquired from CNL Properties (CNL) the Northstar
California Ski Resort and attractions portfolio, and provided
OVERVIEW debt financing to funds affiliated with Och-Ziff Real Estate
(OZRE) for the remainder of CNL’s ski portfolio.
TIMING Closed on April 6, 2017 following shareholder approval
NORTHSTAR AND ATTRACTIONS PORTFOLIO
EPR acquired Northstar and 15 attractions assets (waterparks
and amusement parks) for $455.5M (9.35% cap rate)
OZRE SKI PORTFOLIO
OUTCOMES EPR provided approximately $251.0M of five year financing at
8.5% for 14 ski and mountain lifestyle resorts acquired by OZRE
for $374.5M
FINANCING
Over 90% of EPR’s $706.5M investment was financed with
common shares.
Unless otherwise indicated throughout document:
A) Purchase price does not include pro-rations, transactions costs or closing adjustments
11 B) Amount of the OZRE note does not include any other future advances
C) Attractions portfolio information excludes 5 FECs that account for less than 1% of transaction and were sold at closingCNL LIFESTYLE PROPERTIES TRANSACTION
NORTHSTAR CALIFORNIA
• Leading regional destination mountain resort and
retail village, with a proven operator, Vail Resorts
• 5-year average rent coverage of ~1.6x*
• Year round resort with extensive co-investments
MOUNTAIN RESORT RETAIL VILLAGE
ATTRACTIONS PORTFOLIO
• Geographically diverse portfolio of 15 market-
leading waterparks and amusement parks
• Strong performance with underwritten 5-year
average rent coverage of ~1.8x**
PACIFIC PARK - SANTA MONICA WET N WILD PHOENIX
OZRE SKI PORTFOLIO
• 14 market-leading ski & mountain resorts across 9
states and B.C. Canada
• 1 conservatively structured note at 8.5% interest
rate, 65% LTV, cross-collateralized and ~2.5x
underwritten coverage*** BRIGHTON - UTAH OKEMO - VERMONT
*Historical EBITDAR/Historical Cash Minimum Rent Source: CNL Lifestyle Properties
12 **EBITDAR / Pro Forma Cash Minimum Rents
***Property-Level Rent / Mortgage Interest PaymentFOCUSED GROWTH
TOTAL INVESTMENTS*
(IN MILLIONS)
OTHER $6,353
179
RECREATION
$5,307
EDUCATION 178 2,026
$4,606
ENTERTAINMENT 1,148
203
$4,040
$3,562 207 944
$3,120 $3,211 212 696 1,422
$2,844 $2,969 1,303
$2,717 395
267 550
1,006
335 728
$2,271 342 382 318
421
538
337
280 312 230 374
234 286
174
2,678 2,726
2,262 2,411 2,453
1,976 2,177 2,011 2,148
1,926 1,925
2007 2008 2009 2010 2011 2012 2013 2014 2015 2016 Q2 2017
* Total Investments is a Non-GAAP financial measure. See investor supplemental for quarter
ended June 30, 2017 or Form 10-K’s as applicable for reconciliation of certain Non-GAAP
financial measures
13PROPERTY MAP*
GEOGRAPHICALLY DIVERSE PORTFOLIO
*As of June 30, 2017
14DISTINCTIVE COMBINATION OF LEASE CHARACTERISTICS
CROSS DEFAULT/
DURATION 12 YEARS
CREDIT SUPPORT
UNIQUE COMBINATION
STRONG RENT
ESCALATORS
COVERAGE
GENERALLY 1.5% - 2% OR 7.5%-10%
PARTICIPATING RENT/ INTEREST EVERY FIVE YEARS
15CONTINUING TREND OF REDUCED CONCENTRATION
Top 5=
70% 64%
5%
60%
7%
Percent of Total Revenue
5% Top 5=
50% 7% 5% 6% 45%
9% 8%
6% Premier Parks
9% 8% 8% 4%
40% 9% 8% 7% Peak Resorts
7% 8%
9% 9% Topgolf
10% 9%
30% 6%
8%
7% 4%
Cinemark
6% 8%
20% Regal
34%
29%
25% Rave
23% 20% 23%
10% 19%
Imagine
0% AMC
FY2011 FY2012 FY2013 FY2014 FY2015 FY2016 Q2 2017
16PORTFOLIO LEASE EXPIRATIONS
LEASE EXPIRATIONS OVER NEXT 10 YEARS
AVERAGE 2.5% TOTAL REVENUE ANNUALLY
50%
ENTERTAINMENT RECREATION EDUCATION
40%
Percent of Total Revenue
30%
20%
10%
0%
This schedule relates to owned megaplex theatres, public charter schools, early education centers, private schools, ski areas and golf
entertainment complexes only, which together represent approximately 76% of total revenue for the quarter ended June 30, 2017. This
schedule excludes properties under construction, land held for development and investments in mortgage notes receivable.
17ENTERTAINMENT
UPDATES
2017 BOX OFFICE REVENUE YTD NEAR LAST
YEAR’S RECORD-BREAKING RESULTS* MEGAPLEX THEATRES
THREE PRIMARY STRATEGIES – REDEVELOPMENT,
BUILD-TO-SUIT AND ACQUISITION
EPR PORTFOLIO
ENTERTAINMENT RETAIL CENTERS
159 $2.7B+
PROPERTIES INVESTED
IN SERVICE
6 **
22 ***
PROPERTIES OPERATORS
UNDER DEVELOPMENT
*Source: Box Office Mojo through July 24, 2017 FAMILY ENTERTAINMENT CENTERS
**Properties not yet in service
***Does not include operators at ERCs
18MEGAPLEX THEATRES
LONG HISTORY OF STEADY GROWTH
151 MEGAPLEX
THEATRES*
3 UNDER
DEVELOPMENT**
*Includes theatres in ERCs
**Properties not yet in service
Source: BoxOfficeMojo
FUTURE LOOKS BRIGHT
MILLENNIALS ACCOUNT FOR
50%
MILLENNIALS JUST BECAME THE
LARGEST POPULATION SEGMENT
AND WILL CONTINUE TO GROW
OF FREQUENT MOVIEGOERS
Source: MPAA
19MEGAPLEX THEATRES
TRANSFORMING THE CUSTOMER EXPERIENCE
+40% AVERAGE INCREASES IN TOTAL REVENUE*
NEW LUXURY SEATING NEW FOOD AND BEVERAGE CONCEPTS
60% Seat
Reduction
Replaced with Lo unges and
In-T hea tr e Dining A lco ho l and
Luxury Seating E xp anded Menus Res taura n ts
Enhanced Customer Experience NEW SOUND AND VISUAL ENHANCEMENTS
Increased Attendance
INCREASED REVENUE
20 *
Renovated Theatres in EPR portfolio open a full yearENTERTAINMENT RETAIL CENTERS ( E R C s)
ONE STOP SHOPPING, DINING AND FUN 7 ENTERTAINMENT
RETAIL CENTERS
Theatre or live performance venue provides anchor
21FAMILY ENTERTAINMENT CENTERS ( F EC s)
ONE LOCATION
A VARIETY OF ENTERTAINMENT OPTIONS
8 FAMILY ENTERTAINMENT
CENTERS
Upscale venues work well for corporate and consumer events 3 UNDER
DEVELOPMENT*
*Properties not yet in service
22RECREATION HIGHLIGHTS
RECREATION
UPDATES GOLF ENTERTAINMENT COMPLEXES
TOPGOLF MAINTAINED SUPERIOR PERFORMANCE
SKI SEASON REVENUE UP 18%* AND VISITATION
UP 22%* OVER LAST YEAR SKI AREAS
EPR PORTFOLIO
78 $2.0B+ ATTRACTIONS
PROPERTIES INVESTED
IN SERVICE
5 **
19
PROPERTIES OPERATORS
UNDER DEVELOPMENT
OTHER RECREATION
*Source: Tenant financial information, includes only properties owned for both full seasons
**Properties not yet in service
23GOLF ENTERTAINMENT COMPLEXES
GOLF ENTERTAINMENT COMPLEXES
REVOLUTIONIZE RECREATIONAL ACTIVITY
27 GOLF ENTERTAINMENT
COMPLEXES
Topgolf’s 2016 attendance grew over 30%**
4 UNDER
DEVELOPMENT*
*Properties not yet in service
**Source: Topgolf
24SKI AREAS
LEADING REGIONAL SKI AND RESORT
DESTINATIONS 26 SKI AREAS
GEOGRAPHIC SNOWMAKING FOUR SEASON
DIVERSITY CAPABILITIES APPEAL
25ATTRACTIONS
PROVEN AND DURABLE RECREATION ACTIVITY 20 ATTRACTIONS
Demonstrating a consistent track record of attendance and
revenue, the attractions industry is an enduring component of
1 UNDER
DEVELOPMENT*
the American lifestyle. *Properties not yet in service
26OTHER RECREATION
ACTIVE EXPERIENCES CONSISTENT WITH
CONSUMER TRENDS 5 OTHER RECREATION
PROPERTIES
Increased focus on fitness and wellness, along with participation in new
generation activities
27EDUCATION
EDUCATION FACILITIES
UPDATES
CONTINUE TO SEE ATTRACTIVE OPPORTUNITIES
FOR INVESTMENTS ACROSS OUR EDUCATION PUBLIC CHARTER SCHOOLS
FACILITIES PLATFORM
PUBLIC CHARTER SCHOOLS
EPR PORTFOLIO
EDUCATION INVESTMENT SPENDING
140 $1.4B+
PRIVATE SCHOOLS
PROPERTIES INVESTED
IN SERVICE
13 *
61
PROPERTIES OPERATORS
UNDER DEVELOPMENT
EARLY CHILDHOOD EDUCATION
*Properties not yet in service
28PUBLIC CHARTER SCHOOLS *
DRIVEN BY PARENTAL DEMAND FOR CHOICE;
OVER 20 YEARS OLD AND GROWING STRONG
67 PUBLIC CHARTER
SCHOOLS
Started in 1992 3 UNDER
DEVELOPMENT**
Currently adopted in 42 states and D.C.
3.1M students growing at ~12% CAGR
6,900 schools growing at ~7% CAGR
Waiting list of over 1M students
*Source: NAPCS
**Properties not yet in service
29PRIVATE SCHOOLS
LIMITED QUALITY PRIVATE OPTIONS FUEL DEMAND
14 PRIVATE
SCHOOLS
In select markets, quality public and private school
options are limited
Non-sectarian private schools in the >$15K tuition level
have seen double-digit growth since 2008
Proven operators are capitalizing on the opportunity
by meeting the needs in gateway cities
PARENTS SEEK PRIVATE SCHOOLS
THAT OFFER
Academic Rigor
Strong Culture
Relative Affordability
Source: National Center for Education Statistics
30PRIVATE SCHOOLS PROVIDING AN ALTERNATIVE TO MEET THE DEMAND FOR QUALITY PRIVATE EDUCATION 31
EARLY CHILDHOOD EDUCATION

DEMAND FOR EDUCATION BEYOND DAYCARE                           59   EARLY CHILDHOOD
                                                                   EDUCATION CENTERS
      Large number of dual income families
      Increasing per capita disposable income/stabilizing     10   UNDER
                                                                   DEVELOPMENT*
      unemployment rate
      Desire for quality education instead of daycare

According to the U.S. Census
Bureau, there are                    TRADITIONAL DAYCARE = PHYSICAL NEEDS
                                                        VS.
15.1M CHILDREN
                                    EARLY
                                                PHYSICAL   ACADEMIC
under the age of six that require   CHILDHOOD =          +
Childcare                                       NEEDS      DEVELOPMENT
                                    EDUCATION

*Properties not yet in service

32
EARLY CHILDHOOD EDUCATION EARLY CHILDHOOD EDUCATION REDEFINED Teaching kids through simulation of real world environments, utilizing technology as part of the curriculum and providing opportunities to learn through play 33
ADELAAR SUMMARY

• EPR is the land lessor on the casino parcel and two adjoining parcels.
     o Empire Resorts expected to invest ~$800M in Montreign Resort
       Casino.
     o Empire Resorts will now also fund improvements to both the golf
       course and retail village.
     o EPR is expected to invest ~$155M for development of hotel
       waterpark, development commenced in April 2017.
     o EPR is developing ~$97M in infrastructure for the development, of
       which ~$88M is expected to be reimbursed through municipal IDA
       bonds. $76.7M spent YTD, of which $51.9 has been reimbursed.

• EPR estimates that in 2017 the Adelaar development will generate
  ~$9.2M of GAAP revenue from ground leases and ~$7.5M in NOI.

34
ADELAAR UPDATE Steady progress towards planned opening of Montreign Resort Casino on or before March 31, 2018 Casino will be rebranded a Resort Worlds Property, an internationally- recognized hospitality and casino brand Development continues on the hotel waterpark site with projected opening in early 2019 35
FINANCIAL REVIEW
CAPITAL STRUCTURE AND FINANCIAL HIGHLIGHTS*

                                                                                  Total Market Cap = $8.4B
CAPITAL STRUCTURE
         (IN MILLIONS)

                                                                                  Fixed Rate Debt = 97%
                                                        COMMON
      SECURED                                            EQUITY,                  Weighted Average = 5.0%
      DEBT, $62                                          $5,294

                     1%                      63%                                  Unsecured Debt = 98%

                                                                                  Leverage = 2.8X on Net Debt
UNSECURED         32%                                                             to Adjusted EBITDA
DEBT, $2,731

                                  4%                                              In May, issued $450M of 10year
                                                                                  senior unsecured notes with an
                             PREFERRED
                            EQUITY, $346                                          annual interest rate of 4.5%

               * As of June 30, 2017. See investor supplemental for quarter ended June 30, 2017 for
 37              reconciliation of certain Non-GAAP financial measures
WELL LADDERED DEBT MATURITY PROFILE*
$500
$450 $450
$400
$350 $350
$300
$300 $275
$250
$192
$200
$148
$100
$25 $12 $25
$0
Secured Debt Unsecured Term Loan Unsecured Senior Notes
Unsecured Credit Facility Private Placement
*Data in millions as of 6/30/17; excludes amortization
38OPERATING PERFORMANCE HISTORY
CONSISTENTLY STRONG OPERATING METRICS
FFOAA TOTAL REVENUE
$350 $600
$300 $500
$250 $400
$200
$300
$150
$100 $200
$50 $100
$0 $0
2012 2013 2014 2015 2016 2012 2013 2014 2015 2016
FFOAA PER SHARE NET INCOME TO COMMON
SHAREHOLDERS
$250
$6.00
$5.00 $200
$4.00 $150
$3.00 $100
$2.00
$1.00 $50
$0.00 $0
2012 2013 2014 2015 2016 2012 2013 2014 2015 2016
39 (in millions, except per share data)ANNUAL DIVIDENDS
ATTRACTIVE & GROWING ANNUAL DIVIDENDS
Dividend Yield of 5.6%*
*As of 5/1/17
40 ** ProjectedFINANCIAL PERFORMANCE
SIX MONTHS ENDED 6-30,
2016 2017 $ CHANGE % CHANGE
Total Revenue $236.8 $276.9 $40.1 17%
Net Income - Common 97.4 122.5 25.1 26%
FFO – Common* 146.0 158.9 12.9 9%
FFO as adj. - Common* 148.4 171.4 23.0 15%
Net Income/share – Common 1.54 1.78 0.24 16%
FFO/share - Common, as adj.* 2.33 2.48 0.15 6%
(In millions except per share data)
*See investor supplemental dated June 30, 2017 for certain Non-GAAP reconciliations.
41KEY RATIOS
KEY RATIOS*
FOR THE SIX MONTHS ENDED 6-30
2017 2016
Fixed charge coverage 3.0x 3.2x
Debt service coverage 3.3x 3.6x
Interest coverage 3.5x 4.0x
Net debt to Adjusted EBITDA 2.8x 2.6x
FFO as adjusted payout 82% 82%
INVESTMENT GRADE CREDIT RATINGS
S&P MOODY’S FITCH
Senior Notes BBB- Baa2 BBB-
*See investor supplementals for the applicable periods for definitions and calculations
42CONFIRMING 2017 EARNINGS GUIDANCE AND
INCREASING INVESTMENT SPENDING GUIDANCE
FFO AS ADJUSTED PER SHARE
$5.05 - $5.20
INVESTMENT SPENDING
Prior Guidance $1.30B - $1.35B
Revised Guidance $1.45B - $1.50B
DISPOSITIONS
Prior Guidance $150M - $300M
Revised Guidance $175M - $250M
43APPENDIX
MEGAPLEX THEATRES *

         DRIVEN BY STRONG VALUE, THEATRES CONTINUE TO BE THE
         DOMINANT CHOICE IN ADMISSIONS-BASED ENTERTAINMENT

        ADMISSIONS-BASED ATTENDANCE                                                                  RELATIVE VALUE
                           2015 ATTENDANCE
                               (IN MILLIONS)                                      2015 Average Ticket Price for a Family of Four (US$)
                                                                                  Sources: NATO, Sports Leagues, International Theme Park Services
1,400
           1,321                                          NFL, 17.3
1,200                                                     NHL, 21.5                    NFL                                                  $343.32
1,000                                                     NBA, 21.9                    NHL                                        $248.72
 800                                                                                   NBA                                     $215.92
 600                        388                                                 Theme Parks                                   $209.44
 400                                                      MLB, 73.8
                                               134                                     MLB                         $115.76
 200
                                                                                   Theatres            $33.72
   -
         Theatres       Theme Parks        Sports                                               $-          $100       $200          $300     $400

                                                     AVERAGE TICKET PRICE

                                               10 Year Average Ticket Price CAGR is 2.6%

                                                     2006 2007 2008 2009 2010              2011      2012    2013    2014     2015
                   Average Ticket Price              $6.55 $6.88 $7.18 $7.50 $7.89 $7.93 $7.96 $8.13 $8.17 $8.43

                   % Change vs. Previous Year        2%      5%       4%   4%     5%       1%        0%      2%      0%       3%

                   CPI % Change vs. Previous Year    3%      3%       4%   0%     2%       3%        2%      2%      2%       0%

  45         *Source: MPAA Theatrical Market Statistics 2015
PUBLIC CHARTER SCHOOLS
CURRENT
FAMILY PROFILE SCHOOL PROFILE TARGET STATES
Parents who want an Strong organizational leadership
ARIZONA
alternative to traditional and governance
public schools COLORADO
Favorable market analysis of FLORIDA
Highly engaged enrollment and waiting list
CALIFORNIA
High potential for expansion NEW JERSEY
NORTH CAROLINA
SOUTH CAROLINA
EPR POTENTIAL MARKET
TENNESSEE
GEORGIA
COMPRISED OF
MARKET NEW YORK
OPPORTUNITY $5 - $25
$2.5 MILLION
BILLION
TRANSACTIONS
46PRIVATE SCHOOLS
FAMILY PROFILE OPERATOR PROFILE
HIGH POTENTIAL
Mid to high affluence Nonsectarian schools MARKETS
Strong academic Branded school group with NEW YORK
orientation history of success SAN FRANCISCO BAY
AREA
High parental education Academically rigorous at
LOS ANGELES
achievement moderate price point
CHICAGO
Select markets WASHINGTON D.C.
HOUSTON
EPR POTENTIAL MARKET DALLAS
SAN DIEGO
COMPRISED OF SEATTLE
MARKET
ATLANTA
OPPORTUNITY $20 - $50
$2 MILLION
BILLION
TRANSACTIONS
47EARLYEARLY
CHILDHOOD EDUCATION
CHILDHOOD REDEFINED
EDUCATION
FAMILY PROFILE OPERATOR PROFILE MARKET PROFILE
Dual income Academic Focus Suburban areas of major
MSA’s
High income Multi-site operations
Target segment growth
Well-educated parents Superior real estate execution
Underserved trade areas
Children ages 0-5 (lack of competition)
EPR POTENTIAL MARKET
COMPRISED OF
MARKET
OPPORTUNITY $5 - $20
$1 MILLION
BILLION
TRANSACTIONS
48You can also read