Stellenbosch - Western Cape Government
←
→
Page content transcription
If your browser does not render page correctly, please read the page content below
Stellenbosch
        2020
STELLENBOSCH: AT A GLANCE

       Demographics………………………………………………………………………..                4

       Education ………………………………………………………………………..……                6

       Health…………………………………………………………………………………..                  8

       Poverty………………………………………………………………………………….                 10

       Basic Service Delivery………………………………………………………………..        12

       Safety and Security…………………………………………………………………..          14

       Economy and Labour Market Performance…………………………………..... 16

       Public Infrastructure Spend………………………………………………………..... 18

SOURCES                                                        20

2020 Socio-economic Profile: Stellenbosch Municipality              2
Stellenbosch: At a Glance
                                                                        Population Estimates, 2020; Actual households, 2019

                192 879                                                           49 332
                                                2019                                                                 2018

              Matric Pass Rate              85.0%                     Gini Coefficient                             0.65
             Learner Retention Rate         75.5%
              Learner-Teacher Ratio            26.6                  Human Development Index                       0.76

                                                                                                                     2019

                         14                55.1%                       0.0                            13.5%

                                                                               Actual number of reported cases in 2019/20

                         1 242                 237                  2 166                 76                  231

                                                              Percentage of households with access to basic services, 2019

          94.5%             86.7%                   92.4%                       91.2%                   73.4%

                  2019/20                              2019

                                   Unemployment Rate                       Rising Unemployment
                    34             (narrow definition)
                                                                           Informal Sector expansion
                    35             11.3%                                   Low skills base (Labour)

                                                                                                 Contribution to GDP, 2018

 Finance, insurance, real estate               Wholesale & retail trade,                          Manufacturing
     and business services                  catering and accommodation

      21.6%                                        20.7%                                        16.4%
2020 Socio-economic Profile: Stellenbosch Municipality                                                                       3
STELLENBOSCH

                                       49% DEMOGRAPHICS
   51%                                                                               Population per km²
                                                                                             0 – 10
                                                                                           11 – 20
                                                                                           21 – 30
                                                                                           31 – 40
                                                                                           41 - 50
                                                                                              50+

                        Number of males
                        per 100 females
                              2020      2021         2022         2023      2024
         Witzenberg
         Drakenstein
                              107.9
                              96.9
                                        108.8
                                         97.4
                                                     109.1
                                                     97.5
                                                                   109.5
                                                                   97.6
                                                                             109.9
                                                                             97.7
                                                                                                        192 879
                                                                                                        Current Population
        Stellenbosch          95.2       95.6        95.7          95.7      95.8
        Breede Valley         93.5       93.7        93.7          93.6      93.6
         Langeberg            95.4       95.8        95.9          96.0      96.1

                                                                                      209 849
       Cape Winelands
          District
                              97.3       97.8        97.9          98.0      98.1
                                                                                                               2024
                                                                                      Estimated Population

                        Household size                                        Population growth

              2020      3.7
              2021      3.7
              2022      3.7                                     2.4%       2.1%      2.0%           2.0%
              2023      3.7
              2024      3.7

                                                                  2021      2022      2023            2024
       Age cohorts                                                         Population growth 2020 – 2024

                                                                           Cape Winelands District +1.7%

        Children:       Working Age:       Aged          Dependency
                                                                            Stellenbosch +2.3%
       0-14 Years        15-65 Years     65+ Years          Ratio
                                                                            Stellenbosch +2.1%
2020     43 095           139 312          10 472               38.5
2023     44 917           149 263         11 543                37.8        Langeberg +1.7%

2026     46 390           154 594         12 758                38.3        Drakenstein +1.5%
        +1.2%             +1.7%           +3.3%
                                                                            Breede Valley +1.2%
       2020 Socio-economic Profile: Stellenbosch Municipality                                                            4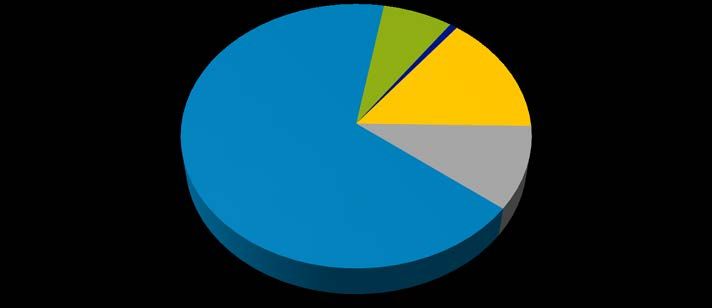
Demographics

   Population
   The population of Stellenbosch is 192 879 people in 2020, ranking amongst the most populated
   municipal areas in the CWD. This total is expected to growth to 209 849 by 2024, equating to an
   average annual growth rate of 2.1 per cent.

   Sex Ratio
   The overall sex ratio (SR) depicts the number of males per 100 females in the population. The data
   indicates that there are less males than females in the Stellenbosch municipal area with a ratio of 49
   per cent (males) to 51 per cent (females). The SR for Stellenbosch increases slightly year on year
   towards 2024 which could be attributed to a wide range of factors such as an increase female
   mortality rates as well as the potential inflow of working males to the municipal area.

   Age Cohorts
   Between 2020 and 2026, the largest population growth projection was recorded in the 65+ aged
   cohort which grew at an annual average rate of 3.3 per cent. The dependency ratio however,
   decreases towards 2023, and increases towards 2026.

   Household sizes
   Household size refers to the number of people per household. The actual size of households remains
   steady at 3.7 from 2020 to 2024. Contributing factors to a stagnation in household size growth could
   include, but are not limited to, lower fertility rates, occurrences of divorce, ageing population, etc.

   Population density
   Amidst rapid urbanisation across the Western Cape, population density figures will aid public sector
   decision makers to mitigate environmental, individual health and service delivery risks. In 2020, the
   population density of the Cape Winelands District (CWD) was 44 persons per square kilometre. In order
   of highest to lowest, the various local municipal areas in the CWD compare as follows:

   • Stellenbosch 232 people/km2

   • Drakenstein      189 people/km2

   • Breede Valley 50 people/km2

   • Langeberg        26 people/km2

   • Witzenberg       14 people/km2

2020 Socio-economic Profile: Stellenbosch Municipality                                                   5

Educational
                     facilities
                                                                 EDUCATION
 39
Number of

                          25
 schools

                                                                                          Learner enrolment
                          Number of                         160 000
                           no-fee                           140 000
                           schools                          120 000
                                                            100 000
                                                             80 000
                                                             60 000
                                                             40 000
                                                             20 000
                                                                 0
                                                                          Cape        Breede
                                                                                                 Drakenstein   Langeberg   Stellenbosch    Witzenberg
                                                                        Winelands     Valley

    29
                                                                2017     143 895      32 860       48 208       18 213        26 544           18 070
                                                                2018     146 495      33 389       49 268       18 374        27 087           18 377
                  Number of schools                             2019     148 136      34 062       49 606       18 474        27 491           18 503
                  with libraries

                                                                                          Learner-Teacher
                                                                                          Ratio
                                                                       Cape Winelands                  26.6 | 27.9 | 28.0
                  Education                                             Breede Valley                  26.8 | 28.4 | 28.7
                  outcomes                                                Drakenstein                  27.2 | 28.3 | 28.2
                                                                          Langeberg                    27.3 | 28.5 | 28.9
                  72.1%    73.9%   74.3%
    Witzenberg                                                           Stellenbosch                  25.0 | 26.0 | 26.6
                                                                         Stellenbosch                  26.2 | 28.3 | 27.9
                  85.5%    85.2%   85.0%
   Stellenbosch

                  79.5%    79.0%   78.8%
    Langeberg
                                                                                           Learner retention
                  85.4%    82.1%   83.0%
    Drakenstein                                                                                69.2%                                      69.4%
                                                                                                                  67.7%
                                                                      Cape Winelands
                  80.2%    77.1%   76.7%                                                       69.9%              64.7%                    69.8%
  Breede Valley                                                       Breede Valley
                                                                                               71.2%              72.6%                   72.4%
                                                                      Drakenstein
                  82.3%    80.6%   80.6%
Cape Winelands                                                                                 59.5%              56.3%                   60.3%
                                                                      Langeberg
              5% 2017       2018      2019                                                                         72.5%                  75.5%
                                                                                               74.4%
                                                                      Stellenbosch
85% 85%                                                                                        63.4%              62.5%                    59.8%
                                                                      Witzenberg
   2020 Socio-economic Profile: Stellenbosch Municipality                                                                                  6
Education

   Learner enrolment, the learner-teacher ratio and learner retention rate
   Learner enrolment in Stellenbosch increased from 27 087 enrollments in 2018 to 27 491 in 2019, an
   increase of 1.5 per cent. The learner-teacher ratio also reflected an increase from 28.5 in 2018 to 28.9 in
   2019. The learner retention rate improved from 72.5 per cent in 2018 to 75.5 per cent in 2019. This could
   be attributed to a number of factors including improvement in the socio-economic context.

   Number of schools and no-fee schools
   In 2019, Stellenbosch had a total of 39 public ordinary schools, of which 25 are no-fee schools. In an effort
   to alleviate some of the funding challenges the Western Cape Department of Education (WCED) offered
   certain fee-paying schools to become no-fee schools. This means that almost two-thirds of the schools in
   Stellenbosch, 52 per cent, are registered with the Western Cape Department of Education as no-fee
   schools.

   Schools with libraries and media centres
   Schools with libraries and media centres has remained at 29 over the reference period, contributing to
   the overall quality of education in the area.

   Education Outcomes (Matric Pass Rates)
   Education remains one of the key avenues through which the state is involved in the economy. In
   preparing individuals for future engagement in the labour market, policy choices and decisions in the
   sphere of education play a critical role in determining the extent to which future economic and poverty
   reduction plans can be realised. Stellenbosch’s matric outcomes has declined slightly from 85.2 per cent
   in 2018 to 85.0 per cent in 2019.

2020 Socio-economic Profile: Stellenbosch Municipality                                                       7

HEALTH
                             Tuberculosis
  1 180
                                                                                         Healthcare facilities
  1 170
                                                                       Regional hospitals                              2                         0
  1 160
                                1 175           1 176
  1 150                                                                   District hospitals                      4                         1
  1 140         1 151                                        PHC facilities (Fixed clinics,
                                                                CHCs and CDCs)                                    45                         8
  1 130
                 2017           2018            2019
                                                                 Community Day Centres                            6                          1

                                                             Community Health Centres          0 0
                        Maternal health                          PHC Clinics (Satelite and
                                                                         Mobile                                   33                        6

                                                                       PHC Clinics (Fixed)                        39                         7
                                Delivery rate
                  Maternal                       Termination of
                                 to women                                                      Cape Winelands                 Stellenbosch
                  Mortality                       pregnancy
                                   under
                   Rate                              rate
                                  20 years

                                                                                               Emergency
                 2018

                         2019

                                 2018

                                         2019

                                                  2018

                                                          2019

                                                                                               medical services
Stellenbosch     66.5    0.0    13.6     13.5     0.5     0.6
                                                                                                                                     Cape
                                                                         Health Indicator            Stellenbosch
Cape                                                                                                                               Winelands
Winelands        95.5   42.7    14.2     15.1     0.7     0.8        EMS Operational
District                                                             Ambulances

                                                                     Population (2017)

                                                                     No of operational
                                                                     ambulances per                           3                        2
                             Child health                            10 000 people

            Low birth rate        15.1            8.2
                                                                                           HIV/AIDS
Neonatal mortality rate
            per 1 000             7.9            5.2                              Registered patients                  Number of new ART
                                                                                    receiving ART                          patients
                                                                  Area
Acute malnutrition rate                                                             2018             2019               2018           2019
 (under 5) per 100 000           3.3            2.6

                                                            Stellenbosch             6 064            6 960                 637             538
   Immunisasation rate
            (under 1)           63.1            55.1
                                                            Cape Winelands
                                                                                    30 724           32 366                3 851           3 434
85% 85%                                                     District
                        Cape winelands     Stellenbosch

   2020 Socio-economic Profile: Stellenbosch Municipality                                                                                   8
Health

   Healthcare Facilities
   According to the 2019 Inequality Trend Report by Statistics South Africa, 75.1 per cent of households in
   South Africa usually use public healthcare facilities when a household member gets ill compared to
   24.9 per cent who used private healthcare facilities in 2017. This is associated with the low proportion of
   households with access to Medical Aid, 16.9 per cent for South Africa and 25 per cent for the Western
   Cape. In terms of healthcare facilities, Stellenbosch had 14 primary healthcare clinics (PHC) in 2019,
   which comprises of 8 fixed and 6 mobile clinics. In addition, there is a district hospital.

   Emergency Medical Services
   Provision of more operational ambulances can provide greater coverage of emergency medical
   services. Stellenbosch has 3 ambulances per 10 000 inhabitants in 2019 which is above the district
   average of 2 ambulances per 10 000 people. It is worth noting that this number only refers to Provincial
   ambulances and excludes all private service providers.

   HIV/AIDS/TB
   Stellenbosch’s total registered patients receiving ARTs increased by 896 patients between 2018 and 2019.
   A total of 32 366 registered patients received antiretroviral treatment in the Cape Winelands District in
   2019. Stellenbosch, at 6 960 patients, represent 21.5 per cent of the patients receiving ART in the Cape
   Winelands District. The number of new antiretroviral patients decreased from 637 to 538 in 2019.

   Stellenbosch experienced an increase of in tuberculosis (TB) cases in 2019. 1 176 TB patients were
   registered in 2019 compared to 1 176 in 2018.

   Child Health
   Immunisation rates in the Stellenbosch area is at 55.1 per cent in 2019 having decreased slightly from
   55.2 per cent in 2018. In 2019, the number of malnourished children under five years (per 100 000) was
   2.6, a slight decline from 2018. Neonatal mortality rate (NMR) (per 1 000 live births decreased from 6.6 in
   2018 to 5.2 in 2019. The low-birth-weight indicator was recorded at 8.2, a decrease from 9.2 recorded in
   2018.

   Maternal Health
   The maternal mortality rate in the Stellenbosch area is zero and Cape Winelands District is 42.7 deaths
   per 100 000 live births in 2019.

   The delivery rate to women under 20 years in Stellenbosch and Cape Winelands District was recorded at
   13.5 and 15.1 in 2019 per cent respectively.

   The termination of pregnancy rate increased from 0.5 to 0.6 from 2018 to 2019 in the Stellenbosch area.

2020 Socio-economic Profile: Stellenbosch Municipality                                                     9

POVERTY
                             GDP per capita
70 000
60 000
50 000
40 000
30 000
20 000
10 000
    0
                               Cape
          Western Cape                    Witzenberg     Drakenstein    Stellenbosch   Breede Valley     Langeberg
                             Winelands
   2012      61 000           50 000        44 000         53 000          63 000         43 000            39 000
   2015      61 000           51 000        46 000         54 000          64 000         44 000            39 000
   2018      59 000           50 000        46 000         52 000          62 000         43 000            39 000

                                                                           Income inequality
 0.68

 0.66
                                                                             0.65
 0.64
                                                                                                   Western Cape
 0.62                                                                        0.62                  Cape Winelands
                                                                             0.61
 0.60                 0.60                                                   0.60
                                                                                                       Witzenberg
 0.58                 0.58                       0.58                       0.59
                                                                            0.59
                                                                                                   Drakenstein
                      0.57                                                   0.58
 0.56                 0.56                       0.56                                              Stellenbosch
                      0.55
                      0.54
                                                 0.55
                                                                                                       Breede Valley
 0.54                                            0.54
                      0.53
 0.52
                                                0.53
                                                0.52                                                   Langeberg
                                                 0.52
 0.50
                      2012                       2015                       2018

                             Human development
  0.80

  0.78
                                                                                                       Western Cape
                                                                            0.78

  0.76
                                                                         0.77

                                                                                                       Cape Winelands
                                                0.77

                                                                         0.77

                                                                        0.76
                                                                        0.76
                                             0.76

                                                                       0.76

                                                                       0.76
                                             0.76

                                            0.75
                                            0.75

  0.74                                                                                                 Witzenberg
                                           0.75
                                         0.74

                                                                                                       Drakenstein
                0.73

  0.72
              0.72
              0.72

             0.72
             0.72

                                                                                                       Stellenbosch
            0.71

  0.70
          0.70

                                                                                                       Breede Valley
           5%
  0.68
                                                                                                       Langeberg
    85%
  0.66
                      2012                        2015                        2018
2020 Socio-economic Profile: Stellenbosch Municipality                                                                10
Poverty GDPR Per Capita An increase in real GDPR per capita, i.e. GDPR per person, is experienced only if the real economic growth rate exceeds the population growth rate. Even though real GDP per capita reflects changes in the overall well-being of the population, not everyone within an economy will earn the same amount of money as estimated by the real GDPR per capita indicator. At R62 000 in 2018, Stellenbosch’s real GDPR per capita is well above that of the Cape Winelands District’s figure of R50 000 as well as that of the Western Cape. Income Inequality The National Development Plan (NDP) has set a target of reducing income inequality in South Africa from a Gini coefficient of 0.7 in 2010 to 0.6 by 2030. Income inequality has increased in Stellenbosch between 2012 (0.60) and 2018 (0.65) with the exception of 2012, when it dropped below 0.58. Furthermore, income inequality levels were the highest in Stellenbosch for 2018 with a Gini coefficient of 0.60 when compared to neighbouring municipalities across Cape Winelands District and the Western Cape. These disparities in income are certain to worsen across the ensuing MTREF given the potential aftereffects of the Covid-19 pandemic. Human Development The United Nations uses the Human Development Index (HDI) to assess the relative level of socio- economic development in countries. Indicators that measure human development are education, housing, access to basic services and health. The HDI is a composite indicator reflecting education levels, health, and income. It is a measure of peoples' ability to live a long and healthy life, to communicate, participate in the community and to have sufficient means to be able to afford a decent living. The HDI is represented by a number between 0 and 1, where 1 indicates a high level of human development and 0 represents no human development. There has been a general increase in the HDI in Stellenbosch from 0.72 in 2012 to 0.76 in 2018. The trend for the Cape Winelands District and the Western Cape in general has been similar between 2012 and 2018. Naturally, per capita income as per definition is expected to mimic the trend of HDI and this is clearly displayed in the graphic above. In short, what this graphic illustrates is that for the most part an increase in GDP per capita across a particular region is generally accompanied by an improvement in HDI levels with a short lag. 2020 Socio-economic Profile: Stellenbosch Municipality 11
BASIC SERVICE DELIVERY
                                   Total number of households
                                        49 332          230 017
                                   Stellenbosch Municipality                 Cape Winelands District

                                                Formal main dwelling                                                     81.2
                      73.4                     36 214         186 743                                                     %
                       %               Stellenbosch Municipality               Cape Winelands District

            56.6% Stellenbosch                      0.6% Stellenbosch                    15.7% Stellenbosch
         67.9% Cape Winelands                   0.6% Cape Winelands                  12.1% Cape Winelands
                                                                                           Flat/simplex/duplex/
              House/brick structure                                                          triplex or room/flat
            on separate stand/yard                    Traditional dwelling
                                                                                            on shared property          1.4% Stellenbosch
                                                                                                                      1.2% Cape Winelands

               1.0% Stellenbosch                     6.0% Stellenbosch                    18.6% Stellenbosch           Other/Unspecified
           1.2% Cape Winelands                   6.3% Cape Winelands                  10.7% Cape Winelands
                 House/flat/room in                   Informal dwelling in                Informal dwelling
                         backyard                               backyard                    not in backyard
                                                                             Flush/Chemical toilet          At least weekly

    Piped water inside                 Electricity as primary                Flush/chemical toilet            Refuse removed at least
   dwelling/within 200m                  source of lighting                                                        once a week
Stellenbosch              94.5%      Stellenbosch             92.4%     Stellenbosch              91.2%     Stellenbosch               86.7%

Cape Winelands            97.1%      Cape Winelands 92.4%               Cape Winelands 91.1%                Cape Winelands             79.5%

Free basic                           Free basic                         Free basic                          Free basic
water                                electricity                        sanitation                          refuse removal
                                                               11 670

                                                                                  6 486

                                                                                                   6 453

                                                                                                                       6 486

                                                                                                                                        6 453
                                              6 486
         6 486

                           6 453

                                                                         5 757

                                                                                                              5 757
                                                                                          5 686

                                                                                                                               5 686
                                      5 757
 5 757

                                                      5 686
                  5 686

 2015    2016     2017     2018       2015    2016    2017     2018      2015     2016    2017     2018       2015     2016    2017    2018

 2020 Socio-economic Profile: Stellenbosch Municipality                                                                                   12
Basic Service Delivery The Constitution stipulates that every citizen has the right to access to adequate housing and that the state must take reasonable legislative and other measures within its available resources to achieve the progressive realisation of this right. Access to housing also includes access to services such as potable water, basic sanitation, safe energy sources and refuse removal services, to ensure that households enjoy a decent standard of living. This section considers to what extent this has been achieved by reflecting on the latest available information from Quantec Research for 2019. The latest official statistics was collected by Statistics South Africa for the 2016 Community Survey; the 2021 Census will provide the updated official statistics. The information on free basic services is obtained from Statistics South Africa’s Non-Financial Census of Municipalities survey findings. Housing and Household Services With a total of 49 332 households in the Stellenbosch municipal area, only 73.4 per cent had access to formal housing, the lowest access level when compared to the other municipalities in the Cape Winelands District area; the District average was 81.2 per cent. The area also had highest proportion of informal households in the District, a total of 24.5 per cent compared with the District average of 17.0 per cent. Subsequently, service access levels were high in the area, with access to piped water inside/within 200m of the dwelling at 94.5 per cent, access to a flush or chemical toilet at 91.2 per cent, access to electricity (for lighting) at 92.4 per cent and the removal of refuse at least weekly by local authority at 86.7 per cent of households. Free Basic Services Municipalities also provide a package of free basic services to households who are financially vulnerable and struggle to pay for services. The number of households receiving free basic services in the Stellenbosch municipal area has shown a generally increasing trend up to 2018. The stressed economic conditions are anticipated to exert pressure on household income levels, which is in turn likely to see the number of indigent households and the demand for free basic services increase. 2020 Socio-economic Profile: Stellenbosch Municipality 13
SAFETY AND SECURITY
                                          MURDER                               2017/18        2018/19   2019/20

                                           Stellenbosch                          39              37        39
                        Per 100 000
                                           Cape Winelands District               42              39        42

            SEXUAL OFFENCES                      2017/18         2018/19        2019/20

                   Stellenbosch                     114            108            120
 Per 100 000
                   Cape Winelands District          110            95             102

                                  DRUG-RELATED OFFENCES                        2017/18        2018/19   2019/20

                                             Stellenbosch                       1 754         1 358      1 123
                          Per 100 000
                                             Cape Winelands District            1 832         1 211       837

         DRIVING UNDER THE INFLUENCE                     2017/18   2018/19        2019/20

                      Stellenbosch                         169           164            123
    Per 100 000
                      Cape Winelands District             112           103             100

        FATAL         Stellenbosch                         27            34             34
       CRASHES        Cape Winelands District             215            237           206

     ROAD USER        Stellenbosch                         29            37             35
     FATALITIES       Cape Winelands District             196        172              165

                                     RESIDENTIAL BURGLARIES                     2017/18       2018/19   2019/20

                                               Stellenbosch                      975            722       644
                              Per 100 000
                                               Cape Winelands
                                                                                 682            625       587
                                               District

2020 Socio-economic Profile: Stellenbosch Municipality                                                            14
Safety and Security Murder Murder is defined as the unlawful and intentional killing of another person. Within the Stellenbosch area, the actual number of murders increased from 69 in 2019 to 76 in 2020. The murder rate (per 100 000 people) also increased from 37 in 2019 to 39 in 2020. The murder rate for the CWD increased from 39 in 2019 to 42 in 2020 (per 100 000 people). Sexual Offences Sexual offences include rape (updated to the new definition of rape to provide for the inclusion of male rape), sex work, pornography, public indecency and human trafficking. In 2020, there were 231 reported sexual offences in the Stellenbosch area compared to 204 in 2019. In 2020, there were 966 reported cases in the Cape Winelands District in total compared to 880 in 2019. Drug-related Offences Drug-related crimes refer to the situation where the perpetrator is found to be in possession of, under the influence of, or selling illegal drugs. Drug-related incidences within the Stellenbosch area decreased from 2 563 cases in 2019 to 2 166 cases in 2020. The CWD’s drug-related offences decreased sharply from 11 225 in 2019 to 7 895 in 2020. When considering the rate per 100 000 people, at 1 172 crimes per 100 000 people in 2020, the Stellenbosch area rate is above that of the District (837). Driving under the influence (DUI) A situation where the driver of a vehicle is found to be over the legal blood alcohol limit. The number of cases of driving under the influence of alcohol or drugs in the Stellenbosch area shows a decrease from 309 in 2019 to 237 in 2020. This translates into a rate of 123 per 100 000 people in 2020, which is above the District’s 100 per 100 000 people in 2020. Road user fatalities The type of road user that died in or during a crash i.e. driver, cyclist, passengers, pedestrians. The number of road user fatalities in the Stellenbosch municipal area decreased from 37 in 2018/19 to 35 in 2019/20. The number of fatal crashes remained constant at 34 across the same reference period. Residential Burglaries The unlawful entry of a residential structure with the intent to commit a crime, usually a theft. The 2019/20 crime statistics released by SAPS and Stats SA indicate that the number of residential burglaries fell by 6.7 per cent in South Africa. Within the Western Cape Province, burglaries at residential areas decreased by 8.5 per cent between 2019 and 2020. Residential burglary cases within the Stellenbosch area also decreased from 1 363 in 2019 to 1 242 in 2020. When considering the rate per 100 000 population, with 644 cases per 100 000 in 2020, Stellenbosch’s rate is above the district rate of 587 per 100 000 in the same reporting year. 2020 Socio-economic Profile: Stellenbosch Municipality 15
Economy and Labour Market Performance

                                                                  GDPR                                           Employment
                                                                                                                    Average
                   SECTOR                                                        Real GDPR                                                 Net
                                           R million               Trend                       Number of             annual
                                                                                  growth                                                 change
                                          value 2018            2014 - 2018                    jobs 2018             change
                                                                                   2019e                                                  2019e
                                                                                                                   2014 - 2018
        Primary Sector                            931.4              -1.0            -8.9             10 725                55             -113
  PS
        Agriculture, forestry & fishing           901.2              -1.1            -9.1              10 694               55              -111

        Mining & quarrying                         30.2               1.8            -2.6                 31                 0                   -2
        Secondary sector                     3 755.6                 -0.3            -1.6             12 224            121                -443
  SS
        Manufacturing                         2 651.6                -0.9            -1.5               7 965               -8              -138
        Electricity, gas & water                  234.3              -0.3            -1.9                156                 3                   -1
        Construction                              869.8               2.1            -1.9               4 103           126                 -304
        Tertiary sector                     11 489.0                 2.1              1.4             55 752          1 304                 449
  TS
        Wholesale & retail trade,
        catering &                            3 344.9                 2.4             0.9              20 460           603                 400
        accommodation
        Transport, storage &
                                              1 782.3                 3.9             1.5               3 432               95              169
        communication
        Finance, insurance, real
                                              3 489.6                 2.4             2.3              13 577           427                  35
        estate & business services
        General government                    1 770.1                 0.1             0.7               7 925               62              124
        Community, social &
                                              1 102.2                 0.9             0.3              10 358           117                 -279
        personal services
        Stellenbosch                        16 176.0                 1.4              0.1             78 701          1 480                -107

                                               Skill Level                                                       Number of jobs
                 Skill Levels                                               Average growth
                                            Contribution 2018
             Formal employment                                                   (%)
                                                   (%)                                                    2018                      2019

        Skilled                                            23.9                        2.5                 13 495                       13 719

        Semi-skilled                                       43.8                        2.8                 24 673                       25 127

        Low-skilled                                        32.3                        0.4                 18 433                       18 513

        TOTAL                                             100.0                        2.0                 56 601                    57 359

              Informal
                                   2009   2010       2011         2012        2013   2014     2015       2016       2017         2018      2019
            Employment
       Number of informal
                                22 703    20 515    20 431        20 545    21 736   22 101   23 474     21 672    22 615        22 100    21 235
       jobs
       % of Total
                                   33.3    31.2      30.6          29.9       30.5    30.6     30.7       28.4      29.0         28.1       27.0
       Employment

          Unemployment
                                   2009   2010       2011         2012        2013   2014     2015       2016       2017         2018      2019
              rates
        Drakenstein                11.2    12.6       12.9         12.6       12.2    12.6     11.6       12.6       13.2         13.1      14.2
        Langeberg                   5.1     6.1           6.3       6.2        5.9     6.2      5.4        6.1        6.4          6.5       7.2
        Stellenbosch                8.2     9.4           9.7       9.6        9.3     9.6      8.9        9.9       10.3         10.3      11.3
        Stellenbosch                5.8     6.8           6.9       6.6        6.1     6.4      5.4        5.9        6.2          6.2       6.7
        Breede Valley               8.6     9.9       10.1          9.8        9.4     9.7      8.6        9.5        9.9          9.9      10.7
        Cape Winelands              8.4     9.7           9.9       9.7        9.2     9.6      8.6        9.5        9.9          9.9      10.7
        Western Cape               14.2    15.5       15.7         15.8       15.7    16.0     16.1       17.3       18.1         18.0      19.4

2020 Socio-economic Profile: Stellenbosch Municipality                                                                                       16
Economy and Labour Market Performance Sectoral Overview In 2018, the economy of Stellenbosch was valued at R16.2 billion (current prices) and employed 78 701 people. Historical trends between 2014 and 2018 indicate that the municipal area realised an average annual growth rate of 1.4 per cent which can mostly be attributed to the tertiary sector that registered a positive annual growth rate of 2.1 per cent. In terms of sectoral contribution, the wholesale and retail trade, catering and accommodation (R3.3 billion), finance, insurance, real estate and business services (R3.5 billion), and manufacturing (R2.7 billion) sectors were the main drivers that contributed to the positive growth in the local economy. These sectors are also estimated to have performed well in 2019, particularly the finance, insurance and real estate services and the wholesale and retail trade, catering and accommodation sectors, which are both estimated to have grown by 2.4 per cent. Employment creation in the wholesale and retail trade, catering and accommodation sector mirrored the high growth rate, with 400 new jobs created. In 2019, the transport, storage and communication sector was also an important source of job creation (169 jobs). Despite its important role in the local economy, particularly as one of the main sources of employment, the agriculture, forestry and fishing sector experienced below-average performance between 2014 and 2018 and is estimated to have contracted by 8.9 per cent in 2019. This contraction led to the loss of 113 jobs. The agriculture, forestry and fishing sector is still recovering from the provincial drought. Formal and Informal Employment It is estimated that Stellenbosch’s total labour force in 2019 amounted to 78 701 workers of which 56 601 (71.9 per cent) are in the formal sector while 22 100 (28.1 per cent) are informally employed. Most of the labour force consisted of semi-skilled (43.8 per cent) and low-skilled (32.3 per cent) workers. The skilled category contributed 23.9 per cent to total formal employment and grew on average by 2.5 per cent, while the semi-skilled and low-skilled categories grew at 2.8 and 0.4 per cent respectively. Evidently, the demand for skilled labour is on the rise which implies the need to capacitate and empower low-skilled and semi-skilled workers. Unemployment Stellenbosch (11.3 per cent) has the second highest unemployment rate in the Cape Winelands District. It is also higher than the District average (11.3 per cent) but considerably lower that the Western Cape rate of 19.4 per cent. Stellenbosch’s high unemployment rate is based on the narrow definition of unemployment i.e. the percentage of people that are able to work, but unable to find employment. The broad definition generally refers to people that are able to work, but not actively seeking employment. 2020 Socio-economic Profile: Stellenbosch Municipality 17
PUBLIC INFRASTRUCTURE SPEND

                                             Provincial infrastructure spend
                                             7.1%             0.8%

                                                             14.7%
                                                                                   Education
                                                                                   Health
                   67.3%                                                           Human Settlements
                                                                                   Public Works
                                                              10.2%
                                                                                   Social Development
                                                                                   Transport

                         Municipal infrastructure spend (R’000)

                             Trading Services                  Other
                                            57%                  5%

                                                            Economic Infrastructure
                     Social Infrastructure                                     29%
                                       9%

                                  Other                  R18 540
                   Waste Management              R7 745
             Waste Water Management                                                               R109 670
                                  Water                                  R53 380
                              Electricity                          R39 275
                                 Health     R0
                               Housing            R10 361
                           Public Safety         R6 700
                  Sports and Recreation             R14 330
                    Social Development       R3 190
               Environmental Protection     R1 800
                         Road transport                                  R54 020
             Planning and Development                                   R52 540
2020 Socio-economic Profile: Stellenbosch Municipality                                                       18
Public Infrastructure Spend (2020/21) Spending on Social Infrastructure Spending on social infrastructure aids in social development and has the spill-over effect of enabling economic growth. The Western Cape Government (WCG) will spend 22.5 per cent (R49.174 million) of its infrastructure budget on social infrastructure. As displayed in the pie chart the WCG will be allocating 7.1 per cent of the budget (R15.430 million) towards education in the municipal area. Spending on education is crucial as it can serve to improve education outcomes and skills levels within a community, and more importantly alleviate poverty through increased long-term income for individuals. A healthy and resilient community increases productivity and reduces pressures on government resources. As such the Department of Health has allocated 0.8 per cent (R1.668 million) of infrastructure spending on health. A further R32.076 million (14.7 per cent) has been allocated by the WCG towards Human Settlements, serving to reduce housing backlogs. This was complemented by R10.361 million in spending on housing infrastructure by the Municipality. Community safety has been prioritised by the WCG due to high levels of crime in the Western Cape. Crime has a negative impact on the quality of lives of individuals, but also on the economy by deterring private investment and causing business losses. It further creates a burden on government resources in terms of justice system costs, victim assistance and replacement of assets. The Municipality has as such allocated R6.7 million of its capital budget on community and public safety. The Municipality has also made R14.330 million available for sports and recreation and R3.190 million for social development which will serve to improve the quality of life of individuals within the municipal area. Spending on Economic Infrastructure Economic infrastructure is defined as infrastructure that promotes economic activity. Considering the sluggish economic growth throughout the country, spending on economic infrastructure is crucial to stimulating economic activity. The WCG allocated R169.256 million (77.5 per cent) towards economic infrastructure, more specifically towards transport (R147 million) and public works (R22.256 million). Transport and public works infrastructure goes a long way towards unlocking the region’s economic potential, especially due to it being a tourist destination and its proximity to the City of Cape Town economic hub. The Municipality contributes a further R54.0 million towards road transport. As part of their economic infrastructure allocation, the Municipality will also contribute R52.5 million towards planning and development and R1.8 million towards environmental protection. Spending on Trading Services Basic services are crucial to improving the living conditions of citizens within the municipal area and enabling economic activity for businesses via access to water, electricity, sanitation and refuse removal. The majority of the Municipality’s infrastructure budget is allocated towards the provision of basic services. The majority of spending on trading services have been allocated towards waste water management (R109.7 million). This was followed by water management (R53.4 million), electricity (R39.3 million) and waste management (R7.7 million). 2020 Socio-economic Profile: Stellenbosch Municipality 19
1.    Demographics

        • Population: Department of Social Development, 2020
        • Sex ratio: Department of Social Development, 2020
        • Age cohorts: Department of Social Development, 2020
        • Number of households: Department of Social Development, 2020
        • Household size: Department of Social Development, 2020
        • Population density: Department of Social Development, 2020

 2.     Education

        • Learner enrolment: Western Cape Education Department, 2020; Annual Survey of Public and
          Independent Schools (ASS), 2019
        • Learner-teacher ratio: Western Cape Education Department, 2020; Annual Survey of Public and
          Independent Schools (ASS), 2019
        • Learner retention: Western Cape Education Department, 2020; Annual Survey of Public and
          Independent Schools (ASS), 2019
        • Educational facilities: Western Cape Education Department, 2020; Annual Survey of Public and
          Independent Schools (ASS), 2019
        • No-fee schools: Western Cape Education Department, 2020; Annual Survey of Public and
          Independent Schools (ASS), 2019
        • Schools with libraries: Western Cape Education Department, 2020; Annual Survey of Public and
          Independent Schools (ASS), 2019
        • Educational outcomes: Western Cape Education Department, 2020; Annual Survey of Public
          and Independent Schools (ASS), 2019

 3.     Health

        • Healthcare facilities: Department of Health, 2020
        • Emergency medical services: Department of Health, 2020
        • HIV/AIDS: Department of Health, 2019Tuberculosis: Department of Health, 2020
        • Child health: Department of Health, 2020
        • Maternal health: Department of Health, 2020

 4.     Poverty

        • GDPR per capita: Statistics South Africa, 2020
        • Income Inequality (Gini-coefficient): Quantec Research, 2020
        • Human Development (Human Development Index): Quantec Research, 2020

2020 Socio-economic Profile: Stellenbosch Municipality                                               20
5. Basic services
• Households: Quantec Research, 2020
• Access to housing: Quantec Research, 2020
• Access to water: Quantec Research, 2020
• Access to electricity: Quantec Research, 2020
• Access to sanitation: Quantec Research, 2020
• Access to refuse removal: Quantec Research, 2020
• Free Basic Services: Statistics South Africa, Non-Financial Census of Municipalities 2019
6. Safety and security
• Murder: South African Police Service (SAPS), 2020, own calculations
• Sexual offences: South African Police Service (SAPS), 2020, own calculations
• Drug-related crimes: South African Police Service (SAPS), 2020, own calculations
• Driving under the influence: South African Police Service (SAPS), 2020, own calculations
• Residential burglaries: South African Police Service (SAPS), 2020, own calculations
• Road user fatalities: Department of Transport and Public Works, 2020
7. Economy
• Sector Performance: Quantec Research, 2020
• Employment growth per sector: Quantec Research, 2020
• Trends in labour force skills: Quantec Research, 2020
• Unemployment rates: Quantec Research, 2020
8. Public infrastructure spend
• Provincial Infrastructure Spend: Estimates of Provincial Revenue and Expenditure (EPRE), 2020;
Overview of Adjusted Provincial and Municipal Infrastructure Spend (OAPMII), 2020
• Municipal Infrastructure Spend: Final approved 2020/21 municipal budgets, Budget Schedule A5
2020 Socio-economic Profile: Stellenbosch Municipality 21You can also read