The second wave of COVID-19 in South and Southeast Asia and vaccination effects
←
→
Page content transcription
If your browser does not render page correctly, please read the page content below
The second wave of COVID-19 in South and
Southeast Asia and vaccination effects
Haitao Song
Shanxi University
Guihong Fan
Columbus State University
Yuan Liu
The Hong Kong Polytechnic University
Xueying Wang
Washington State University
Daihai He ( daihai.he@gmail.com )
Hong Kong Polytechnic University https://orcid.org/0000-0003-3253-654X
Research Article
Keywords: COVID-19, Southeast Asia, South Asia, Mathematical modelling, Delta variants, Vaccination
Infection attack rate, infection fatality rate
Posted Date: September 13th, 2021
DOI: https://doi.org/10.21203/rs.3.rs-877949/v1
License: This work is licensed under a Creative Commons Attribution 4.0 International License.
Read Full License
Loading [MathJax]/jax/output/CommonHTML/jax.js
Page 1/11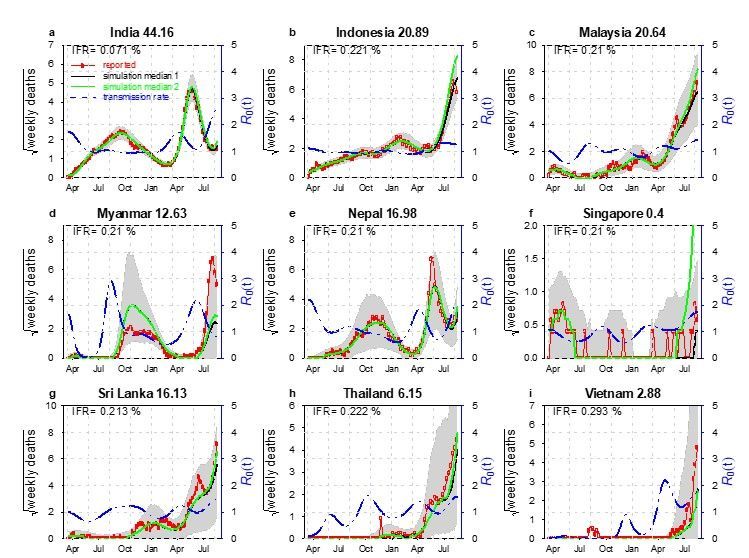
Abstract
Background By February 2021, the overall impact of the coronavirus disease 2019 (COVID-19) in South
and Southeast Asia had been relatively mild. Surprisingly, the second wave in early April 2021 in this
region becomes devastating and attracts worldwide attention.

Methods We focus on the nine countries with the highest accumulative deaths due to the disease by July
30, 2021. We study the transmission dynamics of the COVID-19 in South and Southeast Asia using the
reported death data and fit into a mathematical model with time varying transmission rate.

Results We estimated the transmission rate, the infection fatality rate, and the infection attack rate, the
effects of vaccination in the nine countries in South and Southeast Asia. Our study suggests that the
infection attack rate is still low in most of the countries and vaccination is needed to prevent further
waves.

Conclusion The implementation of the non-pharmacological interventions (NPIs) could have helped
South and Southeast Asia to keep the COVID-19 under control in 2020 as reflected in our estimated low
transmission rate. Factors like the emergence of the new Delta variant, social unrest, and migrant workers
could have been the trigger of the second wave of COVID-19.

Trial registration. NA

Introduction
The Coronavirus Disease 2019 (caused bySARS-CoV-2) attacked the world with an unexpected way in
2019 and changed human life tremendously [1]. The SARS-CoV-2virus is transmitted via respiratory
droplets with an incubation 2–14 days [2]. Symptoms includes light infection of fever, cough, and
shortness of breath, to severe infections that patients may require intensive care or the support of
ventilators [2]. Ever since the world Organization (WHO) declared the disease a pandemic on March 11,
2020 [3], there are199.67 million confirmed cases worldwide and more than 4 million deaths reported [4]
by August 4, 2021.

The pandemic of COVID-19 in South and Southeast Asia has been mild in 2020 compared to other hot
spots of the world like Europe or North America. However, the appearance of the new variants of concern
(VOC), changes the pandemic dramatically in South and Southeast Asia with a sudden increase of cases
in many countries in this region [5]. For instance, the COVID-19 in Singapore, Vietnam, and Malaysia had
been well controlled at the earlier stage of the pandemic with the usage of non-pharmacological
interventions (NPI) [5]and later the vaccination champion. But the emergence of the new VOC has
reversed the trend and caused a new wave of infection. Since April 2021, South and Southeast Asia have
been plagued by a new, more contagious Delta variant of COVID-19, which was first reported in India in
October 2020 [6].According to [6], the new variant was one of the main factors accounts for the ongoing
wave of COVID-19 in South and Southeast Asia.
 Loading [MathJax]/jax/output/CommonHTML/jax.js
                                                  Page 2/11
The Delta variant causes an increasing crisis in Indonesia as well as other countries in the nearby region
[7–8] (see Fig. 1). By August 18, 2021, Southeast Asia has been fighting with the world’s highest COVID-
19 death toll which is caused by VOC but enhanced by the relative low coverage of vaccines [9]. Based on
the survey [10]by the Indian Council of Medical Research (ICMR), around 21.4% of 28,589 adultescent
participants had been infected by February 4, 2021.Another serological study [11] found that the
prevalence of IgG antibody (indication of past infection) to SARS-CoV-2 was 11.4% in East Java,
Indonesia. A serological study [12] among healthcare workers, in the Kathmandu valley, Nepal, showed a
23% positivity for PCR (polymerase chain reaction) testing. SARS-CoV-2 seroprevalence study [13]
indicated that a symptom-based PCR-testing strategy missed 62% COVID-19 diagnoses, and
approximately 36%of individuals with SARS-CoV-2 infection were asymptomatic. These serological
studies found a much higher infection attack rate (IAR, proportion of the population being infected) than
the estimated IAR based on reported cases. Therefore, these serological studies should be considered in
modelling if a reasonable IAR estimation and useful forecast for the pandemic is expected.
Table 1
Reported the third COVID-19 serum survey conducted by the Ministry of Home Affairs and Government of
India at the end of 2020 and January 2021.
Time Place People Blood serum
2020/12- India 28,598(general population and antibodies 24.1% with 23.0–25.3%
2021/01 healthcare workers (HCWs)) [95% confidence interval]
In Table 1, the survey involved 70 districts in India. Each district recruited 400 members of the general
population (over 10 years old) and 100 healthcare workers. After adjustment for weighting and assay
characteristics, for 28,598 serum samples, the sero-positive rate of antibodies against either N protein or
S1-RBD protein was 24.1% [20]
Table 2
Reported overall prevalence of IgG antibodies against SARS-COV-2 in 1819 subjects between June and
December 2020 (see [11]).
Time Place People Blood serum
2020/06- East Java, 1,819 IgG antibody to SARS-CoV-2 was 11.4%
2020/12 Indonesia (207/1,819)
Due to the limited data on COVID-19 prevalence in Indonesia, there is an investigation into SARS-COV-
2which caused the COVID-19 disease. From June to December 2020, 1,819 participants aged 16 years or
older were recruited from Surabaya city. An overall 11.4% prevalence of IgG antibodies against SARS-
COV-2 was observed in the subjects. By chi-square test of categorical variables, there is a significant
difference in the prevalence of SARS-COV-2 antibodies between working and occupational groups. A
Loading [MathJax]/jax/output/CommonHTML/jax.js
Page 3/11higher prevalence of IgG was detected in laboratory technicians (22.2%) compared with health care
workers (6.0%) directly treating COVID-19 patients and other health care workers (2.9%)[21].
Table 3
Reported PCR or serological test results for migrant workers residing in all dedicated hostels in Singapore
between 25 March and 25 July 2020.
Time Place People Blood serum
2020/03/25- Singapore 198,320 111,280 residents with a positive PCR or serology result, for
2020/07/25 an overall infection prevalence of 56.1% with 55.9–56.3%
Migrant (95%CI).
workers
As part of the national public health response to COVID-19, PCR and serum tests were conducted on
migrant workers residing in all dedicated hostels in Singapore between 25 March and 25 July 2020. This
included 43 dormitories with a total population of 198,320 (63.6% underwent PCR testing and 68.4%
underwent serological testing). PCR or serological results were positive in 111,280 inhabitants, with an
overall infection rate of 56.1% (and 55.9–56.3% of 95% confidence interval) [22].
Method
Mathematical modelling has been successfully used to forecast the trend of COVID-19 and assisted the
public health in policy making. This paper uses a simple compartment epidemic model. Our model
considers a time-dependent transmission rate since both human behaviors change and the use of control
measures can alter the transmission rate of the disease. Other epidemic parameters, like the latent
periods and the infection fatality rate, may vary as well. But for simplicity of the model, we choose to
focus only on time-varying transmission rate and assume other parameters to be constant.
We choose the model and parameters value from [14] and [15], with the addition of vaccination.
Ṡ = − βSI − vS
Ė = βSI − σE
İ = σE − γI
Ṫ = φγI − κT
Ḋ = θκT
Ṙ = (1 − θ)γI + (1 − π)κT + vS
Here S, E, I, R, and D are susceptible, exposed, infectious and recovered/immunized classes, T denotes a
delay class
Loading between infectious and death classes, D denotes death class. β denotes a time-varying
[MathJax]/jax/output/CommonHTML/jax.js
Page 4/11transmission rate which is modelled via an exponential cubic spline. σ, γ and κare rates at which
individual loses exposed status and infectious status, σ=0.5 days, γ = 1/3 days, and κ = 1/12 days.
Thus, we have a mean generation time (σ − 1 + γ − 1) of five days which is well line with estimates of
generation time in all previous studies. The infection fatality rate isφθ, which cannot be estimates
simultaneously with only death data. We fix φ and estimates θ. v is effective vaccination rate per capita,
when we incorporated this effective vaccination rate, we take into account of a 14-day delay for vaccine
to take effect and a uniform vaccine efficacy 85%. We note that our model is the simplest form one can
come up for this situation. Given that 7 of the 9 countries have a vaccination coverage (fully vaccinated)
less than 20%, thus the effect of the vaccination in these 7 countries would be mild. In Malaysia and
Singapore, and especially in Singapore, the vaccination coverage is high, we first fit the model with the
vaccination, the we simulate our fitted model without vaccination; thus, we showed the effects of the
vaccination campaign. We fixed the number of nodes at 9 for this work. We used the famous R package
POMP. The step-by-step description of the usage of this package on epidemiology models can be found
here https://kingaa.github.io/clim-dis/parest/odes.html.
We fit a unified model to reported COVID-19 deaths in nine countries in this region. Our study period is
from March 12, 2020, to July 30, 2021.We assume the transmission rate to be an exponential cubic spline
function spanning for the whole time series. This semi-mechanistic approach of modelling multiple
waves of infections has been successfully used in previous epidemic and pandemic.
Results
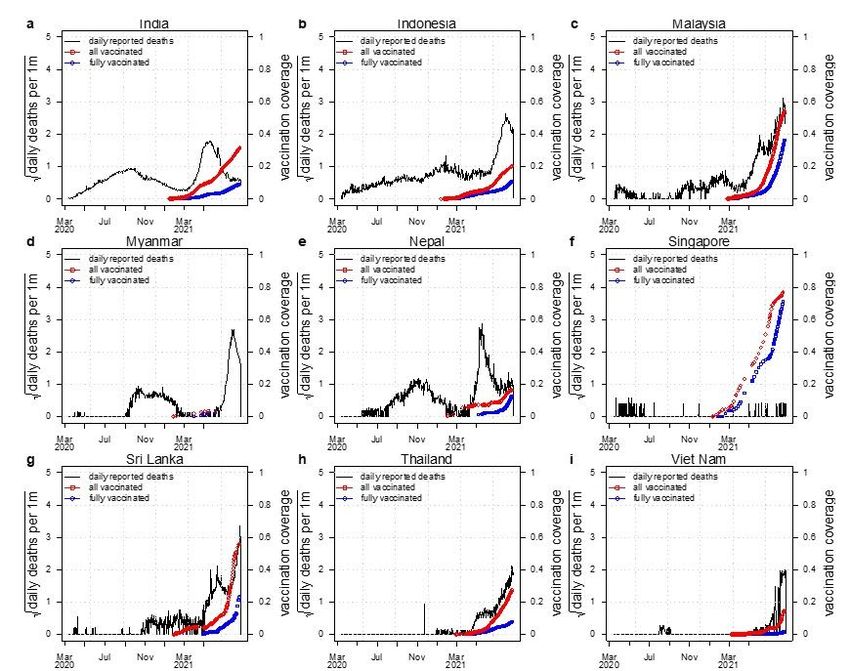
Using the data from WHO dashboard, Fig. 1 shows the trends of the confirmed COVID-19 deaths and
vaccination coverage (including one plus dose and two-dose) of the nine countries (India, Indonesia,
Malaysia, Myanmar, Nepal, Singapore, Sri Lanka, Thailand and Viet Nam). These nine countries account
for most deaths in South and Southeast Asia [16]. The time range of Fig. 1 is March 12, 2020, to July 30,
2021. Figure 1 shows that the first wave remains at a relatively low level of COVID-19 epidemic when
there is no vaccine coverage, while the second wave causes a much higher level of COVID-19 pandemic
when certain vaccine coverage is achieved.
In Fig. 2, the SEIHDR (Susceptible-Exposed-Infectious-Hospitalized-Dead-Recovery) model was used to
simulated the reported death of COVID-19 for the nine countries in South and Southeast Asia to
investigated the dynamics of COVID-19 in this region. The fitting results are used to evaluate the time-
varying effective reproduction number R 0(t)and the time varying transmission rate for each country.
From Fig. 2, except for Singapore, all other eight countries share a similar pattern: a lower level of first
wave and a higher level of second wave of COVID-19 infection. The red circles are the daily reported
deaths; the black curve denotes the median of 1000 model simulations; the shaded region denotes the
95% confidence interval (CI) of the 1000 simulations. The green curve shows the simulation median
without vaccination. The blue dashed curve denotes the reconstructed time varying transmission rate.
The deviation of the green and the black curves illustrates the effects of the vaccination. Sensitivity
analysis is provided in supplementary Figure S1-3.
Loading [MathJax]/jax/output/CommonHTML/jax.js
Page 5/11Discussion And Conclusion
Ever since the emergence of COVID-19 in 2019, it occupied the world rapidly (more than 200 countries
and territories). South and Southeast Asia countries have implemented the prevention and mitigation
strategies to combat COVID-19 pandemic, which includes testing, contact tracing, and the border control
[5].
Table 1 shows that the Indian government-initiated serum surveys indicate a 24.1% positivity of serum
antibody [20]. In Table2 shows an overall 11.4% prevalence of IgG antibody but the prevalence of IgG in
laboratory technicians was much higher than other professions in East Java, Indonesia [21]. The
Singapore government tested all migrant workers in dedicated hostels through PCR and serological
methods within four months, and obtained an overall infection rate of 56.1% [22].
Figure 1 gives the trends of COVID-19 deaths and vaccination coverage in South and Southeast Asia, and
shows that the first wave remains at a relatively low level of COVID-19 epidemic without vaccination
coverage, while the second wave attained a much higher level of COVID-19 epidemic with certain
vaccination coverage having been done. This counterintuitive observation motivates us to do further
investigation by a simple compartment epidemic model to forecast the COVID-19 epidemic in South and
Southeast Asia and seek for the potential reasons for this phenomenon.
As it is well noticed that due to the implementation of NPIs, the COVID-19 in South and Southeast Asia
had been under control in 2020 [5]. Subsequently, a new wave of COVID-19 pandemic appears in 2021 in
this region. The emergence of VOC was believed to be one of the key driving factors for the second wave
of COVID-19 in South and Southeast Asia [6]. Except for this common factor, the second wave of COVID-
19 also demonstrates some special features varying among countries. For example, multiple factors (a
lack of preparations exists national wide, and health and safety precautions poorly implemented or
enforced during festivals, sporting events, and state/local elections) could have caused the rapid
expansion of the epidemic in India and caused a large number of deaths, and the test positivity has
increased dramatically from 2% on March 1 to 22% on May 1 during the period of the second wave in
India. In Myanmar, the military coup of February 1st, 2021 brought a threat to the national health and
caused healthcare workers and other civil servants to stop working [17].The second wave in Nepalis
made worsen since it is bordered by India and it has many migrant workers from neighboring country
[18]. In Thailand, a group of young urban upper middleclass people who got infected after visiting night
clubs and restaurants at Bangkok during the long weekend. And then the disease spreads to their families
and relative and across the whole country quickly [19]. All these particular reasons could have caused the
second wave of COVID-19 further worse in South and Southeast Asia. The low infection fatality rate
estimated here is due that first we assume that COVID-19 death data are accurate, while in reality deaths
are under reported; second the serological studies in these countries suggest a large proportion of the
population has been infected. Thus, the infection fatality rate in this work may be regarded as a ratio of
infection to reported death, rather than the intrinsic IFR in these countries.
Loading [MathJax]/jax/output/CommonHTML/jax.js
Page 6/11The limitation of this work includes: we assume all parameters are constant except for the transmission
rate; the model is for the whole country while we ignore the heterogeneity across age groups and regions.
We only relied on the reported death data and adopted a non-mechanistic cubic spline type of
transmission rate. Alternatively, one could consider explicitly incorporate all kinds of control measures
(e.g., google mobility matrix) into their model and may expect to get more insightful observations on the
transmission status of COVID-19 in South and Southeast Asia. This work should be treated as a
conceptual simple modelling attempt to estimate the size of the epidemic in this region and the large-
scale trend. Our estimated infection attack rate is largely in line with serological studies and we illustrate
the effects of vaccination via very simple approach. The real situation of infection fatality rate and
vaccination is much more complicated than what we modelled here. Nevertheless, we laid a ground work
for further improvement.
Declarations
Consent for publication
Not applicable
Availability of data and materials
All data used in this work were publicly available. We used open source R package, for which detailed
instruction is available online.
Competing interests
None.
Funding
The work described in this paper was partially supported by a grant from the Research Grants Council of
the Hong Kong Special Administrative Region, China (HKU C7123-20G), the Fund Program for the
Scientific Activities of Selected Returned Overseas Professionals in Shanxi Province (20200001), the
National Natural Science Foundation of China (12171291) and the Key Research and Development
Project in Shanxi Province (202003D31011/GZ).
Authors' contributions
DH, HS, and GF conceived the study, carried out the analysis, and wrote the draft. DH, HS, YL and GF
discussed the results, revised the manuscript critically, and approved it for publishing.
Acknowledgements
None
Loading [MathJax]/jax/output/CommonHTML/jax.js
Page 7/11Authors' information
Haitao Song
Complex Systems Research Center, Shanxi University, Taiyuan 030006, China
Guihong Fan
Department of Mathematics, Columbus State University, Columbus 31907, USA
Yuan Liu and Daihai He
Department of Applied Mathematics, Hong Kong Polytechnic University, Hong Kong, China
Xueying Wang
Department of Mathematics and Statistics, Washington State University, USA
References
[1] Rui J, Niu Y, Wang Q, et al. Containing the transmission of COVID-19: a modelling study in 160
countries. Frontiers in Medicine, 1322.
[2] Centers for Disease Control and Prevention. Coronavirus Disease 2019 (COVID-
19). https://www.cdc.gov/coronavirus/2019-ncov/index.html.
[3] WHO Director-General’s opening remarks at the media briefing on COVID19 -March 2020.
[4] Coronavirus Resource Center, Johns Hopkins University. https://coronavirus.jhu.edu/map.html.
[5] Fauzi M A, Paiman N. COVID-19 pandemic in Southeast Asia: intervention and mitigation efforts.
Asian Education and Development Studies, 2020.
[6] Rambaut A, Holmes E C, O’Toole Á, et al. A dynamic nomenclature proposal for SARS-CoV-2 lineages
to assist genomic epidemiology. Nature microbiology, 2020, 5(11): 1403-1407.
[7] Dyer O. Covid-19: Indonesia becomes Asia’s new pandemic epicentre as delta variant spreads.
BMJ, 2021, 374:n1815.
[8] Chookajorn T, Kochakarn T, Wilasang C, et al. Southeast Asia is an emerging hotspot for COVID-19.
Nature Medicine, 2021: 1-2.
[9] IFRC, COVID-19: Southeast Asia battles world’s highest deaths. 18 August 2021.
https://reliefweb.int/report/indonesia/covid-19-southeast-asia-battles-world-s-highest-deaths.
[10] ANON.
Loading ICMR sero survey. In: Research ICoM, editor. India2021.
[MathJax]/jax/output/CommonHTML/jax.js
Page 8/11[11] Megasari N L A, Utsumi T, Yamani L N, et al. Seroepidemiological study of SARS-CoV-2 infection in
East Java, Indonesia. Plos one, 2021, 16(5): e0251234.
[12] Pandey K R, Bhattarai A, Pant S, et al. Seroprevalence of COVID-19 among health workers in the
Kathmandu valley, Nepal (SEVID-KaV): a longitudinal cohort study. 2021.
[13] Ng O T, Marimuthu K, Koh V, et al. SARS-CoV-2 seroprevalence and transmission risk factors among
high-risk close contacts: a retrospective cohort study. The Lancet infectious diseases, 2021, 21(3): 333-
343.
[14] Musa S S, Wang X, Zhao S, et al. Heterogeneous Severity of COVID-19 in African Countries: A
Modeling Approach. Researchsquare, 2021.
[15] He D, Artzy-Randrup Y, Musa S S, et al. The unexpected dynamics of COVID-19 in Manaus, Brazil:
Herd immunity versus interventions. medRxiv, 2021.
[16] WHO Coronavirus (COVID-19) Dashboard, https://covid19.who.int/.
[17] Han S M, Lwin K S, Swe K T, et al. Military coup during COVID-19 pandemic and health crisis in
Myanmar. BMJ global health, 2021, 6(4): e005801.
[18] Adhikari K. Third wave of COVID-19 in Nepal: challenges and way forward. Journal of Chitwan
Medical College, 2021, 11(2): 1-2.
[19] Tanomkiat W. The third COVID-19 wave in Thailand. The ASEAN Journal of Radiology, 2021, 22(1):
03-04.
[20] “SARs-CoV-2 Seroprevalence among the General Population and Healthcare Workers in India,
December 2020-January 2021 – Science Direct.” ScienceDirect.Com | Science, Health and Medical
Journals, Full Text Articles and
Books., http://www.sciencedirect.com/science/article/pii/S120197122100442?via=ihub.
[21] Ni LuhAyuMegasari, et al. “Seriepidemiological study of SARS-CoV-2 Infection in East Java,
Indonesia.”, 2021.
[22] Tan IB, Tan C, Hsu LY, et al. Prevalence and Outcomes of SARS-CoV-2 Infection Among Migrant
Workers in Singapore. JAMA. 2021;325(6):584–585. doi:10.1001/jama.2020.24071
Figures
Loading [MathJax]/jax/output/CommonHTML/jax.js
Page 9/11Figure 1
Reported confirmed COVID-19 deaths (black curve) in nine countries in SEA and SA, with vaccination
coverage all vaccinated proportion (red, partly vaccinated/one plus dose) and fully vaccinated proportion
of the population (blue, fully vaccinated/two-dose).
Loading [MathJax]/jax/output/CommonHTML/jax.js
Page 10/11Figure 2
Fitting an SEIHDR model to the reported death in India, Indonesia, Malaysia, Myanmar, Nepal, Singapore,
Sri Lanka, Thailand and Vietnam with a time varying transmission rate. The red circles denote daily
reported COVID-19 deaths. The black curve denotes the median of 1000 model simulations with
vaccination. The green curve shows the simulation median without vaccination. The shaded region
denotes the 95% confidence interval of the 1000 model simulations. The blue dashed curve denotes the
reconstructed transmission rate. Φ = 0.01 for India; Φ = 0.03 for other countries
Supplementary Files
This is a list of supplementary files associated with this preprint. Click to download.
SupplementalFigures.docx
Loading [MathJax]/jax/output/CommonHTML/jax.js
Page 11/11You can also read