Pandemic Spread-an Empirical Analysis - Rambam Maimonides Medical Journal
←
→
Page content transcription
If your browser does not render page correctly, please read the page content below
Open Access Rambam Maimonides Medical Journal ORIGINAL RESEARCH Special Issue on the COVID-19 Pandemic with Guest Editors Oren Caspi, M.D. and Ami Neuberger, M.D. Pandemic Spread—an Empirical Analysis Zvi Ziegler, Ph.D.* Professor Emeritus, Department of Mathematics, Technion–Israel Institute of Technology, Haifa, Israel ABSTRACT The coronavirus disease-2019 (COVID-19) epidemic started in late 2019, and was upgraded to a pandemic on March 11, 2020 by the World Health Organization (WHO). Well established epidemiological models have been used over the last few months in an attempt to predict how the virus would spread. The predictions were frightening, and the resulting panic caused many governments to impose lockdowns or other severe restrictions, with lasting effects. This short paper discusses another way of looking at the spread of COVID-19, by focusing on the daily rate of infection, defined as the daily rate of increase in the number of infected persons. It is shown that the daily rate is monotonically decreasing, after a short initial period, in all countries, and that the pattern is similar in all countries. This appears to be a universal phenomenon. Based on these calculations, the April 1, 2020 data for Western Europe were sufficient to predict the beginning of the end of COVID-19 in that region before the end of that month. KEY WORDS: Infection rate, pandemic, public awareness, restrictions INTRODUCTION At the time of writing, in May 2020, the corona- data allow analysis of the rate of spread. Analytical virus disease-2019 (COVID-19) pandemic has been tools would be useful for decision makers, both now with us for more than 5 months, and the available and for the future, if there is a second wave. Abbreviations: COVID-19, coronavirus disease-2019; USA, United States of America; WHO, World Health Organization. Citation: Ziegler Z. Pandemic Spread—an Empirical Analysis. Rambam Maimonides Med J 2020;11 (3):e0021. doi:10.5041/RMMJ.10410 Copyright: © 2020 Zvi Ziegler. This is an open-access article. All its content, except where otherwise noted, is distrib- uted under the terms of the Creative Commons Attribution License (http://creativecommons.org/licenses/by/3.0), which permits unrestricted use, distribution, and reproduction in any medium, provided the original work is properly cited. Conflict of interest: No potential conflict of interest relevant to this article was reported. * E-mail: zvi.ziegler@gmail.com Rambam Maimonides Med J | www.rmmj.org.il 1 July 2020 Volume 11 Issue 3 e0021
Pandemic Spread—an Empirical Analysis The most serious problem in this context is the METHODOLOGY FOR THE EMPIRICAL reliability and the meaning of the available data, STUDY OF INFECTION RATES both as to the number of infected persons and to the number of deaths due to COVID-19. Moreover, To better understand the COVID-19 pandemic and the percentage of people who have been tested, the the actual rate of infection, I began to look at raw da- methodology for choosing who is tested, and how, ta as it became available, using worldometer.com.5 all vary between countries. Initially, I compared their data to that of the Johns Hopkins tracker6 as well—with the same results. I We might think that the number of deaths is therefore focused on using worldometer.com as the iron-clad and totally reliable for comparative evalu- most appropriate data source for my study, since ation, but even the definitions for attributing deaths the fixed daily cut-off time of GMT +0 ensures that to COVID-19 are not identical in all countries. 1 For data can be easily compared. This provided con- example, in some countries, the death of a person sistency for dealing with comparisons over time. who has not been previously identified as being infected will not be attributed to the virus. In other My approach is different from standard ana- countries, if COVID-19 is detected at autopsy the lyses of epidemics, was based on easily obtained death is counted as due to the virus, whether or not data, and is, to the best of my knowledge, my own the virus actually caused the death or was simply innovative contribution. Table 1 includes the aver- present. Moreover, the definitions for a COVID-19- age daily infection rate for each week since March related death changed in the same country, often 4, 2020 for most Western European countries for political reasons (France, UK, and the USA are where the outbreak occurred earlier. There were prominent examples).2,3 two reasons behind the decision to initially exam- ine the data for Western European countries start- In view of these ambiguities all international ing from March 2020: firstly, data from Europe for comparisons are to be viewed with caution. I have February were erratic, and an apparatus for testing chosen a different route, by considering the trends over time in each country separately. The way each and reporting was only just getting started. Second- country operates over time is generally consistent, ly, COVID-19 was already widespread there when and therefore the analysis of trends over time is this study began on March 4, 2020, and although reasonable, unless there are internal changes of diagnostic definitions were not identical, the re- definitions or methodologies. In such a case, the porting of data from these nations was generally trends before and after such changes should be trustworthy. On March 11, 2020, the disease was viewed separately. An interesting example occurred designated by the World Health Organization in Ireland in the week of April 8–15, 2020, where (WHO) as a pandemic. Public awareness of this there seemed to be a “deviation” from the trend. On dangerous disease was awakened in other parts of further investigation, it was discovered that large the world, and this led, at a later stage, to an exten- batches of COVID-19 tests had been sent to Germa- sion of my study to include several other countries. ny for testing, resulting in an abrupt change in the The numbers considered are the numbers of number of persons who tested positive that week.4 infected people, i.e. the numbers of people who Caution is the name of the game; nevertheless, in tested positive for the virus. Tables 1 and 2 describe my opinion, the in-country trends are the most reli- the average daily infection rate in each week. Table able way to assess the spread of this coronavirus. 1 describes the findings until April 1 that formed the Herein I discuss an innovative calculation for basis for predictions, explained below. Table 2 de- looking at the spread of COVID-19, by focusing on scribes the findings until May 13, for an expanded the daily rate of infection, defined as the daily rate list of countries and states. To create these tables, I of increase in the number of infected persons. This needed, firstly, to develop a definition of the daily calculation is shown to have been sufficient, on the rate of increase. Since usually there are some fluc- week ending April 1, to predict the beginning of the tuations during any given week, I chose to calculate end of COVID-19 in Western Europe before the end and present in the tables the average rate during of April, 2020. each week. Rambam Maimonides Medical Journal 2 July 2020 Volume 11 Issue 3 e0021
Pandemic Spread—an Empirical Analysis Table 1. Calculated Daily Infection Rate for Weeks of February 26 through April 1, 2020. Based on actual data from worldometers.com5 and calculation of ( ) (see text). My prediction, made and widely disseminated at the beginning of April (see text), was that the rate of increase would be below 1.05 for most of Western Europe before the end of April. Feb. 26– March March March March 25– Country March 4 4–11 11–18 18–25 April 1 Austria -- 1.36 1.31 1.19 1.09 Belgium -- 1.45 1.25 1.19 1.16 Denmark -- 1.67 1.11 1.07 1.09 Finland -- 1.38 1.28 1.14 1.07 France -- 1.34 1.22 1.16 1.12 Germany -- 1.33 1.30 1.17 1.11 Greece -- 1.41 1.23 1.10 1.08 Iceland -- 1.20 1.18 1.13 1.06 Ireland -- 1.32 1.36 1.23 1.12 Israel -- 1.30 1.24 1.27 1.14 Italy 1.31 1.22 1.16 1.11 1.06 Luxembourg -- 1.32 1.61 1.31 1.08 Netherlands -- 1.44 1.22 1.18 1.11 Norway -- 1.40 1.14 1.10 1.06 Portugal -- 1.39 1.40 1.25 1.16 Spain -- 1.39 1.30 1.17 1.11 Sweden -- 1.38 1.15 1.10 1.10 Switzerland -- 1.32 1.25 1.20 1.07 United Kingdom -- 1.27 1.28 1.20 1.17 United States -- 1.35 1.32 1.33 1.18 --, available data inadequate for meaningful calculations. The daily rate of infection is calculated as of infected persons would be expected to increase follows: in a geometric progression, compounded daily by a factor of (1). For example, if ( ) = 1.26 (approx- ( +1) = ( ) (Eq. 1) imately), for all , the number of infected people ( ) would be expected to double every three days. where: ( ) is the number of infected persons on The initial rates, before the public and the the n-th day; ( + 1) is the number of infected authorities were aware of the existence of a lethal persons on day + 1; and ( ) the rate of increase disease and took precautions, were often close to, at the n-th day. or even higher, than this number and led to fear of an uncontrollable exponential growth. However, as I was interested in obtaining ( ) and determin- the calculations in Tables 1 and 2 demonstrate, ( ) ing its behavior over time. If ( ) = (1), for all , decreases monotonically within a few weeks, and i.e. there is no change over time, then the number converges to 1. When ( ) is close to 1, the growth Rambam Maimonides Medical Journal 3 July 2020 Volume 11 Issue 3 e0021
Pandemic Spread—an Empirical Analysis Table 2. Average Daily Infection Rate for Weeks of March 4 through May 13, 2020. Based on actual data from worldometers.com5 and calculation of ( ) (see text). Values below 1.01 are presented to 3 digits, to show how far the calculation is below 1. Data from Table 1, Used to Predict a Rate of Actual Calculated Data, Demonstrating Increase Below 1.05 by the end of April, 2020 Correctness of Prediction Based on Table 1 Country March March March March April April April April April 29– May 4–11 11–18 18–25 25–April 1 1–8 8–15 15–22 22–29 May 6 6–13 Australia -- 1.25 1.24 1.10 1.03 1.01 1.004 1.002 1.003 1.002 Austria 1.36 1.31 1.19 1.09 1.03 1.01 1.01 1.005 1.003 1.003 Belarus -- -- -- -- 1.31 1.20 1.10 1.09 1.06 1.04 Belgium 1.45 1.25 1.19 1.16 1.08 1.05 1.03 1.02 1.009 1.009 Canada -- 1.31 1.25 1.16 1.10 1.06 1.05 1.04 1.03 1.02 Denmark 1.67 1.11 1.07 1.09 1.08 1.03 1.02 1.02 1.01 1.01 Finland 1.38 1.28 1.14 1.07 1.08 1.04 1.04 1.02 1.02 1.03 France 1.34 1.22 1.16 1.12 1.10 1.04 1.02 1.01 1.007 1.01 Germany 1.33 1.30 1.17 1.11 1.05 1.03 1.02 1.01 1.006 1.005 Greece 1.41 1.23 1.10 1.08 1.04 1.02 1.01 1.01 1.005 1.005 Iceland 1.20 1.18 1.13 1.06 1.04 1.01 1.005 1.001 1.00 1.00 Ireland 1.32 1.36 1.23 1.12 1.08 1.11 1.04 1.03 1.01 1.007 Israel 1.30 1.24 1.27 1.14 1.06 1.04 1.02 1.01 1.004 1.002 Italy 1.22 1.16 1.11 1.06 1.03 1.02 1.02 1.01 1.007 1.005 Luxembourg 1.32 1.61 1.31 1.08 1.04 1.02 1.01 1.01 1.003 1.002 Mexico -- -- 1.23 1.17 1.13 1.10 1.08 1.08 1.07 1.05 Netherlands 1.44 1.22 1.18 1.11 1.06 1.05 1.03 1.02 1.009 1.006 Norway 1.40 1.14 1.10 1.06 1.03 1.02 1.01 1.01 1.005 1.003 Poland -- 1.37 1.20 1.14 1.11 1.06 1.04 1.03 1.02 1.02 Portugal 1.39 1.40 1.25 1.16 1.07 1.05 1.03 1.02 1.01 1.01 Romania -- 1.28 1.20 1.15 1.10 1.06 1.04 1.03 1.02 1.02 Russia -- -- 1.23 1.23 1.18 1.16 1.13 1.08 1.08 1.06 Spain 1.39 1.30 1.17 1.11 1.05 1.03 1.02 1.02 1.01 1.01 Sweden 1.38 1.15 1.10 1.10 1.08 1.05 1.04 1.03 1.02 1.02 Switzerland 1.32 1.25 1.20 1.07 1.04 1.02 1.01 1.01 1.003 1.002 UK 1.27 1.28 1.20 1.17 1.11 1.07 1.04 1.03 1.03 1.02 USA 1.35 1.32 1.33 1.18 1.11 1.06 1.04 1.03 1.02 1.02 CA -- -- 1.20 1.18 1.10 1.05 1.05 1.04 1.03 1.03 FL -- -- 1.29 1.22 1.11 1.05 1.03 1.02 1.02 1.02 GA -- -- 1.32 1.19 1.12 1.06 1.05 1.03 1.03 1.02 LA -- -- 1.30 1.20 1.15 1.04 1.02 1.01 1.01 1.01 NJ -- -- 1.46 1.3 1.15 1.07 1.05 1.03 1.04 1.01 NY -- -- 1.44 1.15 1.09 1.05 1.03 1.02 1.01 1.01 PA -- -- 1.33 1.27 1.16 1.07 1.05 1.03 1.03 1.02 TX -- -- 1.29 1.20 1.14 1.07 1.04 1.04 1.04 1.03 WA -- -- 1.12 1.12 1.07 1.02 1.02 1.02 1.02 1.01 --, available data inadequate for meaningful calculations; CA, California; FL, Florida; GA, Georgia; LA, Louisiana; NJ, New Jersey; NY, New York; PA, Pennsylvania; TX, Texas; UK, United Kingdom; USA, United States of America; WA, Washington. Rambam Maimonides Medical Journal 4 July 2020 Volume 11 Issue 3 e0021
Pandemic Spread—an Empirical Analysis rate is close to linear, indicating that the disease is was interesting to include separate states. For the in decay, and the country can begin to relax any re- purposes of this study, I included nine states from strictions in force. different regions. Table 2 demonstrates that the patterns discovered for Western Europe were also As explained above, since there are daily fluctu- valid in all 27 countries studied, and in the nine ations in the infection rates, it was decided to con- American states. There was a time lag in the down- sider the average daily increase rates for each week. ward convergence in some countries, depending on An entry in Tables 1 and 2 was computed as follows: the time the public and the authorities decided to (Eq. 2) take the pandemic seriously. Sometimes this hap- pened when the first few fatalities occurred, but it 7 √ = is difficult to determine the exact point in time when heightened public awareness began. ℎ 7 where √ is the seventh root of the weekly increase DISCUSSION (one week has seven days). Most assessments of epidemics use the R0 statistic, The rationale behind using the above geometric i.e. the expected number of secondary cases pro- progression to explore the spread of COVID-19 duced by a single (typical) infection.7 However, the seemed natural to me, since we are all interested in actual calculation of R0 is quite difficult, since esti- how fast a given population is being infected. Since mates depend on assumptions that are often quite each day presents with new numbers, infection hard to validate.8 I have proposed an alternative must be viewed from the beginning of each day by and easier methodology for calculating the spread considering the total number of infected people. of a pandemic. Theoretically, this should provide the rate at which The spread of an infection depends, among oth- that number will increase. er things, on anthropological-sociological aspects.9 The infection process, at the initial and most impor- RESULTS tant stages, is culture-dependent, according to some theories, and was recently discussed as it relates to Looking at my calculations based on the actual data COVID-19.10 An interesting example is the behavior of March 25, a clear pattern was discovered: a mono- of soccer-fans in and after the game between tonic decrease of the average daily rate of increase Atalanta-Bergamo and Valencia, on February 19, in the number of infected persons. On that basis, 2020, which was a very important factor in the the April 1 data for Western European countries, initial spread in Italy and Spain.11 Israel (where I live), and the USA were examined, and were summarized in Table 1. This table was The way in which a community functions, the sent, with an analysis, to many colleagues, friends, population density, the nature of social interaction, and people close to the decision makers in Israel, etc., are important. For example, there are signifi- on April 5, 2020. I included a prediction, that the cant differences between Scandinavian and Medi- rate of increase of the total number of COVID-19 terranean countries such as Italy and Spain in this infections would decrease, before the end of April, respect. A country with one major densely popu- to below 1.05 (a daily rate of increase in the total lated metropolitan area is different from a country number of infected persons of 1.05 is equivalent to with multiple foci. a doubling of the number of infected persons after After the initial stages, when the infection is get- two weeks) in most of Western Europe, which ting attention, and the public becomes aware of the would enable most of the countries to start relaxing need to exercise caution due to a dangerous dis- restrictions. From Table 2, it is clear that this pre- ease, the rate of infection begins to decrease. The diction was absolutely correct. reasons for the decrease are not fully understood, I subsequently added more countries outside of and deserve to be studied in depth. One possible ex- Western Europe to the analysis: Poland, Romania, planation of the decrease states that infection oc- Belarus (Eastern Europe), Russia, Canada, Austra- curs in two ways. Firstly, at the initial and crucial lia, and Mexico. Since the USA is such a large and phase, it evolves within the social circle of the in- varied country, with each state having its own gov- fected person and then decreases as infected people ernment, and interstate travel being unrestricted, it meet other infected people within their social cir- Rambam Maimonides Medical Journal 5 July 2020 Volume 11 Issue 3 e0021
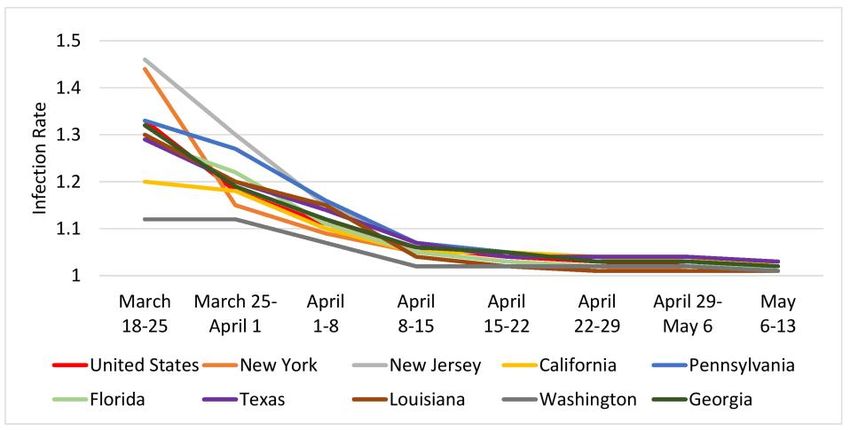
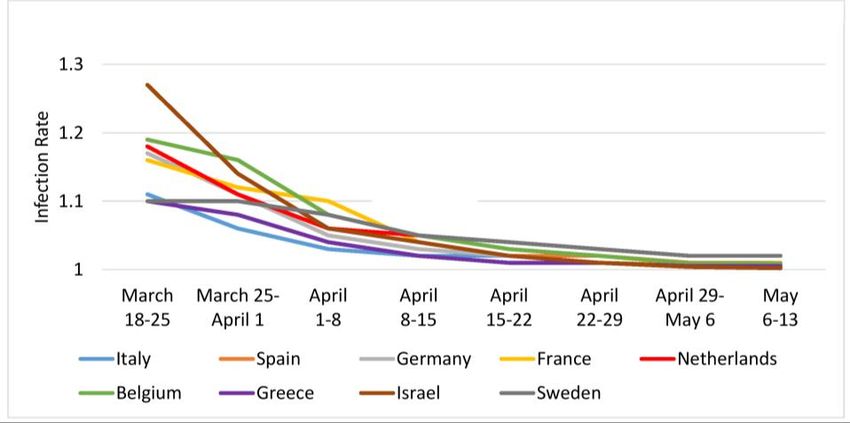
Pandemic Spread—an Empirical Analysis cles.12 Secondary to this is the random community if the rate of infection were, for example, 1.02, it spread of infection within the public domain, as oc- would take more than a month to double the num- curred in Barcelona, Spain.11 Anthropologists, soci- ber of infected persons, making treatment more ologists, and behavioral scientists will undoubtedly easily manageable. Moreover, at that rate of infec- collaborate in deciphering the relevant modes of tion, the number of people recovering would ex- behavior. In parallel, epidemiologists and virolo- ceed those who became infected during that period. gists still have a lot more to research and learn about In fact, there were several countries in Europe COVID-19, how it is transmitted, and its potency where this indeed started to happen in late April. over time. Clearly, the spread of COVID-19 is highly The daily rate of increase, ( ), is an important dependent on both the virus itself and on human indication of the spread of COVID-19. This calcula- behavior. tion is easily obtained, and an analysis of its behavior Figures 1–4 are based on Table 2 and demon- may serve as a predictor for the spread of the con- strate the steady decrease of the rate of infection tagion, and help to improve healthcare system pre- after the initial infection stage in all the examined paredness. It is also possible to draw conclusions re- countries (and nine states). A rate of infection close garding the need and timing for severe restrictions. to 1 means that the exponential growth at that point Most countries listed in Tables 1 and 2 imposed in time was very close to the linear growth. Hence, restrictions on their populations, ranging from Figure 1. Rates of Pandemic Spread for Western Europe and Israel: March 18–May 13, 2020. Figure 2. Rates of Pandemic Spread for Additional Western European Countries: March 18–May 13, 2020. Rambam Maimonides Medical Journal 6 July 2020 Volume 11 Issue 3 e0021
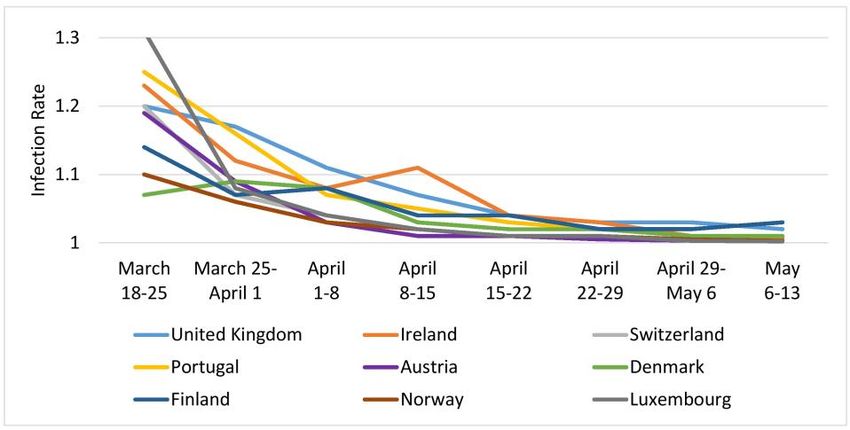
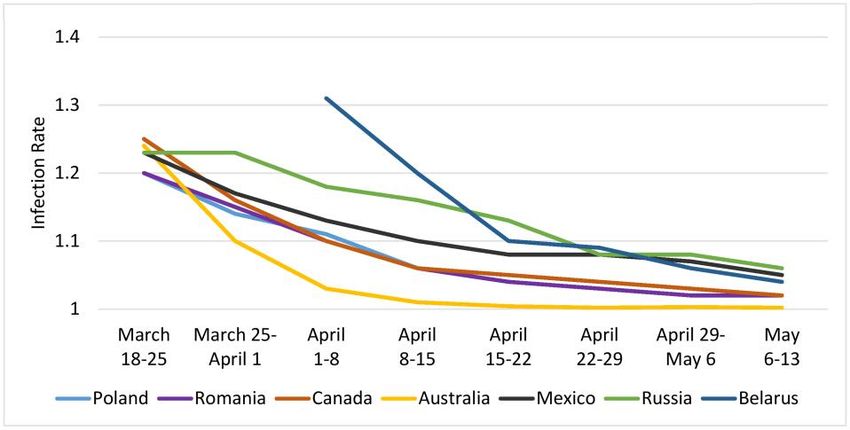
Pandemic Spread—an Empirical Analysis Figure 3. Rates of Pandemic Spread Outside of Western Europe: March 18–May 13, 2020. The line representing Poland is hidden by the data for Romania, reflecting similar data. Figure 4. Rates of Pandemic Spread for the USA and Selected States: March 18–May 13, 2020. minor to highly restrictive. A comparison between exhorting people to behave responsibly in the public Belgium, which imposed very severe restrictions and private spheres, in order to prevent compla- very early, and Sweden, which relied more upon the cency. residents’ understanding and compliance, reveals that the severity of restrictions was not the crucial CONCLUSION factor. Belarus imposed no restrictions, but the infection rate followed the same pattern. Based on The geometric rate of increase model, proposed these data, my conclusions are that it is crucial to herein, is much easier to evaluate than the statistic raise public awareness as early as possible. More- Ro, which is widely used. It circumvents the diffi- over, while some restrictions may be required, such culties in calculating R0, and is potentially a useful as restricting entrance into a country, prohibiting tool for analyzing the spread of the COVID-19 mass gatherings, and restricting activities where pandemic as well as other pandemics. Estimations proper behavior is almost impossible, the extent of should be calculated on future data of the current the restrictions should be limited and further re- pandemic, and a more comprehensive approach to laxed once the country enters a “comfort zone,” assessing the spread of a pandemic, utilizing both with the infection rate falling below 1.05. Relaxing Ro and the geometric rate of increase model, may restrictions should be accompanied by a campaign be explored. Rambam Maimonides Medical Journal 7 July 2020 Volume 11 Issue 3 e0021
Pandemic Spread—an Empirical Analysis REFERENCES 7. Ridenhour B, Kowalik JM, Shay DK. Unraveling R0: considerations for public health applications. Am J 1. Morris C, Reuben A. Coronavirus: why are interna- Public Health 2014;104:e32–41. CrossRef tional comparisons difficult? BBC News 2020; May 18. Available at: https://www.bbc.com/news/ 8. Viceconte G, Petrosillo N. COVID 19 R0: magic num- 52311014 (accessed June 10, 2020). ber or conundrum? Infect Dis Rep 2020;12:8516. CrossRef 2. The Economist. Tracking covid-19 excess deaths across countries. April 16, 2020. Available at: 9. Manderson L. Applying medical anthropology in the https://www.economist.com/graphic-detail/2020/ control of infectious disease. Trop Med Int Health 04/16/tracking-covid-19-excess-deaths-across- 1998;3:1020–7. CrossRef countries (accessed May 25, 2020). 10. Van Bavel JJ, Baicker K, Boggio PS, et al. Using 3. Brown E, Reinhard B, Thebault R. Which deaths social and behavioural science to support COVID-19 count toward the covid-19 toll? It depends on the pandemic response. Nat Hum Behav 2020;4:460– state. The Washington Post. April 16, 2020. Avail- 71. CrossRef able at: https://www.washingtonpost.com/inves- 11. Associated Press. A ‘biological bomb’: Atalanta vs. tigations/which-deaths-count-toward-the-covid- Valencia in Milan linked to accelerating coronavirus 19-death-toll-it-depends-on-the-state/2020/04/ outbreak. Sports Illustrated 2020; March 25. 16/bca84ae0-7991-11ea-a130-df573469f094_ Available at: https://www.si.com/soccer/2020/ story.html (accessed May 20, 2020). 03/25/atalanta-valencia-coronavirus-champions- 4. Murray S. Irish Air Corps makes first delivery of league-san-siro-milan-italy (accessed June 9, 2020). Covid-19 tests to German lab. The journal.ie news 12. Raffaetà R. An anthropological perspective on 2020; May 3. Available at: https://jrnl.ie/5090922 viruses. Aspenia online | International Analysis and (accessed May 25, 2020). Commentary website 2020; March 23. Available at: 5. Worldometers website. COVID-19 coronavirus pan- https://aspeniaonline.it/una-prospettiva- demic. Available at: https://www.worldometers. antropologica-sui-virus/ (accessed June 9, 2020). info/coronavirus/ (accessed May 25, 2020) [Italian] 6. Johns Hopkins University & Medicine website. Coronavirus Resource Center. Available at: https:// coronavirus.jhu.edu/ (accessed April 1, 2020). Rambam Maimonides Medical Journal 8 July 2020 Volume 11 Issue 3 e0021
You can also read