London Rent Watch: Rent inflation and Affordability in London's private rental market
←
→
Page content transcription
If your browser does not render page correctly, please read the page content below
London Rent Watch:
Rent inflation and
Affordability in
London’s private rental
market
From the Shelter policy library

March 2012

www.shelter.org.uk

© 2012 Shelter. All rights reserved. This document is only for your personal, non-commercial use.
You may not copy, reproduce, republish, post, distribute, transmit or modify it in any way.
This document contains information and policies that were correct at the time of publication.
London Rent Watch

Contents

       Title                                                             Page
       Introduction                                                       3

       Key findings                                                       4

       Methods and sources                                                6

     Detailed findings:                                                   10
  1) Rent inflation                                                       10
     Rent Inflation – London, Inner and outer by bedrooms size            11
     Rent inflation – comparisons with other indicators                   13

  2) Affordability                                                        16
     London affordability map                                             18
     Table – Household incomes required to rent affordably, by borough    19
     Table - Median rent as a proportion of London’s median household     20
     income, by borough

  3) Affordability – key worker families                                  21
     Table - Number of boroughs unaffordable, key worker family           22
     examples

       Annex tables                                                       23

       Acknowledgements                                                   27

DOWNLOADED FROM THE SHELTER WEBSITE www.shelter.org.uk
© 2012 Shelter                                                                  2
London Rent Watch
Introduction
At the launch of the Homes for London campaign in March 2012, Shelter revealed that 65% of
non home-owning Londoners expect never to be able to buy a home in their local area. Buying a
home in the capital is becoming ever harder – the typical deposit needed for a first time buyer in
London is estimated at over £84,000 - and social housing is in short supply. This means more
and more Londoners have found themselves with no choice but to rent privately - nearly a
quarter of London households are renting from private landlords, (23%, 700,000), up from 15%
(445,000) ten years ago.1
Private renting is no longer solely the domain of highly mobile students and young professionals.
Nationally, the number of families with children renting privately has grown disproportionately;
there are now more than one million families with children renting privately in England, almost
double the number five years ago. Six and 12 month letting contracts are common and renting
families are ten times more likely to have moved in the last year than those paying a mortgage,
resulting in a much less stable family situation for those forced to rent.
Families want to put down roots in their community, but in an overheated market their choices are
severely limited. Simple things like the ability to redecorate or make minor improvements would
help renting families make their house feel homely, yet are typically banned in tenancies. As a
result, almost half of families with children responding to a recent survey do not think of their
private rented accommodation as ‘home’.2
Home is the centre of family and community life, and is integral to the way Londoners feel about
their city. However, private renters are much less likely to know their neighbours, volunteer or
vote. The high cost of renting and moving presents barriers to renters taking up jobs and
dampens consumer spending by reducing disposable income.
Difficulty affording the rent is the most widespread problem among renters, and the research in
this report reveals a detailed picture of rent inflation and affordability in London’s private rental
market. Using newly available figures from the Valuations Office Agency (VOA), the Government
body responsible for collecting data on the private rental market, the report covers:
rent inflation rates for inner, outer and the whole of London, split by bedroom size
the levels of household income needed to afford the median rent on a two bedroom home
in each London borough
the affordability of private renting in London for key worker families on median pay for
their roles
This is the second report in Shelter’s Rent Watch series, this time focussing exclusively on rental
trends in the capital. The affordability findings can be viewed as an interactive map on our
website. It follows from Shelter’s first Rent Watch report on local rent levels and affordability
throughout England, published in October 2011.
1
Homes for London policy briefing, Shelter 2012
2
Homes fit for families, Shelter 2012
DOWNLOADED FROM THE SHELTER WEBSITE www.shelter.org.uk
© 2012 Shelter 3London Rent Watch
Key Findings
Rent Inflation in London
Results
Private rents rose at an average annual equivalent rate of 7% across London in 2011.3
London rents rose slightly more on family sized homes with rises of 7% for two bedroom
homes, and 8% for three bedroom homes.
The rate of rental inflation was slightly higher in Inner London at 7.4%, than in Outer
London at 5.5%.4
The rate of inflation on London private rents is 1.8 times greater than the rate of inflation
on the average London wage.5 In outer London it is three times higher than wage inflation.
In contrast to the rises in rents, average London wages have fallen for a number of key
worker professions: The London average wage for nurses and teachers is down by 1%,
and Police Officers pay in the capital is down by 2%.
Method
We compared average private rents in London, between the first set of rent statistics (covering
the twelve months July 2010 to June 2011) and the latest available (covering the twelve months
January 2011 to December 2011).6 The difference found between rents in these two sets of data,
which are six months apart, is then calculated as an annual equivalent inflation rate for 2011.7
This is the rate of inflation that would be seen if the trend observed in the rents we analysed
continues for a further six months.
The rents were weighted to account for changes in the geography and mix of different sized
homes, ensuring a like-for-like comparison between the two samples. The methodology has been
independently verified. 8 The rental data is from a Government source and each sample contains
the agreed contractual rents of over 55,000 private rental homes in the capital. It is the most
detailed and robust publicly available set of statistics on private rents.
3
Properties with four plus bedrooms were excluded from this rate, due to the exact mix of bedroom sizes
being unknown. This is an average of shared to three bedroom homes.
4
See annex table 4 for Inner and Outer London Boroughs.
5
Wages figures are from ASHE 2011 provisional results, and inflation to wages is for the period March
2010 to March 2011, these do not exactly match the period used for rent inflation, but are the latest
available.
6
Private Rental Market Statistics, VOA. The datasets were weighted to account for changes in the mix of
bedroom sizes and in the locations of homes. See methods and data sources section for more details.
7 st
The mid time points of the two datasets in the annual equivalent calculations are 1 January 2011 and
31st December 2011.
8
An independent academic expert on housing and rents confirmed that the methods used by Shelter were
fair and the most accurate possible, with the data and time available.
DOWNLOADED FROM THE SHELTER WEBSITE www.shelter.org.uk
© 2012 Shelter 4London Rent Watch
Affordability in London
Results
A family would need a net household income of just over £41,100 a year (an estimated
£51,900 gross in wages) to affordably rent a two bedroom home at the median London
rent (£1,200 per month).
A net household income of more than £40,000 is required to affordably rent the median
two bedroom home in half (16 of 32) of London’s boroughs. This equates to an estimated
£50,400 gross in wages.
In six boroughs, more than £52,000 net household income is required, an estimated
£67,700 gross in wages. These include Tower Hamlets and Islington.
A family with London’s median gross household income of £34,200 would find the median
rent for a two bedroom home unaffordable in 26 of 32 boroughs.9
The median rent for a two bedroom home takes up more than 40% of London median
household income in 18 boroughs, and more than 50% in 9.
A full-time prison officer and a part time teacher with a net household income of £41,500
(£52,400 in gross wages) would find the median rent for a two bedroom home
unaffordable in 14 of 32 boroughs.
A full-time teacher and part time nurse with a net household income of £43,900 (gross
wages £55,900) would find the median rent for a two bedroom home unaffordable in 12 of
32 boroughs.
Method
Median rents are from the same Government source as the inflation analysis and we use the
latest available set, which cover the twelve months January 2011 to December 2011.10
Affordability is set at 35% of total net household income.11 Gross wages are calculated on the
assumption that households are in receipt of child benefit for one child and have two equal
earners. The key worker family example uses median wages for the relevant profession, plus
child benefit.12
9
£34,236 gross, CACI Pay check, 2011, Shelter estimated net equivalent £31,300. Equivalent Government
figures on London Median household income not available. This is the median household income for
London, not by individual borough.
10
VOA private rental market statistics. Note these are median rather than mean averages and are slightly
different to those used in the rent Inflation section
11
This is at the top end of income to housing cost ratios suggested by previous research, and practice in
other countries, see footnote 17
12
ASHE 2011, provisional results, table 15.7a
DOWNLOADED FROM THE SHELTER WEBSITE www.shelter.org.uk
© 2012 Shelter 5London Rent Watch
Methods and data sources
Data sources
Private rents
The analysis in this report is based on the Valuations Office Agency (VOA) private rental market
statistics. The sections on affordability are based on the latest available statistics which cover the
period January 2011 to December 2011. The section on rent inflation compares the first set of
statistics released by the VOA, which cover the period June 2010 to July 2011, with the latest set.
More details on how the inflation and affordability results were calculated are contained in the
sections below.
These statistics are considered the best available source on private rents for the following
reasons:
The sample size is very large – more than half a million rents per year (with more than
sixty thousand in London).
They are based on the agreed contract rent and not advertised rents, in contrast to most
website sources
They provide a good representation of the lower end of the market, and include many lets
that have been made directly by landlords and not via a letting agent. The average rents
produced tend to be lower than most other sources.
They are published in accordance with Office of National Statistics guidelines.
However, there are some constraints with these statistics:
Tenancies where Housing Benefit was claimed from the outset should be excluded (rents
where a tenant claimed HB after the start of the tenancy are included), but it is highly
likely some are included, particularly as the LHA system means it is now more common
for landlords to be unaware of the benefit status of their tenants. Under-representation of
benefit claimants is an issue for nearly all sources of data on private rents. Shelter
continues to publish research on the Housing Benefit subset of the market, but this report
purposely focuses on the general market. The only definitive source for the rents charged
on lets to LHA claimants is the DWP’s Single Housing Benefit Extract, which is not
publicly available.13
The rental figures published by the VOA include money paid to private landlords or letting
agents for utilities and service charges. In reality, this is only common practice in the
shared accommodation category, so has little impact on the overall averages.
The VOA statistics are a relatively new data source, and at the time of publication only
three separate twelve-month sets of rental averages were available. Due to the rolling
reporting of 12 month datasets, there is a six month overlap between the first and last
13
The changes to Local Housing Allowance mean it is possible that rents in the LHA subset of the market
have inflated at a slower pace that the non-claimant sector, however this is unknown until the DWP
evaluation of the changes is published. If it were possible to boost the sample of LHA claimants in our
research, it is unlikely that findings would significantly change.
DOWNLOADED FROM THE SHELTER WEBSITE www.shelter.org.uk
© 2012 Shelter 6London Rent Watch
samples. The results in this report, particularly those on rent inflation, should therefore be
viewed as a good indication of current trends, but will require revision once further sets of
data become available. The overall averages are in line with other estimates of rent
inflation in London, but the differences between bedroom sizes – particularly the finding
that inflation is lowest in the shared category should be treated with caution at this early
stage in the development of private rental market statistics.
The whole private rental market is extremely difficult to monitor in a representative way, but
overall, the VOA private rental market statistics provide the best sample sizes and most accurate
representation of the market, of any publicly available source.
Sample sizes
The total analysed sample sizes are: 61,563 (of which 23,588 were two bedrooms) in the first set
of statistics, and 55,095 (of which 21,757 were two bedroom homes) in the second.
With these sample sizes, The London averages have an estimated statistical margin of error of
less than 0.5%.
The City of London is excluded from all the analysis due to its low sample sizes in all property
size categories. The local authority level results on the website for shared accommodation
exclude five further local authorities (Bexley, Harrow, Havering, Barking and Dagenham,
Kensington and Chelsea), because the sample size for this category is under 100 in at least one
of the two sets of VOA statistics. In all other sizes of home included in the research (one, two and
three bedroom homes), the sample sizes are over 100 for each borough. The average sample
size for two bedroom homes is around 700 per borough in each set of statistics.14 The annex
tables show the full breakdown of sample sizes by bedroom sizes.
Homes larger than three bedrooms are not included in the calculations of ‘all sizes’ averages,
because the VOA statistics present these in one category – ‘four or more bedrooms’, so the mix
of sizes in this category is unknown, meaning it cannot be mix-adjusted. Any ‘all sizes’ averages
in this research exclude this category and represent the average of shared accommodation to
three bedroom homes. The inflation rate for the four or more category is shown separately, as an
indicative rate, and should be treated with caution.
14
Mean average sample size by borough for two bedroom homes July 2010 to June 2011 was 737, and for
January 2011 to December 2011 was 680.
DOWNLOADED FROM THE SHELTER WEBSITE www.shelter.org.uk
© 2012 Shelter 7London Rent Watch Methods Use of averages Section one, on rent inflation uses the change in the mean average rent, as this is by far the most commonly used when research examines rental, or any type of inflation. The median is not suitable as it is affected by rents clustering around the middle in some areas and cannot be reliably calculated. Whenever rent inflation is compared to other types of inflation (to wages, for example), the increases to mean averages are also used, to ensure a like-for-like comparison. Sections two and three use the median rent (and median wages and incomes as comparators).This type of average is more commonly used in research on housing affordability. It is the point which splits the market in half according to the rent, and is less affected by variations in extremely high and low rents. In the affordability sections, the median is used in all calculations, for example the median London wage is used for the key worker family examples. Rent Inflation This analysis examines the changes in mean average rents between the first available set of rent statistics – the twelve months of July 2010 to June 2011 and the latest set which cover the twelve months from January 2011 to December 2011. The changes in average rents are also expressed as an annual equivalent 2011 rate. This is the rate of inflation that would be seen between the twelve months of July 2010 to June 2011 and July 2011 to June 2012, if the trend observed in the analysed rents continues for a further six months. It should therefore be viewed as indicative only. The two sets of statistics used each cover a twelve month period, so seasonal variations in rents should be evened out. When further data is published later in the year, Shelter will revise these inflation rates and, if possible, show them across the whole of the country. Average rates of inflation are calculated, for the whole of London, and Inner and Outer London. These are shown by bedroom size and as an all sizes (from shared to three bedrooms) average. These averages are calculated by using mix adjusting and weighting, because the mix of bedroom sizes and the boroughs in which homes are located differs between the two sets of VOA statistics, and they must be kept consistent to reliably estimate the inflation rate. The change in the mix of bedroom sizes between the two sets of rental statistics are accounted for by using the breakdown in the first set of statistics as a base, and weighting the second set to match it, ensuring a like-for-like comparison. The change in the geographic mix uses estimates of the numbers of households renting privately in each borough that were produced for Shelter by Cambridge University.15 The averages that use these weightings are: 15 CCHPR (Cambridge University) estimates for Shelter, 2010, calculated by updating the size of each London Boroughs private rented sector in 2001 Census by the increases for the London region according to the Labour Force Survey. DOWNLOADED FROM THE SHELTER WEBSITE www.shelter.org.uk © 2012 Shelter 8
London Rent Watch

     1. Inflation rates for London, Inner and Outer London, by each bedroom size

         Both sets of rent statistics are weighted using the estimated size of the private rented
         sector in each borough. For example, if a borough accounts for an estimated 5% of
         London’s private rented sector, its average rent for both time periods is multiplied by 0.05
         in the calculation for the London average. The estimates of the sizes of each borough’s
         private rented sector are not broken down by bedroom size, so an assumption that the
         geographic spread by bedroom size is uniform, is necessary. Results for Inner and Outer
         London are also shown as are annual equivalent inflation rates for 2011.16

     2. All sizes (up to three bedroom) average inflation rates, for London, Inner and Outer
        London

         This uses both the weightings for the mix of bedroom size, and geographic location, to
         produce an average London rent for each set of VOA statistics, which is then compared to
         give a whole of London average inflation rate. Results for inner and outer London are also
         shown.

The mix-adjusting and weighting was carried out with advice from a leading academic on rents
and housing affordability.

The London rent inflation figures are then compared to the rates of growth in Londoner’s wages
from 2010 to 2011 using the Annual Survey of Hours and Earnings (ASHE 2011). Comparisons
are also made to the two main measures of inflation – the Consumer Price Index (CPI) and Retail
Price Index (RPI), sourced from the Office for National Statistics.

Affordability – Household income needed to afford median rents

This section takes the median two bedroom rent in each London Borough, and shows a set of
results in terms of the net household income that would be required for that rent to take up 35%
of household income. 35% of net household income is taken as the maximum level, and this is at
the high end of thresholds of housing affordability for households on average to lower incomes,
suggested by previous research, and practice in other countries.17

The estimated gross wages required, shown in table 9, are calculated using the assumption that
the household receives child benefit for one child, has two equal wage earners paying only
income tax and national insurance, and no other income sources.

Table 10 in this section takes the London median household income from CACI Paycheck 2011,
and shows the proportion of this income taken up by the median rent on a two bedroom home in
each borough. This source was used because a median household income figure for London was
unobtainable from Government sources, and it is used in published reports by the Greater
London Authority and a number of councils. More details on the source and the way a net figure
was estimated, are contained in the section itself.

16
   These are Inner and Outer London Boroughs as shown by the VOA statistics (in accordance with ONS
guidelines), and may differ from that used for London pay weighting and other definitions.
17
   Various sources: Affordability of Housing Association rents;
http://en.wikipedia.org/wiki/Affordable_housing; Centre for affordable housing, Australia

DOWNLOADED FROM THE SHELTER WEBSITE www.shelter.org.uk
© 2012 Shelter                                                                                          9
London Rent Watch Affordability – Key worker families This section shows how many boroughs have median rents for two bedroom homes that are unaffordable for a number of indicative examples of key worker families. In these examples a net household income is calculated by using median wages for the profession in London, minus tax and national insurance and added to child benefit, which is the only benefit that is applicable at these income levels.18 19 The number of London Boroughs where the median rent for a two bedroom home is unaffordable is then calculated using 35% of net household income as an indicator (see footnote 17). Website Shelter’s website contains an interactive map and infographic showing some of the results of the research. Annex tables The annex tables show the sample sizes and weightings applied for each London Borough and bedroom size. An additional table of statistics on private renting households, and London households is also included. 18 ASHE 2011, provisional results, table 15.7a. This is based on the location of the job, residence based tables by profession and region are not available. Wages figures that are not specific to profession are based on residence – the wages of people living in London. 19 Gross to Net and reverse calculations are done on one of the many income tax calculators available on the internet, checked against HMRC’s site. DOWNLOADED FROM THE SHELTER WEBSITE www.shelter.org.uk © 2012 Shelter 10
London Rent Watch

Detailed Findings
Section one: Inflation in London’s private rented sector

Key findings

         Private rents in London rose at an average annual equivalent rate of 7% across all
         boroughs and bedroom sizes in 2011.20 [See figure 1]

         London rents rose by 7% for both one and two bedroom homes, with an 8% annual
         equivalent for 2011 rise in the rents agreed on three bedroom homes. The increase in
         shared accommodation is lower, at 1.4%.[See figure 1]

         The rate of rental inflation was slightly higher in Inner London at 7.4%, than in Outer
         London at 5.5%. [See figures 2 & 3]

         The rate of inflation on London private rents is 1.8 times the rate of inflation on the
         average London wage, for the closest comparable time period. In outer London it is three
         times higher than wage inflation. [See figure 4]

         In contrast to the rises in rents, average London wages have fallen for a number of key
         worker professions: The London average wage for nurses and teachers is down by 1%,
         and Police Officers pay in the capital is down by 2%. [See figure 5]

Method

This section shows the changes in mean average rents between the samples for the twelve
months of July 2010 to June 2011 and those for the period January 2011 to December 2011 are
analysed. Average inflation rates are calculated for Inner, Outer and the whole of London, for
each bedroom size, and as an ‘all sizes up to three bedrooms’ average. An annual equivalent
inflation rate for 2011 is shown. This is the rate which would be seen between the twelve months
of July 2010 to June 2011 and the twelve months of July 2011 to June 2012, if the trend observed
in the available rents data continues for a further six months.

As detailed in the methods section, the figures are weighted to ensure consistency with the mix of
bedroom sizes and the geographic locations of homes between the two sets of data.

20
   Properties with four or more bedrooms were excluded from the analysis, due to the exact mix of bedroom
sizes within that category being unknown. The ‘all bedroom size average’ referred to in this key findings
section covers shared, one, two and three bedroom homes. The inclusion or exclusion of 4+ bedroom
homes makes little difference to these overall averages, and some indicative results for this category are
included in the main findings.

DOWNLOADED FROM THE SHELTER WEBSITE www.shelter.org.uk
© 2012 Shelter                                                                                               11
London Rent Watch
Tables
Figure 1: Change in mean average private rents, London averages, mix adjusted for size and
location.
Inflation rate- change
Mean average in mean average
Mean average private rent per between July 2010 to Annual
private rent per month January June 2011 and equivalent
month July 2010 2011 to December January 2011 to inflation rate,
London to June 2011 2011 December 2011 2011
Shared £468 £472 0.7% 1.4%
Studio £768 £787 2.4% 5.0%
One bedroom £1,028 £1,061 3.3% 6.6%
Two bedroom £1,362 £1,408 3.4% 6.9%
Three bedroom £1,803 £1,878 4.1% 8.4%
Four + bedroom* £2,894 £3,040 5.0% 10.3%
Shared to three
bedroom total £1,165 £1,204 3.3% 6.8%
Sources: VOA Private Rental Market Statistics, 12 months from June 2010 to July 2011 and the 12
months from January 2011 to December 2011, total sample sizes 66,834 and 59,957;
* The exact mix of bedroom sizes within the 4+ category is unknown, and cannot be mix-adjusted, and
should be treated with caution.
The property size categories with the highest and lowest rates of inflation should both be
treated with some caution. These categories have the smallest sample sizes (albeit both more
than 5,000). The shared market is very varied and more likely to be affected by small changes
in sample collection, and as mentioned in the methods and sources section, the exact mix of
bedroom sizes is not known in the four or more bedrooms category, so mix adjusting is not
possible, making it is less reliable.
The headline rate of London rental inflation (6.8%) is a reliable indicator, based on two
datasets of over 55,000 rents each. This figure is similar to those produced by other sources
covering a similar time period and length of time. 21
21
LSL property services monthly private rental statistics show a 5.6% increase to London rents in 2011
(and it has risen since). Find-a-property.com found a higher increase of 8.4% in London Between October
2010 and October 2011. The English Housing Survey reports a 9% increase to London average private
rents between 2008-9 and 2009-10 (most recent available).
DOWNLOADED FROM THE SHELTER WEBSITE www.shelter.org.uk
© 2012 Shelter 12London Rent Watch
Figure 2: Change in mean average private rents, Inner London averages, mix adjusted to reflect
changes in mix of bedroom sizes and location.
Inflation rate- change
Mean average in mean average
Mean average private rent per between July 2010 to Annual
private rent per month January June 2011 and equivalent
month July 2010 2011 to December January 2011 to inflation rate,
Inner London to June 2011 2011 December 2011 2011
Shared £518 £528 1.9% 3.8%
Studio £879 £905 2.9% 5.9%
One bedroom £1,218 £1,261 3.6% 7.2%
Two bedroom £1,648 £1,701 3.2% 6.6%
Three bedroom £2,260 £2,377 5.2% 10.6%
Four + bedroom* £3,729 £3,952 6.0% 12.3%
Shared to three
bedroom total £1,378 £1,429 3.7% 7.4%
Sources: VOA Private Rental Market Statistics, 12 months from June 2010 to July 2011 and the 12
months from January 2011 to December 2011, total sample sizes 66,834 and 59,957;
* The exact mix of bedroom sizes within the 4+ category is unknown, and cannot be mix-adjusted, and
should be treated with caution.
Figure 3: Change in mean average private rents, Outer London averages, mix adjusted to reflect
changes in mix of bedroom sizes and location.
Inflation rate- change
Mean average Mean average in mean average
private rent private rent per between July 2010 to Annual
per month month January June 2011 and equivalent
July 2010 to 2011 to December January 2011 to inflation rate,
Outer London June 2011 2011 December 2011 2011
Shared £417 £414 -0.8% -1.6%
Studio £654 £666 1.8% 3.6%
One bedroom £833 £857 2.8% 5.7%
Two bedroom £1,069 £1,108 3.7% 7.4%
Three bedroom £1,337 £1,368 2.3% 4.6%
Four + bedroom* £2,041 £2,107 3.3% 6.6%
Shared to three
bedroom total £921 £946 2.7% 5.5%
Sources: VOA Private Rental Market Statistics, 12 months from June 2010 to July 2011 and the 12
months from January 2011 to December 2011, total sample sizes 66,834 and 59,957;
* The exact mix of bedroom sizes within the 4+ category is unknown, and cannot be mix-adjusted, and
should be treated with caution.
Annex table four shows which boroughs are in Inner and Outer London.
DOWNLOADED FROM THE SHELTER WEBSITE www.shelter.org.uk
© 2012 Shelter 13London Rent Watch
Rent inflation – comparisons with other indicators
Wages
The chart below shows the inflation rates for Londoners’ wages, compared to the annual
equivalent rental inflation rate found in this research. The wage figures are from the most recent
and closest matching time-period available (March 2010 to March 2011), and are the average
across all employees that live in London. It should be noted that this is an average wage of
individuals that are in work. Unemployment has risen more in London in the last year than in any
other UK region, and rising average wages do not necessarily equate to rising average
household incomes.22
Private rents rose at 1.8 times the rate of wage inflation, for the closest possible matching time
period, in London. The difference was more marked in Outer London, where rents rose 5.5%,
some three times the rate of average wage inflation which was 1.8%.
Figure 4: London private rental inflation (shared to three bedroom), compared to wage inflation.
Sources: London private rents, Shelter analysis of VOA private rental market statistics;
wages from ASHE provisional results 2011, changes in mean averages
22
http://www.guardian.co.uk/politics/davehillblog/2012/feb/15/london-unemployment-rate-increas
DOWNLOADED FROM THE SHELTER WEBSITE www.shelter.org.uk
© 2012 Shelter 14London Rent Watch
Key worker wage inflation
Whilst the average London wage has increased, a number of key worker professions have seen
decreases in average wages, and this is shown in the table below:
Figure 5: London average wage inflation, March 2010 to March 2011, examples of key worker
professions.
Inflation to average wage, London,
Profession March 2010 to March 2011
Nurses -0.8
Teaching Professionals -0.8
Police officers (sergeant and below) -2.0
Fire service officers (leading fire officer and below) -0.4
Sources: ASHE 2011 provisional results, table 15.7a, changes in mean averages
Price indices
The chart below shows the change in the two main measures of national inflation – the Consumer
Price Index and Retail Prices index - in the twelve months from January 2011 to the end of
December 2011. The London rental inflation rate found in this research is shown as a
comparison. The inflation figures are sourced from the Office for National Statistics and match the
time period for rental inflation.
Figure 6: London private rental inflation, compared to national price indices, 2011
Private rent inflation in London, compared to national price index inflation
8.0%
6.8%
7.0%
6.0%
4.8%
5.0% 4.2%
4.0%
3.0%
2.0%
1.0%
0.0%
Consumer Price Index Inflation Retail Price Index, January 2011 London private rents, annual
rate, January 2011 to December to December 2011 equivalent inflation rate 2011
2011
Sources: CPI and RPI - ONS; London private rents, -Shelter analysis of VOA statistics
DOWNLOADED FROM THE SHELTER WEBSITE www.shelter.org.uk
© 2012 Shelter 15London Rent Watch
Section Two
Affordability – household income required for median rents
to be affordable
Key findings
A family would need a household income of just over £41,000 a year (an estimated
£51,900 gross in wages) for the median rent on a two bedroom home in London to be
affordable. [See figure 9]
A total net household income of more than £40,000 (requiring an estimated £50,500 gross
in wages) is required in half of London’s boroughs (16 of 32), for the local median private
rent on a two bedroom home to be affordable. [See figure 9]
In six boroughs, more than £52,000 net household income is needed (an estimated
£67,700 gross in wages) for the median two bedroom rent to be affordable. [See figure 9]
A household with the estimated London median net household income of £31,300 would
find the median rent for a two bedroom home unaffordable in 26 of 32 boroughs. [See
figure 10]
Method
This section shows the most recent median private rents for two-bedroom homes in each London
Borough (January 2011 to December 2011). The net household income that a family would
require for the median rent to be on the threshold of affordability – at 35% of net household
income – is then calculated for each borough, and for inner, outer and the whole of London.
Background
The high cost of living in London is well documented, and although housing is the single biggest
cost for the majority of households, other essentials can take up a large chunk of household
incomes. For example parents pay an average of £5,668 per year on childcare in London (for
children under two years old), and some nurseries cost double this.23 The average London
household pays over £3,400 in transport costs per year, just under £3,000 on food and non-
alcoholic drinks and over £1,500 on water, electricity gas and other fuels.24
Figure 7 provides some of the most recent available statistics on average wages and household
incomes in London, and more details on the make-up of private renting households in London,
and nationally, which help put these findings into context, can be found in annex table 3.
23
Daycare Trust.
24
Family Spending 2011 (Living costs survey 2008-2010), table a35
DOWNLOADED FROM THE SHELTER WEBSITE www.shelter.org.uk
© 2012 Shelter 16London Rent Watch
The most useful comparator for median rents, a median household income figure for London, is
not available from published Government sources, so this is sourced from CACI. CACI’s figures
are calculated from a range of household and lifestyle surveys combined with Government survey
data. However, the mean gross household income figure they report for London - £41,435 is
somewhat lower than the Government equivalent. For this reason, the median household income
figures should be treated as indicative only.
Figure 7: London average household incomes and wages, various sources, most recent
available.
Description (All relate to Gross Estimated net Source/ time period average
London residents) amount amount relaters to
ONS Living Costs Survey, average
Mean household income £51,300 £40,500 2008-2010
25 26
Median household income £34,200 £31,300 CACI Paycheck 2011
ASHE 2011 provisional results,
Mean wage (all employment) £39,200 £29,200 March 2011
ASHE 2011 provisional results,
Median wage (all employment) £27,600 £21,100 March 2011
Median wage, Public sector, full ASHE 2011 provisional results,
time £35,200 £26,400 March 2011
Median wage, Public sector, part ASHE 2011 provisional results,
time £13,300 £11,300 March 2011
Sources: ASHE 2011 provisional results, table 15.7a. Amounts rounded to nearest 100. Net amounts are
estimated using an income tax calculator, deducting tax and National Insurance but not other possible
deductions such as pension contributions.
25
This is estimated by Shelter, on the assumption of two equal earners, and wages making up 68% of
income, which is the London average from Living Costs Survey 2008-10, table A41
26
CACI Paycheck uses a combination of data sources to estimate gross household income from all
sources, including benefits, and is used by the Greater London Authority.
DOWNLOADED FROM THE SHELTER WEBSITE www.shelter.org.uk
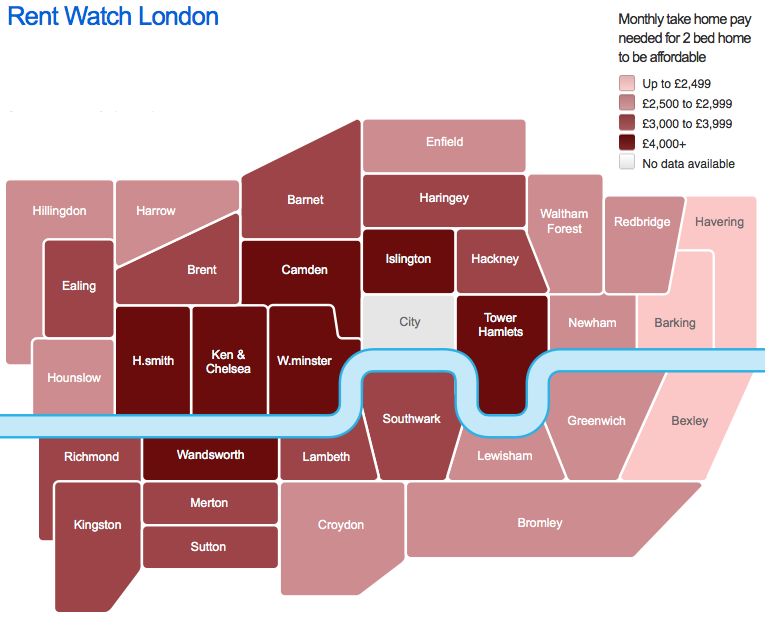
© 2012 Shelter 17London Rent Watch Affordability map Figure 8: map, monthly net household income required for median rents on two bedroom homes to be affordable (35% net household income). London Rent Watch Sources: Shelter analysis of VOA private rental market statistics, the 12 months from January 2011 to December 2011, median rents on two bedroom homes An interactive version of this map is available on our website. DOWNLOADED FROM THE SHELTER WEBSITE www.shelter.org.uk © 2012 Shelter 18
London Rent Watch

   Tables

   Figure 9: Local authorities in London, ranked by highest household incomes required for median
   local two bedroom rent to equal 35% of net household income.

Rank                                         Median rent       Net household             Net household            Estimated
(by                                          per month,        income required for       income required          gross
highest                                      two               median rent to            for median rent to       wages
rent/                                        bedroom           equal 35% of              equal 35% of             required
income)     Local authority                  homes             income (per month)        income (per year)        (per year)
       1    Kensington and Chelsea                £2,600                    £7,429                 £89,143         £126,545.86
       2    Westminster                           £2,383                    £6,810                 £81,714         £113,954.87
       3    Camden                                £1,863                    £5,324                 £63,886          £84,894.49
       4    Hammersmith and Fulham                £1,647                    £4,705                 £56,457          £74,128.78
       5    Islington                             £1,603                    £4,581                 £54,971          £71,975.24
       6    Tower Hamlets                         £1,517                    £4,333                 £52,000          £67,669.15
       7    Wandsworth                            £1,400                    £4,000                 £48,000          £61,871.88
       8    Hackney                               £1,387                    £3,962                 £47,543          £61,209.52
       9    Brent                                 £1,350                    £3,857                 £46,286          £59,387.41
      10    Richmond upon Thames                  £1,300                    £3,714                 £44,571          £56,902.94
      11    Southwark                             £1,300                    £3,714                 £44,571          £56,902.94
      12    Lambeth                               £1,273                    £3,636                 £43,629          £55,536.48
      13    Haringey                              £1,249                    £3,569                 £42,823          £54,368.78
      14    Ealing                                £1,200                    £3,429                 £41,143          £51,934.00
      15    Merton                                £1,200                    £3,429                 £41,143          £51,934.00
      16    Barnet                                £1,170                    £3,343                 £40,114          £50,443.31
      17    Kingston upon Thames                  £1,100                    £3,143                 £37,714          £46,965.05
      18    Hounslow                              £1,050                    £3,000                 £36,000          £44,480.58
      19    Harrow                                £1,027                    £2,934                 £35,211          £43,337.72
      20    Enfield                               £1,001                    £2,860                 £34,320          £42,045.80
      21    Lewisham                                £975                    £2,786                 £33,429          £40,753.87
      22    Newham                                  £953                    £2,724                 £32,686          £39,677.10
      23    Hillingdon                              £950                    £2,714                 £32,571          £39,511.64
      24    Waltham Forest                          £950                    £2,714                 £32,571          £39,511.64
      25    Greenwich                               £925                    £2,643                 £31,714          £38,269.40
      26    Bromley                                 £916                    £2,617                 £31,399          £37,812.75
      27    Croydon                                 £900                    £2,571                 £30,857          £37,027.16
      28    Redbridge                               £900                    £2,571                 £30,857          £37,027.16
      29    Sutton                                  £875                    £2,500                 £30,000          £35,784.93
      30    Barking and Dagenham                    £850                    £2,429                 £29,143          £34,542.69
      31    Havering                                £825                    £2,357                 £28,286          £33,300.46
      32    Bexley                                  £800                    £2,286                 £27,429          £32,058.22
            London                                   £1,200                    £3,429                 £41,143           £51,934

            Inner London                             £1,473                    £4,210                 £50,514           £65,515
            Outer London                             £1,000                    £2,857                 £34,286           £41,997
Sources: VOA Private Rental Market Statistics, the 12 months from January 2011 to December 2011, total sample size 21,781;
The estimated gross wages figure is calculated by assuming two people earn equal salaries in the household, they receive child
benefit for one child, and have no other income sources. At the lower end are likely to be slight over-estimates.

   DOWNLOADED FROM THE SHELTER WEBSITE www.shelter.org.uk
   © 2012 Shelter                                                                                                           19
London Rent Watch
Figure 10: Proportions of London median household income (estimated net amount, £31,300 per
year), taken up by the median rent on a two bedroom home, London Boroughs.
Rank (by % of London median
highest household income
income Median rent per month, (estimated net £31,300)
required) Local authority two bedroom homes taken up by median rent
1 Kensington and Chelsea £2,600 99.8%
2 Westminster £2,383 91.5%
3 Camden £1,863 71.5%
4 Hammersmith and Fulham £1,647 63.2%
5 Islington £1,603 61.5%
6 Tower Hamlets £1,517 58.2%
7 Wandsworth £1,400 53.7%
8 Hackney £1,387 53.2%
9 Brent £1,350 51.8%
10 Richmond upon Thames £1,300 49.9%
11 Southwark £1,300 49.9%
12 Lambeth £1,273 48.8%
13 Haringey £1,249 47.9%
14 Ealing £1,200 46.1%
15 Merton £1,200 46.1%
16 Barnet £1,170 44.9%
17 Kingston upon Thames £1,100 42.2%
18 Hounslow £1,050 40.3%
19 Harrow £1,027 39.4%
20 Enfield £1,001 38.4%
21 Lewisham £975 37.4%
22 Newham £953 36.6%
23 Hillingdon £950 36.5%
24 Waltham Forest £950 36.5%
25 Greenwich £925 35.5%
26 Bromley £916 35.1%
27 Croydon £900 34.5%
28 Redbridge £900 34.5%
29 Sutton £875 33.6%
30 Barking and Dagenham £850 32.6%
31 Havering £825 31.7%
32 Bexley £800 30.7%
London £1,200 47.1%
Inner London £1,473 57.8%
Outer London £1,000 39.2%
Sources: VOA Private Rental Market Statistics, the 12 months from January 2011 to December 2011, total
sample size 21,781; London median gross household income is from CACI Paycheck 2011, estimated net
amount calculated by Shelter on basis of 68% of gross income accounted for by wages (Living Costs
Survey 2008-2010), and a household with two equal wage earners.
DOWNLOADED FROM THE SHELTER WEBSITE www.shelter.org.uk
© 2012 Shelter 20London Rent Watch
Section Three:
Affordability – Key worker families in London
This section examines the affordability of median private rents on two bedroom homes in each
London borough for a range of key worker families with two incomes. The incomes are above the
threshold for any benefit, other than child benefit, which is added in. These are modelled
examples, rather than real-life cases, but the wages figures used are the real median earnings for
these key jobs in London.
Rent taking up no more than 35% of net household income is used as the indicator of affordability
(see footnote 17), and the results for a number of job combinations are shown.
Summary
The median rent on a two bedroom home is unaffordable in over a third of Boroughs for many
families with two earners on median London pay for their professions (one full time, one part
time):27
A full-time teacher and a part-time nurse on median London pay for their jobs, would find
12 of 32 boroughs unaffordable.
A full-time Prison officer and a part-time teacher on median London pay for their jobs,
would find 14 of 32 boroughs unaffordable.
A full-time police officer and a part-time nursery nurse on median pay would also find 14
of 32 boroughs unaffordable.
27
Median averages for jobs based in London, from ASHE 2011, provisional results, table 15.7a
DOWNLOADED FROM THE SHELTER WEBSITE www.shelter.org.uk
© 2012 Shelter 21London Rent Watch
Figure 11: Examples of total net household incomes for various key worker professions on
median London wages, affordability of two bedroom homes
Total net
household Number of
income London % of London
(including child boroughs boroughs
Full Time job Part time job benefit) unaffordable unaffordable
Teaching Professional Nurse £43,873 12 38%
Teaching Professional Social Worker £43,008 13 41%
Police officer
(sergeant and below) Nursery Nurse £42,011 14 44%
Fire service officers Occupational
(leading fire officer and below) Therapist £41,980 14 44%
Teaching
Prison Officer Professional £41,468 14 44%
Sources: wages are from ASHE 2011 provisional results, table 15.7a occupations by regions. Figures used are
London median wages for each profession, and child benefit for one child included. Affordability based on
Shelter calculations using VOA private rental market statistics, January 2011 to December 2011.
DOWNLOADED FROM THE SHELTER WEBSITE www.shelter.org.uk
© 2012 Shelter 22London Rent Watch
Annex tables
Annex table one: sample sizes
Sample size,
Sample size, all two bedroom Sample size, all
Sample size, two homes (shared to homes, January homes (shared to
Borough
bedroom homes, 3 beds) , June 2011 to 3 beds), January
June 2010 to July 2010 to July 2011 December 2011 2011 to December
2011 dataset dataset dataset 2011 dataset
Barking and Dagenham 354 867 303 752
Barnet 1,201 3,289 1,174 2,889
Bexley 364 946 354 876
Brent 609 1,616 575 1,450
Bromley 666 1,450 677 1,511
Camden 923 2,709 1,071 2,785
Croydon 443 1,084 616 1,571
Ealing 721 1,955 764 2,028
Enfield 562 1,496 529 1,350
Greenwich 616 1,442 520 1,185
Hackney 748 2,031 638 1,668
Hammersmith and Fulham 442 1,213 529 1,190
Haringey 486 1,659 558 1,753
Harrow 510 1,308 536 1,239
Havering 350 883 339 860
Hillingdon 936 2,301 710 1,830
Hounslow 904 2,256 790 1,865
Islington 968 2,771 773 2,129
Kensington and Chelsea 1,071 2,356 421 961
Kingston upon Thames 498 1,848 390 1,441
Lambeth 1,144 2,781 1,058 2,403
Lewisham 747 2,054 788 2,058
Merton 722 1,700 807 1,929
Newham 410 1,236 380 1,114
Redbridge 655 1,750 602 1,575
Richmond upon Thames 743 2,071 786 2,108
Southwark 1,022 2,663 982 2,502
Sutton 407 927 387 884
Tower Hamlets 1,236 3,019 953 2,347
Waltham Forest 520 1,362 631 1,473
Wandsworth 1,420 3,439 1,194 2,989
Westminster 1,190 3,081 922 2,380
Sources: VOA Private Rental Market Statistics, 12 months from June 2010 to July 2011 and the 12 months
from January 2011 to December 2011
DOWNLOADED FROM THE SHELTER WEBSITE www.shelter.org.uk
© 2012 Shelter 23London Rent Watch
Annex table two: Weightings applied
Geographic Bedroom Bedroom Bedroom Bedroom Bedroom size
weight applied size weight size weight size weight size weight weight applied
(Boroughs applied to applied to applied to applied to to second
Borough
PRS as a % second second second second dataset: three
of London dataset: dataset: dataset: one dataset: two beds
PRS) Shared studio bed beds
Barking & Dag 0.9% 1.586 1.100 1.056 1.168 1.095
Barnet 4.7% 1.542 1.090 1.035 1.023 1.040
Bexley 1.3% 1.725 0.731 0.947 1.028 1.085
Brent 4.1% 1.470 1.126 1.035 1.059 1.034
Bromley 2.4% 1.406 1.588 1.016 0.984 0.736
Camden 4.7% 1.594 1.085 0.972 0.862 0.928
Croydon 4.1% 0.553 1.000 0.766 0.719 0.652
Ealing 4.4% 0.911 0.892 1.010 0.944 0.995
Enfield 2.5% 1.502 1.028 0.968 1.062 1.004
Greenwich 2.1% 1.473 1.235 1.199 1.185 1.101
Hackney 2.7% 1.201 0.983 1.206 1.172 1.461
Hamm & Fulham 3.3% 1.871 0.820 1.019 0.836 1.012
Haringey 4.0% 1.138 1.131 0.776 0.871 1.037
Harrow 2.1% 1.677 0.865 1.055 0.951 1.103
Havering 1.1% 1.333 1.048 1.041 1.032 0.935
Hillingdon 2.1% 0.925 1.417 1.413 1.318 1.168
Hounslow 2.6% 1.556 1.342 1.215 1.144 1.172
Islington 2.8% 1.558 1.229 1.300 1.252 1.184
Kens. & Chelsea 4.4% 3.036 2.191 2.339 2.544 2.211
Kingston 2.2% 1.346 0.942 1.045 1.277 1.464
Lambeth 4.9% 1.659 1.040 1.059 1.081 1.222
Lewisham 2.9% 1.019 1.022 1.060 0.948 0.990
Merton 2.7% 0.793 1.159 0.838 0.895 0.994
Newham 3.4% 1.392 0.922 1.025 1.079 1.048
Redbridge 2.7% 1.029 1.175 1.194 1.088 1.118
Richmond 2.9% 1.108 1.100 1.015 0.945 0.850
Southwark 2.9% 1.125 1.115 1.021 1.041 1.169
Sutton 1.6% 0.856 1.028 1.040 1.052 1.203
Tower Hamlets 2.7% 1.219 1.427 1.316 1.297 1.245
Waltham Forest 3.2% 1.077 1.000 0.954 0.824 1.020
Wandsworth 5.6% 0.858 0.923 1.213 1.189 1.249
Westminster 6.0% 1.426 1.133 1.235 1.291 1.397
Sources: Geographic weight – unpublished estimates produced for Shelter by Cambridge University and
based on Census 2001 uprated by Labour Force Survey; Size weights, VOA private rental market statistics
DOWNLOADED FROM THE SHELTER WEBSITE www.shelter.org.uk
© 2012 Shelter 24London Rent Watch
Annex table three – statistics on the private rented sector, working people, children and
household incomes
These statistics help put the amounts needed to afford median rents in London into context,
although data is not always available at tenure and regional level:
The breakdown of working status among private renting families nationally is 27% with
no-one in work, 33% with a mix of working and non-working adults, and the minority
(40%) with all adults working. This 40% will include lone parent households where the
parent is in work.(1)
Other official statistics show that 28% of privately renting households nationally have
no working person, 37% one, and again the minority, 35% with two or more people
working.(2)
Statistics on London households (of all housing tenures) show that in half, all the
adults work, in 31% there is a mixture of working and non-working adults, and 19%
contain no-one in work.(2)
37% of London children live in a home where everyone works, 42% in households
with a mix of working and non-working adults, and 21% are households where no-one
works.(2)
Nationally, 30% of private rented households include children.(3)
Nationally, the majority (65%) of private renting households contain no more than one
person in full or part time work.(3)
Nationally, the median gross household income in the private rented sector is
£25,300, 12% below the national average of £28,400.(4)
(1) Family Spending 2011, based on 2010 living costs survey
(2) ONS - http://www.ons.gov.uk/ons/publications/re-reference-tables.html?edition=tcm%3A77- 222940
(3) English Housing Survey 2009-10
(4) English Housing Survey 2009-10
(5) English Housing Survey 2009-10, rounded to nearest 100
DOWNLOADED FROM THE SHELTER WEBSITE www.shelter.org.uk
© 2012 Shelter 25London Rent Watch Annex table four – Inner and Outer London borough classification Borough Inner London City of London (excluded from analysis due to small number of private rented homes) Camden Hackney Hammersmith and Fulham Haringey Islington Kensington and Chelsea Lambeth Lewisham Newham Southwark Tower Hamlets Wandsworth Westminster Outer London Barking and Dagenham Barnet Bexley Brent Bromley Croydon Ealing Enfield Greenwich Harrow Havering Hillingdon Hounslow Kingston upon Thames Merton Redbridge Richmond upon Thames Sutton Waltham Forest Source: Various Government sources, this is the categorisation used in Office for National Statistics outputs. DOWNLOADED FROM THE SHELTER WEBSITE www.shelter.org.uk © 2012 Shelter 26
London Rent Watch

Acknowledgements

We would like to thank the following for advice on research methods and calculating benefit
entitlements:

Alex Fenton, LSE
John Muir, Shelter

We would also like to thank the VOA for publishing private rental market statistics, and re-iterate
that the analysis, presentation and conclusions drawn in this report are entirely the work of
Shelter.

DOWNLOADED FROM THE SHELTER WEBSITE www.shelter.org.uk
© 2012 Shelter                                                                                        27
You can also read