POST-EARTHQUAKE PRICE DYNAMICS IN CHRISTCHURCH/CANTERBURY JUNE 2014
←
→
Page content transcription
If your browser does not render page correctly, please read the page content below
www.cdc.org.nz

           POST-EARTHQUAKE PRICE DYNAMICS IN
               CHRISTCHURCH/CANTERBURY

                                          JUNE 2014

 Prepared by:            Steven Perdia and Amy McNaughton

PO Box 2962, Christchurch 8140                              +64 3 379 5575
Level 1, 99 Cashel Street, Christchurch
Post-Earthquake Price Dynamics in Christchurch/Canterbury

The sections in this document are:
Executive Summary                                                        3
Introduction                                                             4
Methodology                                                              6
Economic Context                                                         8
Analysis and Commentary                                                  9
Summary and Findings                                                    12
Future Characteristics of the Greater Christchurch Economy              15
Appendix 1                                                              16
Appendix 2                                                              17
Appendix 3                                                              18

                                                             Page | 2 of 18
Post-Earthquake Price Dynamics in Christchurch/Canterbury
EXECUTIVE SUMMARY
It is recognised that some prices have noticeably changed at a local level, compared with national
averages, as a result of recovery and rebuild activity. These prices are wages in some sectors, average
house and rental prices, costs of production for business, hospitality and local retail.
This paper examines and forecasts pricing patterns in greater Christchurch using Canterbury
Development Corporation (CDC) statistical research and a workshop process with external
stakeholders.
Prices in the local economy subject to change will continue to do so during the rebuild process and in
particular will be time locked to three future points over the next six years:
The insurance funded rental market slows as claims are settled by insurers
A period of economic easing where the city is fully resourced for the peak of its rebuild activities
The rebuild economy dissipates and reattaches with the underlying economy
Understanding the position of the underlying economy will become more important as the rebuild moves
through its cycle. Estimating the value of the underlying economy and its growth rate will be critical in
monitoring its health and when the rebuild economy is mostly complete.
Following on from this research it is recommended a sensitivity analysis be completed to determine the
effect of changes under conditions such as timing of insurance settlement claims. It is also
recommended that the findings be tested with other groups before being used to inform work streams
to reduce risk for business and government.
Page | 3 of 18Post-Earthquake Price Dynamics in Christchurch/Canterbury
INTRODUCTION
Dynamic economic conditions are already present in the Canterbury economy. The leading driver of this
dynamism, the rebuild, still has some way to go. Several years prior to the earthquakes Canterbury had
started to decouple from Wellington and Auckland in broad Consumers Price Index (CPI) measures
which might be because it was later than other regions to exhibit the effects of the Global Financial
Crisis (GFC). However, the margin has amplified post-quake signalling rebuild related price inflation in
the region.
CPI Regional Broad Region - Broad Groups
Source: Statistics New Zealand
1250
1200
1150
1100
1050
1000
950
900
Auckland Wellington Canterbury
Not all local prices will be impacted during the rebuild. Some prices will be pegged to national settings
such as government wages, tobacco and petrol. It is more likely we will see movement in prices that are
determined by local factors and are unregulated (such as a local retail shop).
The table below shows CPI price change from 2006 to 2014 across three cities; Auckland, Wellington
and Christchurch. It provides an indication of which prices are likely to be more susceptible to local
drivers and those which are pegged to national prices as indicated by the degree of change relative to
the other cities.
Where the price change is similar across all three cities we assume that price is nationally influenced,
such as alcohol. Where price change is variable between cities, such as clothing and footwear, we
assume local conditions are affecting price.
Page | 4 of 18Post-Earthquake Price Dynamics in Christchurch/Canterbury
CPI Change For June 2006 To March 2014 Auckland Wellington Christchurch
Food 26% 29% 29%
Alcoholic Beverages and Tobacco 41% 40% 42%
Clothing and Footwear -4% -1% 3%
Housing and Household Utilities 30% 26% 39%
Household Contents and Services -9% 5% 6%
Health 22% 27% 25%
Transport 15% 19% 19%
Recreation and Culture -3% -4% -3%
Miscellaneous Goods and Services 21% 22% 24%
Source: Statistics New Zealand and CDC.
The data in the table above highlights price change in housing, clothing and footwear retail, housing and
household utilities, housing services and health services.
Anecdotal commentary from business suggests change in wages, insurance and business rents.
CDC hosted a stakeholder workshop where this information was discussed, along with other statistics,
with the intent of coming to a common agreement on which prices are changing rapidly and what is likely
to happen to prices in the region over the coming years.
The purpose of this paper is to synthesise the data with trends and commentary from the stakeholder
group discussion and present a position on price dynamics in Christchurch/Canterbury that can be used
to identify issues and opportunities and mitigate business and government risk associated with rapidly
changing prices.
Page | 5 of 18Post-Earthquake Price Dynamics in Christchurch/Canterbury
METHODOLOGY
CDC used a stakeholder workshop framework. Participants discussed drivers of price change and their
inter-relationships across the economy. A matrix of time verses activity in areas of the economy was
used as a platform for discussing changing prices over time.
The ‘time’ series was divided into phases. It started with the earthquakes and rebuild moving into phases
that were expected to occur over the coming years. These are described using the CDC GDP forecast
graph below:
$m, 95/96
The ‘areas’ of the economy were arranged into groups with similar characteristics. These are
described in the box below:
Area Description
Individuals Represents a single person or family
Business All business regardless of size or turnover
Macro City/Region and Civic Macroeconomic activity such as labour which cannot be attributed to
a single economic activity, regional affects and activities related to
local government
Page | 6 of 18Post-Earthquake Price Dynamics in Christchurch/Canterbury
National Economy Macroeconomic activity which cannot be identified to a single
economic activity which is constrained to New Zealand
International How the City/region is perceived as a destination for business,
travel, migration and investment
It was recognised during the process that individuals and families can be affected in different ways, for
example retired people will be affected in a different way to increasing house prices than a beneficiary
in that a retired person may more likely to stay near family where a beneficiary may be more mobile.
Workgroups were asked to complete a matrix identifying, discussing and mapping drivers of price
change in ‘areas’ of the economy over ‘time periods’.
The full group then compared and discussed their team results towards a general consensus. The final
report is a combination of the workshop findings with CDC forecasts, data and anecdotal commentary
from business.
Page | 7 of 18Post-Earthquake Price Dynamics in Christchurch/Canterbury
ECONOMIC CONTEXT
It was expected that following the rebuild boom
there would be a period of economic easing
before GDP recoupled with the underlying
economy. This has been detailed in CDC’s GDP
modelling for the Christchurch Economic
Development Strategy 2013 (refer to
‘Background Paper to the Christchurch Economic
Development Strategy’ at www.cdc.org.nz).
A conversion of the GDP projections into growth
rates highlights the city scaling up for the rebuild,
a period of easing (required scale reached)
followed by a gradual return to normal economic
activity. A projection of the underlying economy
was added from CDC modelling.
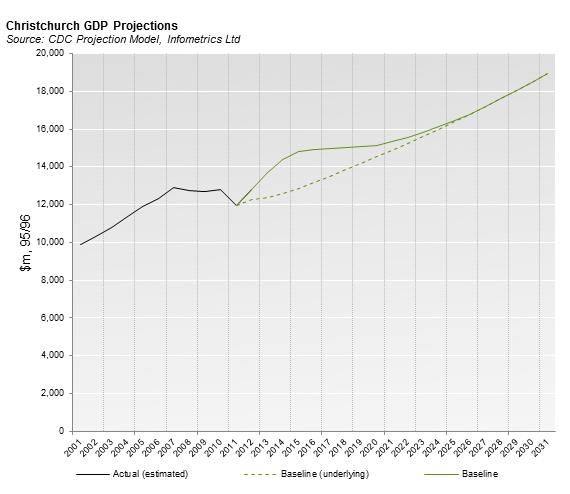
The growth rate forecast has been cross
referenced with other rebuild variables to assess
its timing validity. This includes private insurers’
forecasts, public sector works programmes, EQC
timetables and the infrastructure rebuild
programme. The variables largely align.
The growth rate peaked at 9 percent for
Christchurch City and although still strong, the
growth rate has been declining. GDP growth has
tracked almost identical to an exponential forecast
from September 2013 (immediate right). Linear
and other polynomial extrapolations were trialled
however the exponential curve was the best fit with
the trending data.
Based on these observations the economic growth
rate is forecast to be less than 2 percent in
Christchurch by 2017. Economic easing from end-
2016 is expected to last for three to four years and will see GDP growth between 0.5-2.0 percent.
Page | 8 of 18Post-Earthquake Price Dynamics in Christchurch/Canterbury
ANALYSIS AND COMMENTARY
The products and services most affected by changes in the economy at a local level are:
Wages in manufacturing, construction sectors
Housing
Rental accommodation
Cost of production for business (combination of rents, insurance)
Hospitality and local retail
WAGES
i. A high GDP growth rate is driving low unemployment
ii. Low unemployment is currently putting upwards pressure on wages
iii. Wages that are most impacted are in construction related fields, but also manufacturers who
may be trying to reduce job-hopping
iv. Wages pegged to national rates such as local government, health and education may have
some room for movement but it will be minimal and with a longer lag time
v. During the period of economic easing it is likely that inflated wages, especially in construction
related fields, will have low growth rates allowing other wages to ‘catch up’
vi. In the future it is expected that greater Christchurch will be a higher wage economy, relative
to the national average, than it was pre-quake. Average wages will still be below the New
Zealand average but a narrower gap between them
Median Sale Price
HOUSING (monthly median sale price of dwellings in 000's)
Source: Real Estate Institute of New Zealand Inc, CDC
500
vii. Increases in the cost of building
450
new homes, and land prices, is
400
placing upwards pressure on 350
house prices in general 300
viii. However average house prices 250
have not grown at the same 200
pace as the rental market 150
100
ix. The gap is closing between
50
average house prices in 0
Jan 05
Jan 06
Jan 07
Jan 08
Jan 09
Jan 10
Jan 11
Jan 12
Jan 13
Jan 14
Christchurch and the national
Jul 05
Jul 06
Jul 07
Jul 08
Jul 09
Jul 10
Jul 11
Jul 12
Jul 13
average, but it’s not expected Christchurch New Zealand
to exceed the national average
for a sustained period
Page | 9 of 18Post-Earthquake Price Dynamics in Christchurch/Canterbury
x. There is a large degree of urban sprawl occurring in the greater Christchurch area
xi. City house prices affect greater Christchurch housing prices, but a significant impact on
house prices outside of Christchurch is not expected
xii. It is expected that the pipeline of housing developments in the region will assist the supply
side of housing to ease some of the price pressure
xiii. Average house prices in Christchurch will re-couple with the New Zealand average soon
xiv. Any closing of the gap between the Christchurch average and the New Zealand average for
house prices will be lost in part during the period of economic easing between 2017 and
end-2018 where growth is forecast at about 1 percent. However house prices can be
downwards sticky and the easing period may be short enough that the price impact is very
minimal
xv. An expected future characteristic is a slightly higher average house price in relation to the
national average, but still below the national average
RENTAL ACCOMODATION
xvi. There are three key drivers of rapidly increasing rental accommodation prices:
Rental properties have been withdrawn from the market post-quake while a large
volume of short term accommodation is required to complete insurance funded
repairs and rebuilds
An insurance subsidised short term rental market
Migration and temporary workers seeking accommodation
xvii. Insurance funding for temporary rental accommodation is two to three times the norm
xviii. Rental accommodation decoupled from a history of being tightly correlated with the national
average (correlated at 0.96 for the six years pre-quake)
xix. Rental growth rates are now significantly higher than the growth rate for house prices
xx. As insurance repairs/rebuilds are settled and the need for insurance funded accommodation
comes to an end it is likely that the rental market will readjust down faster than it grew as it
is a competitive market (many players) and the purchaser is price sensitive
xxi. The need for insurance funded rental accommodation is likely to be of lower significance to
the market in 18-24 months. This is where rents will begin to move back towards normal
prices
xxii. Rental prices for houses are stereotypically a factor of return on investment against the value
of the house. In the six years prior to the quake the ratio of average rent to average house
price in Christchurch was correlated at over 0.8. Therefore, as average house price settles
it could be a good indicator of likely average rental price
xxiii. Net migration is currently well above historical rates
Page | 10 of 18Post-Earthquake Price Dynamics in Christchurch/Canterbury
xxiv. We forecast net migration to slow in 24-36 months as the economy enters the period of
economic easing. This is coincidentally timed with the slowing of insurance funded rental
accommodation
xxv. Higher numbers of traditional city dwellers (such as workers and students) will explore
renting outside of Christchurch if prices are comparable, commuting is relatively straight
forward and services are accessible. This will be occurring now, but will change as rental
prices and availability eases within the city
xxvi. The most susceptible to a readjusting rental market will be motels (as high paying insurance
funded bookings stop) and landlords outside of the city as renters gravitate closer to services
and places of work/education as prices normalise
BUSINESS COSTS
xxvii. Business cost increases are mostly a function of higher rental prices, higher insurance costs
and wage pressure
xxviii. It is likely that business have adjusted to and absorbed fixed cost increases, for example
during the Global Financial Crisis (GFC) many businesses were able to absorb challenging
cost/revenue situations
xxix. Changes in internal cost structures for business will effect export competitiveness
xxx. In the longer term the region may see some mergers and acquisitions to re-establish margins
through economies of scale, but this will probably be in small numbers
xxxi. Business costs are also sensitive to the exchange rate, which is a dynamic condition and
will impact on the price of imported materials
HOSPITALITY AND LOCAL RETAIL
xxxii. Hospitality and local retail have some autonomy with price setting, being able to increase
prices without significant threat of switching and substitution. However they are subject to
strong market conditions and competition locally
xxxiii. Tourism visitor numbers saw a decline following the recession and earthquakes. As
consumers of hospitality and retail it contributed to a contraction in the number of businesses
and employees. Visitor numbers are currently recovering.
Page | 11 of 18Post-Earthquake Price Dynamics in Christchurch/Canterbury
SUMMARY AND FINDINGS
Price uncertainty is a risk for both business and government in greater Christchurch.
CDC has gathered information and facilitated a stakeholder workshop to understand the likely price
impacts and patterns over time for the City/region and has identified that there will be a period of sudden
structural change to some prices again in the local economy.
We conclude that the likely areas of significant price change (both upwards and downwards) are wages
in some sectors, housing, rental accommodation, costs of production for business (wages, rent and
insurance), hospitality and local retail.
There will be three points in time where noticeable price change will occur in the aforementioned areas.
Those points are:
The insurance funded rental market slows as claims are settled by insurers and therefore
residential repairs and builds that have insurance funded accommodation nears completion
Economic easing in the economy as the city reaches the point where it has the resources it
requires to complete peak activity in the rebuild
The rebuild economy dissipates and the economy realigns with underlying growth and returns
to normal growth characteristic
Insurers have signalled that claims will be settled by mid-2015. This will result in the correction the two-
tiered rental market in Christchurch removing the over $1000 bracket that services short term insurance
funded accommodation whilst residential repairs and rebuilds are carried out. At the same time this
rental stock will be re-introduced into the normal rental market, easing prices with additional supply.
It is forecast that GDP growth from end-2016 to mid-2020 could be between 0.5 percent and 2 percent,
and below the national average. A challenge for investor and business confidence will be the misnomer
this conveys as it is only the rebuild economy which is slowing and contracting, the underlying economy
will continue to grow. CDC modelling suggests that the reason local GDP won’t fall into negative growth
during this period is because of the level of growth in the rest of the economy.
Page | 12 of 18Post-Earthquake Price Dynamics in Christchurch/Canterbury
The table below outlines what indicators can be used to monitor the approach of these points in time:
Event When Effect Indicators
Residential builds and End-2016 to Reduction in demand for short- Residential insurance works
repairs that have insurance mid-2017 term rental properties from completion data
funded accommodation near insurers
completion MBIE average rental stats
Reduction in average price of
rental accommodation Advertised average price
Economic easing period End-2016 to GDP growth flattens (is below the GDP data
2020 national average)
(GDP growth 0.5% – 2%) Employment/unemployment
High demand for labour reduces
as economy reaches capacity for Ease of finding skilled and
rebuild activities unskilled labour
Wage pressure eases Migration data
Migration slows CDC underlying economy
modelling
Other price pressures ease such
as housing and rental price
Economy realigns with 2020-2021 GDP growth rate starts to GDP data
underlying Growth and recouple with national average
returns to normal growth House, rent prices
levels Employment grows
Sector wage rates
Certainty of new norms for wage,
house and rental prices identified CDC underlying economy
for region modelling
The key economic impacts for consideration based on the findings of this exercise are:
Continued modelling and understanding of the
underlying economy by CDC is a critical
activity. Although the growth rate is
approximated at 2 percent or below from late-
2016 to 2020 (see graph) the underlying
economy will be growing and creating
employment. The information can be used to
ensure change is understood and maintain
business and investor confidence during the
economic easing phase
There is potential for motels to be affected.
After a period of peaks the sector will return to
business as usual as insurance funded
Page | 13 of 18Post-Earthquake Price Dynamics in Christchurch/Canterbury
accommodation comes to an end and the rental accommodation market returns to normal
conditions
During economic easing underlying growth will continue to employ labour, but there is a need
to support transition of labour from rebuild related work into other sectors such as Agriculture
and Manufacturing. This will ease pressure on unemployment and deal with a potential tail of
surplus migration
An oversupply of housing and rentals potentially leading to reducing values, but the period of
easing may be short enough that house prices don’t adjust significantly
Assumptions discussed during the stakeholder workshop were:
There is an optimism bias in business
Council rates increases capped at 6.8 percent
Rebuild timelines as at May 2014
Supply constraints do not change
That a significant number of rental bonds were re-lodged post-quake which has had an impact
on rental statistics
A recommended follow on activity from this report is a sensitivity analysis to test the impact of changes
to timeframes and changes to the above assumptions, such as dairy price fluctuations. It is also
recommended that the findings be tested with other groups before being used to inform work streams
to reduce risk for business and government.
Page | 14 of 18Post-Earthquake Price Dynamics in Christchurch/Canterbury
FUTURE CHARACTERISTICS OF THE GREATER CHRISTCHURCH ECONOMY
The workshop group were asked to consider and discuss what the potential future characteristics of the
greater Christchurch economy might be. A summary of the points discussed are provided below:
Wage, house and rental accommodation prices will be below the nation average, however the
margin between them will be closer than pre-earthquake
The reported average rent will be higher in Christchurch because:
A significant amount of resubmitted bonds post-quake will generate an average rent that
is more representative of the current price
The rental price for new houses will likely be higher, affecting the average rent statistic
The ratio of landlords to property owners may be higher. This would likely result in a lower
turnover of property and less transactions, but a wider range of rental accommodation at
competitive pricing
The residential population outside of Christchurch City that use the City for services, work and
education will be higher
The timing of the Water Management Strategy and its impact on the Agriculture and
Manufacturing sectors is seen as an important employment transition opportunity
Sector structure will be slightly different. The rebuild is driving skilled labour growth in several
sectors. As a result Christchurch could have a higher wage economy than it was pre quake
as the mix of skilled and unskilled workers will be different
The Innovation and Technology sector will grow quickly over the next 10 years
A possibility that offshore investment will come later, rather than earlier, in the rebuild. This is
based on the premise that; offshore investors will need a higher degree of confidence than
local investors, offshore investors are seeking stronger signals on the progress of public sector
projects, offshore investors may follow successful local investment and, they will prefer
stability in local economy activity
Page | 15 of 18Post-Earthquake Price Dynamics in Christchurch/Canterbury
APPENDIX 1
Workshop programme
Outline 15 mins Introductions
Current state of play and observations
Workshop process
Workshop 10 mins Timeframe Segments
Framework o Initial Response
o Start of Recovery
o Today
o Boom
o Easing
o Future Characteristics
Affected Groups
o Individuals (workers)
o Business
o International (investors/businesses)
o City/Region Civic related
o National economy
Workgroups 30 mins Workgroups are allocated parts of the matrix and their respective
timeframe/affected groups to complete a map of expected impacts
over time.
Presentations 30 mins Each group contributes to the master matrix to time, affected groups
and pricing impacts.
Discussion 45 mins After making final adjustments to the matrix a group discussion about
the cross cutting cause/effect relationships and points of interest.
Develop an understanding of how inflation may affect different groups,
in different ways at different times.
Discussion 20 mins A discussion about the future characteristics of the Christchurch
economy, will it be different or similar to pre-quake?
Page | 16 of 18Post-Earthquake Price Dynamics in Christchurch/Canterbury
APPENDIX 2
Workshop attendees:
Canterbury Development Corporation
Members of Business Mentors
New Zealand Treasury
Canterbury Employers’ Chamber of Commerce
Inland Revenue Department
Ministry of Business, Innovation and Employment
Christchurch City Council
Page | 17 of 18Post-Earthquake Price Dynamics in Christchurch/Canterbury
APPENDIX 3
Time period descriptions
Period Description
Initial Response After the two major earthquakes
Start of Recovery The establishment and implementation of key rebuild activities such
as CERA and SCRIT and demolition was underway
Today Demolition is largely complete, plans are complete and starting to be
implemented
Boom Period A period of sustained growth and migration above the average
Economic Easing The rebuild spend is coming to an end and growth rates are equal to
or below the national average
Return to normal Growth Where growth rates and other economic indicators re-couple with
national averages
Future Characteristics Differences in the economic structure of Christchurch/Canterbury
compared with pre-quake
Economic area descriptions
Area Description
Individuals Represents a single person or family
Business All business regardless of size or turnover
Macro City/Region and Civic Macroeconomic activity such as labour which cannot be attributed to
a single economic activity, regional affects and activities related to
local government
National Economy Macroeconomic activity which cannot be identified to a single
economic activity which is constrained to New Zealand
International How the City/region is perceived as a destination for business,
travel, migration and investment
Page | 18 of 18You can also read