FY21 RESULTS PRESENTATION - Open Briefing
←
→
Page content transcription
If your browser does not render page correctly, please read the page content below

UNIVERSAL STORE HOLDINGS LIMITED
ACN 169 039 721

 FY21 RESULTS
PRESENTATION

AUGUST 2021
FY21 FULL YEAR RESULTS PRESENTATION

AGENDA

PRESENTERS                                                              CONTENTS
Alice Barbery                         Renee Jones                       1.   FY21 Highlights
CEO                                   CFO
                                                                        2.   Financial Results
◼ 12 years at Universal Store         ◼ Commenced at Universal Store    3.   FY22 Priorities
                                        in 2019
◼ 30+ years’ industry experience
                                      ◼ 20+ years’ experience across
                                                                        4.   FY22 Outlook
                                        retail and service industries
                                                                        5.   Appendices

                                                                                                 2
FY21 FULL YEAR RESULTS PRESENTATION

FY21
HIGHLIGHTS

                                      1
                                          3
FY21 FULL YEAR RESULTS PRESENTATION

FY21 HIGHLIGHTS
DESPITE COVID-19 DISRUPTIONS AND MULTIPLE LOCKDOWNS UNIVERSAL STORE
CONTINUED TO DELIVER IMPRESSIVE SALES AND PROFIT GROWTH

                                                                                             3
         $210.8M                                        Underlying                                       Underlying 1                                                                      2
                                                          28.5%
                                                           EPS                                                                                                   $18.6M
          Sales                                                                                         $44.0M EBIT
                                                        LFL Sales                                                                                               Net Cash
        +36% YoY                                        41.5 cents                                       +86% YoY

                                                        +90% YoY                                                                                         Final Dividend
         +28.5%                                                                                        $24.4M NPAT
                                                       Online sales                                                                                        10.5 cents
        LFL Sales                                                                                       +90% YoY
                                                        to $25.8M                                                                                           per share

1.   Underlying EBIT excludes the impact of (i) accounting for leases under AASB16; (ii) one-off IPO transactions and MEP expenses (for FY21 only). Includes standalone public company cost incl. $0.1m of
     interest income.

                                                                                                                                                                                                             4
2.   Underlying Net Cash $18.6m vs ($4.1m) proforma net debt at 30 June 2020
3.   Based on underlying NPAT and total shares on issue at year end FY21 (73.2m)
FY21 FULL YEAR RESULTS PRESENTATION

     UNIVERSAL STORE DELIVERS RECORD RESULTS AGAIN

                  Exceptional results achieved
                  despite the ongoing COVID-19                                                                                                                                               2
                  challenges including rolling                                                           Physical Stores (#)                                        LFL Sales Growth (%)           28.5
                                                                                                                                          67
                  lockdowns, restrictions and limited                                                                     60
                                                                                                                                  65

                  opportunities for our customers to                                                              52
                  dress up                                                                                  45                                                     17
                                                                                                                                                                                     16
                                                                                                    35                                                                         14
                                                                                                                                                         13
                                                                                             31                                                                                             11
                                                                                                                                                                        10

                  Total sales $210.8m with Group
                  LFL +28.5%.
                                                                                            Jun15 Jun16 Jun17 Jun18 Jun19 Jun20 Jun21
                                                                                                                                                        FY15 FY16 FY17 FY18 FY19 FY20 FY21

                  Online sales of $25.8m (12.2% of
                  total sales).

                                                                                                                                                                                                   1
                                                                                                      Revenue (A$ million)                                    Underlying EBIT (Pre-AASB 16)
                  2 new stores opened with store                                                                                                                        (A$ million)
                                                                                                                                         210.8
                  roll out impacted by COVID-19.                                                                                                                                                  44
                                                                                                                                 154.9
                                                                                                                         146.5

                                                                                                                 112.3
                                                                                                                                                                                     24
                                                                                                          87.7                                                           21
                  Underlying EBIT of $44.0m up                                                    69.3
                                                                                           50.9                                                               14
                  +$20.4m on FY20.

                                                                                          FY15 FY16 FY17 FY18 FY19 FY20 FY21                               FY18         FY19        FY20         FY21

1.   Underlying EBIT excludes the impact of (i) accounting for leases under AASB16; (ii) one-off IPO transactions and MEP expenses (for FY21 only). Includes standalone public company cost incl. $0.1m of
     interest income.
2.   LFL sales excludes closed stores from date of closure and new stores which have traded less than 55 weeks. Stores that were closed during COVID are excluded from LFL sales growth calculation for the
     weeks that they were closed. LFL are calculated on 4/4/5 financial week.                                                                                                                                 5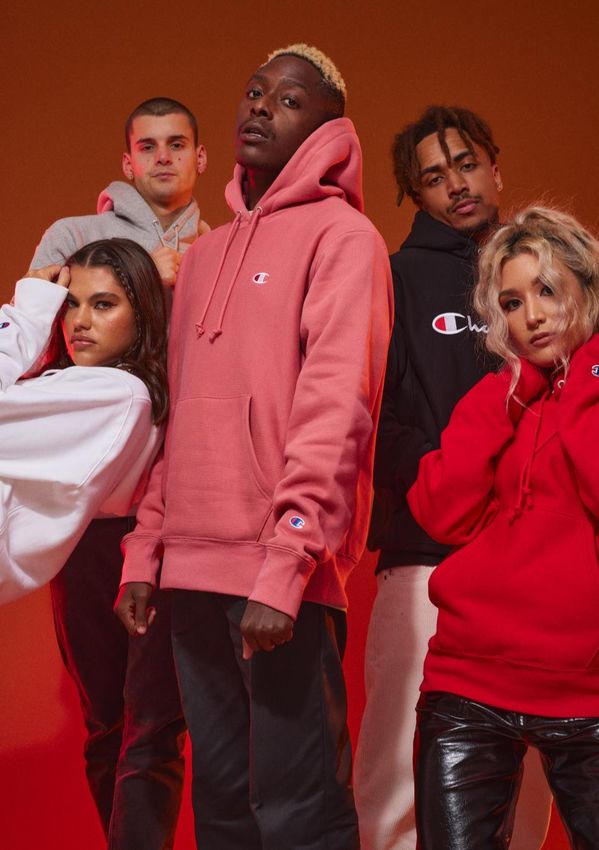
FY21 FULL YEAR RESULTS PRESENTATION

A CUSTOMER VIEW
EVENTS THAT DRIVE LIFESTYLE CHANGE ARE
COMMONLY TRIGGERS FOR FASHION PURCHASES
COVID19 DEMONSTRATED THIS AGAIN
Traditional occasions for shopping were cancelled or changed. Significant
personal milestones (e.g. 21st birthday events) often missed, down scaled and
localised
Holidays cancelled, and lives adjusted to a smaller footprint. School, university,
and work shifted to the home environment
Females spending was initially more resilient, quicker to adapt to new
occasions, and sought more ’day wear’ and other casual apparel options
Work from home (‘WFH’) has accelerated the trend of workplace attire
‘casualisation’
The shift from going to clubs and other ‘dressy’ occasions and associated
venues to gatherings at homes or the beach/park have increased demand for
more casual apparel
Job Keeper and other government payments have supported the incomes of
many customers, and personal spending priorities have been re-allocated (e.g.
no travel, concerts)
Pivoting shopping behaviours to online and back to stores on an iterative basis
Our ‘close to market’, and ‘micro allocation’ processes, together with supplier
relationships and hustle enabled our product team to respond by re-phasing and
recalibrating product mix
Our store teams have responded swiftly to support our customer with ship from
store, operating in dark stores and offering Click and Collect

                                                                                     6
FY21 FULL YEAR RESULTS PRESENTATION

FINANCIAL
RESULTS

                                      2
                                          7
FY21 FULL YEAR RESULTS PRESENTATION

PROFIT & LOSS

STRONG SALES PERFORMANCE                                           Underlying Results                        FY21             FY20            % Change

 •   Sales $210.8m, up +$55.9m or 36.1% on FY20                    Sales                                     210.8            154.9                 36.1%
                               2
 •   Overall Group LFL +28.5%
                                                                   Gross Profit                              123.9              87.6                41.4%
 •   Stores sales up +30.9%, with LFL +21.8%
 •   Online sales $25.8m, representing 12.2% of total              % Sales                                  58.7%            56.6%                  2.1ppt
 •   Online channel up +90.3%
                                                                   CODB                                      (75.2)           (60.3)                24.7%
MATERIAL GROSS MARGIN PROFIT IMPROVEMENT                           % Sales                                (35.7%)           (38.9%)                 3.2ppt

 •   Significant step change in GM, up 210bps                                               1
                                                                   Underlying EBITDA                           48.7             27.3                78.4%
 •   Customer led continued mix shift towards private brand
 •   Expansion in men’s private brand offer                        Depreciation                               (4.7)            (3.6)                30.5%
 •   Direct sourcing of women's categories progressed              Underlying EBIT
                                                                                        1
                                                                                                               44.0             23.7                85.7%
                                                                   % Sales                                  20.9%            15.3%                  5.6ppt
 CODB
 • 35.7% an improvement of 320bps on FY20                                     3
 • $1.4m rent concession received                                  Interest                                   (0.6)            (0.6)                  0.0%
 • No net benefit from Job Keeper subsidies in FY21                Tax                                       (13.0)            (6.9)                88.4%
                                                                   Underlying NPAT                             30.4             16.2                87.7%
 EXCEPTIONAL EARNINGS GROWTH
                                                                   % Sales                                  14.4%            10.5%                  3.9ppt
 • Underling EBIT $44.0m up $20.4m on prior year
 • Underlying EBIT margin of 20.9%                            1.     Underlying EBIT/EBITDA excludes the impact of (i) accounting for leases under AASB16; (ii)
                                                                     one-off IPO transactions and MEP expenses (for FY21 only). Includes standalone public
 • Underlying EPS of 41.5 cents compared to 22.1 cents               company cost incl. $0.1m of interest income.
   FY20 4                                                     2.     LFL sales excludes closed stores from date of closure and stores which have traded less
                                                                     than 55 weeks. Stores that were temporarily closed are excluded from LFL sales growth
                                                                     calculation for the weeks that they were closed and and the pcp.. LFL are calculated on
                                                                     4/4/5 financial week basis.

                                                              3.     Underlying interest based on post IPO balance sheet.

                                                              4.     Based on underlying NPAT and total shares on issue at year end FY21 (73.2m).

                                                                                                                                                                  8
FY21 FULL YEAR RESULTS PRESENTATION

  SALES PERFORMANCE

                                                                                         Total Sales growth of 36.1%,
                                                                              CAGR       strong online and store
                                                                                         performance despite impacts of
  FY18–FY21 SALES                                                          (FY18-FY21)
                                                                               23%       COVID-19 pandemic
220.0

210.0
                                                                   210.8
200.0
                                                                              72%        Group LFL sales growth of
190.0                                                              25.8                  28.5%, with first half growth of
180.0

170.0
                                                                                         26.5% and second half growth
160.0                                                      154.9                         of 31.7%
150.0                              146.5                    13.6
140.0                               8.5
130.0                                                                         20%        Stores sales growth of 30.9%.
120.0
             112.3                                                                       Which also included 13 week
110.0         5.1                                                                        lockdown in 13 Victorian stores
100.0

 90.0
                                                                                         H1 FY21
 80.0

 70.0
             107.2                 137.9                   141.3   185.0
 60.0                                                                                    Online growth of 90.3%
             FY18                  FY19                    FY20    FY21                  Growth driven by ongoing
                                                                                         investment in online channel
                                           B&M   Online   Total
                                                                                         including the launch of ship from
                                                                                         store, along with click & collect
                                                                                         and ongoing website
                                                                                         optimisations initiatives

                                                                                                                             9
FY21 FULL YEAR RESULTS PRESENTATION

  UNLOCKING OUR
  ONLINE POTENTIAL
        Universal Store’s online channel had a transformative year. It continues to enjoy attractive
        contribution margins and unit order economics, which have strengthened further since the
                     launch of ship from store which commenced rollout in May 2020.

                                +87%                                         +29%                                                      $107
                                Growth in Online                                                                                       average basket size of online
                                                                             Growth in conversion from 1.3%
                                Transactions vs FY20                                                                                   store FY21
                                                                             FY20 to 1.7% FY21
                                                                                                                                       (Compared to $90 ATV in store)

           KEY INVESTMENT NOW IN PLACE TO                                                             ONLINE SALES (A$ MILLION)
                 ACCELERATE GROWTH
                                                                                   % of total         3.5%      4.3%    4.5%    5.8%     8.8%     12.2%

                      Website                                                          30.0
                   Re-platforming                                                                                                                 25.8
                    (Completed)                          Ship from                     25.0
                                                           Store
                                                        (Completed)
                                                                                       20.0

                                                                                       15.0                                              13.6
                               Unlocking
Single Customer                                                                        10.0                                    8.5
                                 omni-                           Click and
View (Continuous
  improvement)                  channel                           Collect                                              5.1
                                                               (Completed)              5.0
                                                                                                             3.8
                                                                                                2.4
                               potential
                                                                                        0.0

                                                                                                FY16         FY17      FY18    FY19     FY20      FY21

                                                       Store to Door
                   Personalisation                       (In plan)
                     (Continuous
                    Improvement)

                                                                                                                                                                        10
FY21 FULL YEAR RESULTS PRESENTATION
GROSS MARGIN
SIGNIFICANT STEP CHANGE PRIVATE BRAND % OF TOTAL SALES
IN GROSS MARGIN UP 210 BPS
40.2%
29.0% 30.3%
Strong private brand demand resulted in contribution 24.6%
growing 30.3% to 40.2% of total in FY21.
Customer demand and speed to market supported FY18 FY19 FY20 FY21
growth in both women and men sales. Women’s growth was
strongest with “Perfect Stranger” outperforming all other
brands. DIRECT SOURCING
(% OF PB SALES)
FY20 18% FY21
37%
Direct sourcing of private brand product shifted from 18% in
FY20 to 37% in FY21. The shift from “indirect” to “direct”
sourcing typically adds approximately 5-7% to gross margin
63%
on relevant items. 82%
The shift in sourcing is driven by womenswear, while
menswear maintained its predominantly direct sourcing mix. GP $ & % TREND
$m 140 60.0 %
120 59.0
100 58.7 58.0
Improvement largely driven by customer-led mix shift 80 57.0
towards expansion of our private brand in under-penetrated 60 56.8 56.0
56.6
categories, and accelerating direct sourcing in women’s 40 55.8 55.0
private brand range. 20 54.0
0 53.0
FY18 FY19 FY20 FY21
11FY21 FULL YEAR RESULTS PRESENTATION
COSTS OF DOING BUSINESS
UNDERLYING CODB$ INCREASED TO SUPPORT SALES GROWTH
AND INCLUDES PARTIAL NORMALISATION OF FY20 LEVELS
WHICH WERE SUPPRESSED AS A RESULT OF COVID-19 Total CODB % was 35.6%, a
270 BPS improvement on prior
year
41.8% sales 40.2% sales 38.9% sales 35.7% sales
Team costs increased to
$75.2m 18.7% driven by investment
into key support office roles to
4.0% allow us to scale and support
future growth initiatives
$59.0m $60.3m
FY20 included $3.2m Job
3.8% 4.5% Keeper benefits supporting
earnings due to 6 week
$47.0m
national lockdown in Q4
3.7%
Occupancy costs at 13.0%
21.0% 20.8% 18.4% 18.7% includes rent concessions
$1.4m in FY21, 2 new stores
and 2 relocations
Other support costs
increased on prior year driven
17.1% 15.6% 16.0% 13.0% by a higher marketing spend
and governance costs post
listings
FY18 FY19 FY20 FY21
Occupancy Team Other
1. Underlying EBIT excludes the impact of (i) accounting for leases under AASB16; (ii) one-off IPO transactions and MEP expenses for FY21.
2. FY18-FY20 financials includes the Underlying costs associated with public listing
12FY21 FULL YEAR RESULTS PRESENTATION
BALANCE SHEET
(A$ million)
1
STATUTORY BALANCE SHEET FY21 Underlying FY20
FY20
Total Current assets 53.5 27.6 58.6
Net Cash $18.6m an
Cash 33.4 10.8 41.8
improvement of $22.7m on
Trade Receivables 2.4 3.0 3.0
underlying FY20 due to strong
Inventories 17.7 13.7 13.7
cash generation
Total Non current assets 150.7 164.1 164.0
Property, plant and equipment 9.2 11.2 11.0
Right of use assets 48.8 60.3 60.3 Inventory at $17.7m has
Intangible assets 92.7 92.6 92.7 normalised vs prior year which
Total Assets 204.2 191.7 222.6 was abnormally low due to
COVID-19 and associated
Total Current liabilities 44.1 38.8 40.3 disruptions
Trade and other payables 17.0 15.5 15.8
Borrowings 0 0 1.0
Lease liabilities 19.2 18.3 18.3 Underlying cash
Other current liabilities 8.0 5.0 5.2 flow of $32.5m generated
Total non-current liabilities 57.2 67.5 105.8
Borrowings 14.8 14.9 50.6
Lease liabilities 35.8 46.4 46.4 Capex of $2.9m driven primarily
Other non current liabilities 6.2 6.2 8.9 by investments into online and
Total Liabilities 101.2 106.3 146.1 new stores/relocations.
Net assets 103.0 85.4 76.5
Net Cash/ (Net Debt) 18.6 (12.2) 2 NA
10.5 cents fully franked
1. Underlying Balance Sheet from Prospectus
final dividend to be paid
2. Represent Underlying net debt (pre AASB 16) at 30 June 2020 (gross of capitalized borrowing costs) adjusted by $8million (mid- 29th Sept 2021
point $7-9million) which the Directors believe represents the level of under investment in net working capital at 30 June 2020
relative to typical levels at the balance sheet date. .
13FY21 FULL YEAR RESULTS PRESENTATION
UNDERLYING CASHFLOW
(A$ million) The normalized cashflow presented
removes the ‘noise’ arising from the IPO
FY21 FY20 Change and pre-IPO capital structure
Underlying EBITDA 48.7 27.3 20.5
Strong cashflow delivered again in FY21
with high levels of EBITDA cash
Change in inventories (4.0) 5.7 (9.7) conversion
Change in trade payables 1.2 7.1 (4.3)
Change in other working capital items 2.9 0 1.1
Increase in inventory levels driven partly
Cashflow from operations (before int, tax, capex) 48.8 40.1 7.5
by normalization from abnormally low
stock levels at the end of FY20 arising
Net Capex (2.9) (4.2) 1.3
1 from cash preservation actions
Underlying interest (post IPO drawn debt) (0.6) (0.6)
2
Underlying tax cash paid (12.8) (5.7) (5.9)
Underlying operating cashflow, after capex 32.5 29.6 3.0 Trade payables reflect the net impact of
normalization post FY20 (per inventory
Dividends paid post IPO (3.7) NA drivers), and the benefit of attractive
Other cash flows and proforma adjustments related to (6.2) NA trading terms as we have increased
tax payments, interest, the IPO, capital re-org, & MEP
purchases to accommodate our growth
Underlying net cash generated 22.7 29.6
3 Capex is lower than FY20 and our
Net cash/(net debt) 18.6 (4.1) 22.7
current depreciation expense due to
slower rate of store roll out
Cashflow Ratios
Cashflow from Ops : EBITDA conversions % 100% 147%
Capex : Depreciation % 62% 117%
Net cash at end of FY21 of $18.6m puts
us in a strong position to manage
trading disruptions and support growth
strategy
Notes
1. Underlying interest assumes $14.8m of drawn debt at ~4% p.a interest rate
2. Tax paid in year adjusted for 30% tax paid on underlying adjustment
3. Underlying net debt at FY20 as per Prospectus Underlying Net Debt (refer page 92 Prospectus)
14FY21 FULL YEAR RESULTS PRESENTATION
FY22 GROUP
PRIORITIES
3
15FY21 FULL YEAR RESULTS PRESENTATION
FY22 GROUP PRIORITIES
WE WILL CONTINUE TO EXECUTE ON OUR STRATEGIC PRIORITIES AND MANAGE FOR THE
UNIQUE AND VOLATILE TRADING ENVIRONMENT
NEW STORE ROLLOUT OPTIMISE PRODUCT MIX
1 • 7–10 stores planned for FY22 4 • Continue brand and range curation, injecting fresh new
product and brands into our offer
• “Full Potential” target is 100+ stores across Australia/
New Zealand • Maintain our customer led and complimentary private brand
• Standalone Perfect Stranger concept progressing to strategy
next phase of trial stage • Progress direct sourcing shift to further improve margins
SUSTAINABILITY
STORE MATURATION
2 • Continue to grow market share through superior
customer service, inspirational stores and strongly
5 • Increase our investment in expertise and resources
• Making conscious fibre choices
curated product brands. • Seek opportunities to improve working conditions for
workers in the supply chain and ensuring ethical practices
• Continue to build brand awareness in are the norm, not the exception.
underpenetrated markets
• Model better practices to create the change we want to see
ONLINE GROWTH PRODUCTIVITY
3 • Continue to scale up our digital and
eCom capacity and services
6 • Continue caring for our team & ensure Covid-safe
workplaces
• Improve speed and delivery options • Implement WMS into our Distribution Centre
• Launch Standalone Perfect Stranger website • Relocate our DC and Office Q1 FY23
• Execute on our IT roadmap
16FY21 FULL YEAR RESULTS PRESENTATION
UNIVERSAL STORE’S OMNI-CHANNEL MODEL
Universal Stores’ growth is powered by a channel agnostic business model leveraging a single retail brand, infrastructure,
and team to support its online and store channels. This model drives cost effective customer acquisition and retention,
efficient and scalable operations, attractive EBIT margins AND a preferred customer experience.
Online Channel Sales ($m) Physical Store Channel Sales ($m)
30 200
25
20 150
15
10 100
5
0 50
Brand Distribution Product & Team
2018 2019 2020 2021 2018 2019 2020 2021
design
Universal Store’s customers browse and transact across our channels on a fluid basis. We support our
channels with one brand and common infrastructure, marketing and group capabilities, giving us cost
efficiencies and economies of scale
Our ‘cross channel’ assets, functions and capabilities include:
✓ Brand & marketing ✓ Inventory
✓ Distribution facilities ✓ Social media
✓ Product & design team ✓ Management, finance, governance
✓ Customer database ✓ Website
✓ Store network and team
17FY21 FULL YEAR RESULTS PRESENTATION
FY22
OUTLOOK
4
18FY21 FULL YEAR RESULTS PRESENTATION
FY22 OUTLOOK
OUR SALES RESULTS ONLINE AND IN “OPEN MARKETS” GIVE US CONFIDENCE THAT OUR
CUSTOMERS HAS BOTH THE CAPACITY AND APPETITE TO SHOP WHEN CIRCUMSTANCES PERMIT
In the first 8 weeks of FY22 (‘YTD FY22’) total sales were down
20.7% versus YTD FY21, a shortfall of $6.0m in dollar terms.
Across this period;
• Approximately 36% of potential ‘store trading days’ have been
lost due to store closures
• Group LFL sales (incl online)1 are down 0.4%. We are cycling
YTD FY21 LFL of +24.5%
• Online sales are up +42.5% versus YTD FY21,
and up +184% versus YTD FY20
We are managing our costs carefully in markets where stores are
closed.
Our inventory is well balanced and we are ready to trade all stores
when possible.
Historically, sales have bounced back strongly post a lockdown as
evidenced by our sales growth in FY21 of +36%, notwithstanding
19 lockdowns since March 2020.
7 new stores are expected to open prior to Christmas FY22, and
~10 across FY22.
Given the uncertainty regarding trade restrictions and potential for
ongoing lockdowns, we do not consider it appropriate to provide
FY22 guidance at this time.
1. LFL sales excludes closed stores from date of closure and new stores which have traded less than 55 weeks. Stores that were closed during COVID are excluded from LFL sales growth calculation for the weeks that they were closed. LFL
are calculated on 4/4/5 financial week.
19FY21 FULL YEAR RESULTS PRESENTATION
APPENDIX
5
20FY21 full year results presentation
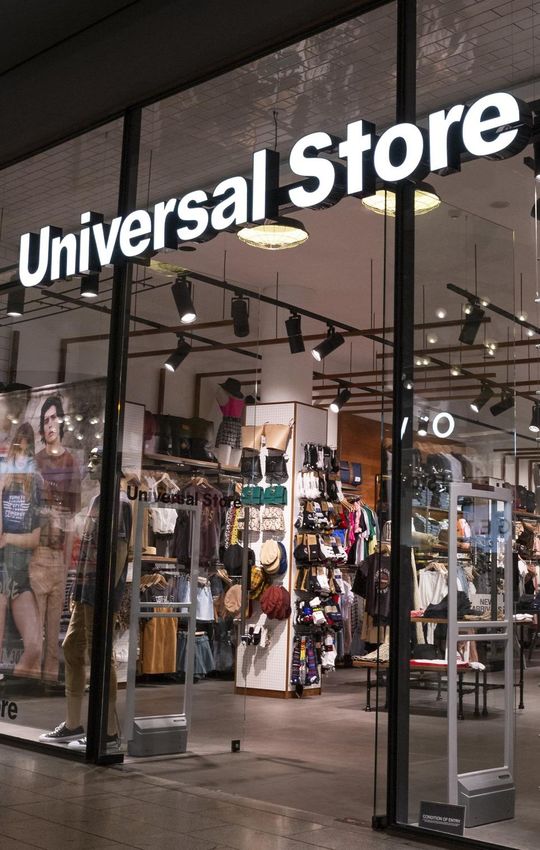
APPENDIX 1: UNIVERSAL STORE - OVERVIEW
A leading Australian youth-focused apparel retailer with customer service at its core
Who is Universal Store? Who is our quintessential customer?
Omni-channel retailer Millennials and Gen Z Fashion focused
(16-35 year old) (and buy now preference)
Casual youth fashion apparel
~57% women, ~36% men, Late education or early adult
~7% unisex1 phase of life
68 stores around Australia (including online)
Digital natives Socially active
Curated domestic, international and private brand collections
Sub-culture ‘fluid’ Occasion and event driven
High service, friendly experience
Some implications about our customers….
Relatively few financial commitments or long term savings goals
High proportion of income is "disposable"
Shop across multiple brands seeking what’s new
Buy now pay later products and parents support spending capacity
Most active customers seek outfits to fit in or stand out
1. Based on FY21 revenue only, excluding ticket sales and other adjustments.
21FY21 FULL YEAR RESULTS PRESENTATION
APPENDIX 2: FY21 COVID-19
IMPACTS RECAP
UNIVERSAL STORE DELIVERED
STRONG GROWTH IN A CHALLENGING
OPERATING ENVIRONMENT.
• 19 lockdowns across all states resulting in store closures from
2 days to 84 days in duration since March 2020 to date.
• The 84 day lockdown in Victoria (5th August to 27th October)
resulted in a $6.2m revenue impact (compared to FY20
physical store sales), partially offset with increases in our
online channel. Other lockdowns from affected stores had less
severe implications and most stores rebounded once doors
reopened.
• State by state impacts are different and volatile.
• Due to lockdowns and restricted trade we reduced our CODB
in areas including store wages, travel, marketing and
negotiated $1.4m rent concessions recognized in FY21.
• We have not retained any net benefit from Job Keeper
subsidies in FY21. This amount was repaid to the ATO.
• COVID-safe ways of working is the “new normal” and
supporting our team members through lockdown periods
remains priority.
• Our store roll out was temporarily slowed due to the pandemic.
2 new stores opened and 2 stores were relocated to larger
footprints.
• Customers changed spending patterns and sought apparel
appropriate for changed lifestyles. Personal budgets re-
allocated away from travel, experiences and out of home
entertainment.
22FY21 full year results presentation
APPENDIX 3: UNDERLYING PROFIT & LOSS STATEMENT
$m Notes FY18 FY19 FY20 FY21
Physical store revenue 107.2 137.9 141.3 185.0
% growth 28.7% 2.5% 30.9%
Online revenue 5.1 8.5 13.6 25.8
% growth 66.7% 60.0% 90.3%
Revenue 112.3 146.5 154.9 210.8
% growth 28.1% 30.5% 5.7% 36.1%
Cost of sales (49.6) (63.3) (67.3) (87.0)
Gross profit 62.7 83.2 87.6 123.9
% margin 55.8% 56.8% 56.6% 58.7%
Employee costs (23.6) (30.5) (28.5) (39.5)
Occupancy costs (19.2) (22.9) (24.9) (27.3)
General and admin costs 2 (4.2) (5.6) (6.9) (8.4)
Underlying EBITDA 1 15.7 24.2 27.3 48.7
% growth 51.5% 11.9% 78.4%
% margin 14.0% 16.5% 17.6% 23.1%
Depreciation (2.2) (3.0) (3.7) (4.7)
Underlying EBIT 1 13.5 21.2 23.7 44.0
% growth 54.9% 10.3% 85.7%
% margin 12.0% 14.5% 15.3% 20.9%
1. Underlying EBIT excludes the impact of (i) accounting for leases under AASB16; (ii) one-off IPO transactions and MEP expenses and VLN repayment discount.
2. FY18-FY20 financials includes the pro-forma costs associated with publicly listing in G&A
23FY21 FULL YEAR RESULTS PRESENTATION
APPENDIX 4: P&L UNDERLYING TO STATUTORY RECONCILIATION
$m Note FY21 FY20
1. Transaction costs relate to legal, advisors
Statutory EBITDA 61.9 46.6 and accounting costs incurred with
respect to the preparation of the IPO.
Transaction costs 1 6.7 0.7
2. Incremental public company cost primarily
Incremental public company costs 2 (0.1) (0.8) relate to additional Directors’ fee,
Directors’ and officers’ insurance costs
MEP Expense 3 0.6 0.0 and compliance costs which Universal
Interest income 4 0.1 0.0 Store expects to incur as a listed
company.
Make good expense 4 (0.1) (0.1) 3. MEP expense relates to employee share
AASB 16 adjustments 5 (20.4) (19.1) based expenses, which were not material
in FY20 Underlying.
Underlying EBITDA 48.7 27.3
4. Minor mapping adjustments to align to
prospectus.
Statutory EBIT 38.0 24.5 5. AASB 16 adjustments relate
Transaction costs 1 6.7 0.7 to the restatement of statutory results onto
the previous lease accounting standard.
Incremental public company costs 2 (0.1) (0.8) This removes depreciation of lease assets
and interest on lease liabilities and
MEP Expense 3 0.6 0.0
replaces them with occupancy costs.
Interest income 4 0.1 0.0 6. VLN discount refers to the discount
AASB 16 adjustments 5 received for the early repayment of a
(1.3) (0.8)
Vendor Loan Note prior to the IPO.
Underlying EBIT 44.0 23.7
Statutory NPAT 24.4 12.8
Transaction costs 1 4.7 0.5
Incremental public company costs 2 (0.1) (0.5)
MEP Expense 3 0.6 0.0
AASB 16 adjustments 5 0.7 1.3
VLN Discount 6 (0.5) 0.0
Net finance cost 0.6 2.1
Underlying NPAT 30.4 16.2
24FY21 FULL YEAR RESULTS PRESENTATION
APPENDIX 5: CASH FLOW UNDERLYING TO STATUTORY RECONCILIATION
$m Note FY21 FY20
1. Incremental public company cost
EBITDA 61.9 46.6 primarily relate to additional Directors’
Non-cash items in EBITDA: fee, Directors’ and officers’ insurance
costs and compliance costs which
MEP Expense 3 0.6 0.2 Universal Store expects to incur as a
listed company.
Loss on disposal of assets 0.1 0.0
2. Transaction costs relate to legal,
Change in net working capital (0.9) 11.2 advisors and accounting costs
incurred with respect to the
Operating Cash flow before interest and income tax 61.7 58.0
preparation of the IPO.
Net Capital Expenditure (2.9) (4.2) 3. MEP expense relates to employee
Free cash flow before financing, tax and dividends 58.7 53.8 share based expenses, which were
not material in FY20 Underlying.
4. Minor mapping adjustments to align to
Underlying adjustments prospectus.
Incremental public company costs 1 (0.1) (0.8) 5. AASB 16 adjustments relate
to the restatement of statutory results
Interest income 4 0.1 0.0
onto the previous lease accounting
Transaction costs 2 6.7 0.7 standard. This removes depreciation
of lease assets and interest on lease
AASB16 adjustments 5 (19.6) (17.7) liabilities and replaces them with
Underlying free cashflow before financing, tax and occupancy costs.
45.9 36.0
dividends
Statutory net cashflow (8.4) 31.0
Incremental public company costs (0.1) (0.8)
Transaction costs 2 6.7 0.7
Change in interest and tax (1.4) 1.7
Net cashflows used in financing activities (excl.AASB16) 35.7 (3.1)
Underlying net cashflow before dividend 32.5 29.5
25FY21 FULL YEAR RESULTS PRESENTATION
APPENDIX 6: STORE FOOTPRINT
TOTAL STORE
67
NT
1 QLD
20
WA
11
2
SA
NSW
18
ACT
2
VIC
13
26FY21 FULL YEAR RESULTS PRESENTATION
DISCLAIMER
The material contained in this This presentation may contain forward- To the extent permitted by law,
presentation has been prepared by looking statements with respect to the no responsibility for any loss arising
Universal Store Holdings Limited ABN 94 operations and businesses of the in any way (including by way of
628 836 484 (Universal Store) and is Universal Store. The assumptions negligence) from anyone acting or
general background information about the underlying these forward-looking refraining from acting as a result of the
businesses, operations and activities of statements involve circumstances and material contained in this presentation
Universal Store and its subsidiaries, events that have not yet taken place and is accepted by Universal Store.
current as at the date of this presentation. which are subject to uncertainty and
The information is provided in summary contingencies outside Universal Store’s
form only and does not purport to be control. Readers are cautioned not to
complete or comprehensive. The place undue reliance on any forward-
information in this presentation should not looking statements. Universal Store does
be considered as advice or a not undertake any obligation to publicly
recommendation for investment purposes, release the result of any revisions to
as it does not take into account your forward-looking statements in this
particular investment objectives, financial presentation or to otherwise update
position or needs. These factors should be forward-looking statements, whether as
considered, with or without independent a result of new information, future events,
professional advice, when deciding if an or otherwise, after the date of this
investment is appropriate. presentation. Past performance is not a
reliable indication of future performance.
27FY21 FULL YEAR RESULTS PRESENTATION
UNIVERSAL SPIRIT
The unique ability to create memorable and
positive experiences for all. Creating an experience
that is fun, open and based on kindness.
The environment that enables a person to be their best.
28You can also read