Sugar Overload: Retail Checkout Promotes Obesity - October 2014
←
→
Page content transcription
If your browser does not render page correctly, please read the page content below

Sugar Overload:
Retail Checkout Promotes Obesity

            October 2014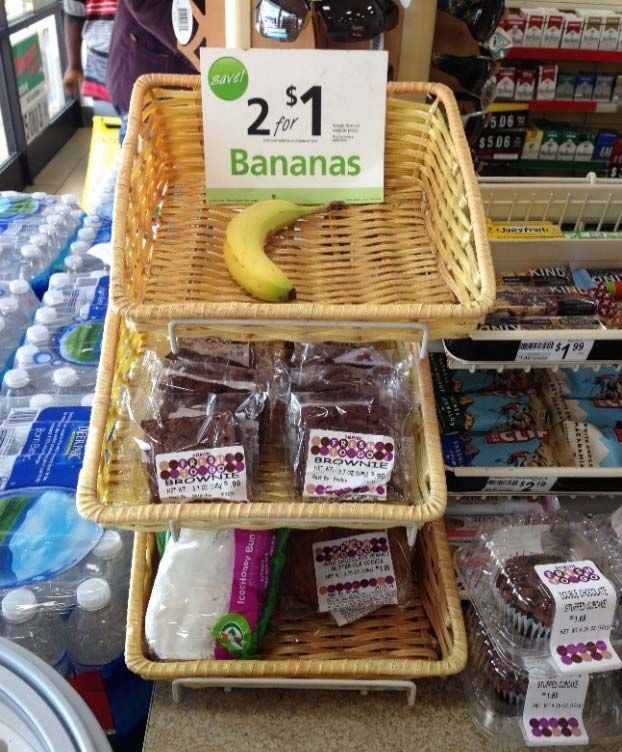
Report written by Priya Fielding‐Singh, M.A., Jessica Almy, J.D., M.S.,
                                Margo G. Wootan, D.Sc.
                     Center for Science in the Public Interest (CSPI)

                            CSPI and the Nutrition Policy Project
The Center for Science in the Public Interest (CSPI) is a nonprofit organization based in
Washington, D.C. CSPI has been improving the public’s health through its work on
nutrition and food safety since 1971. CSPI is supported primarily by the 900,000
subscribers to its Nutrition Action Healthletter and philanthropic foundations. CSPI’s
Nutrition Policy Project works with concerned citizens, health professionals, government
officials, and other nonprofit organizations to strengthen national, state, and local
policies and programs to promote healthy eating and reduce obesity. We aim to help
reduce the illnesses, disabilities, and deaths caused by diet‐ and obesity‐related diseases
and conditions, such as heart disease, cancer, high blood pressure, and diabetes.

                                          October 2014

                               For more information contact:
                       Center for Science in the Public Interest (CSPI)
                                nutritionpolicy@cspinet.org
                                        202‐777‐8352

                    Sugar Overload: Retail Checkout Promotes Obesity
                           is available online, free of charge at
                           www.cspinet.org/sugaroverload.pdf

         The cover photo was taken at a checkout aisle at a Target store in Washington, D.C.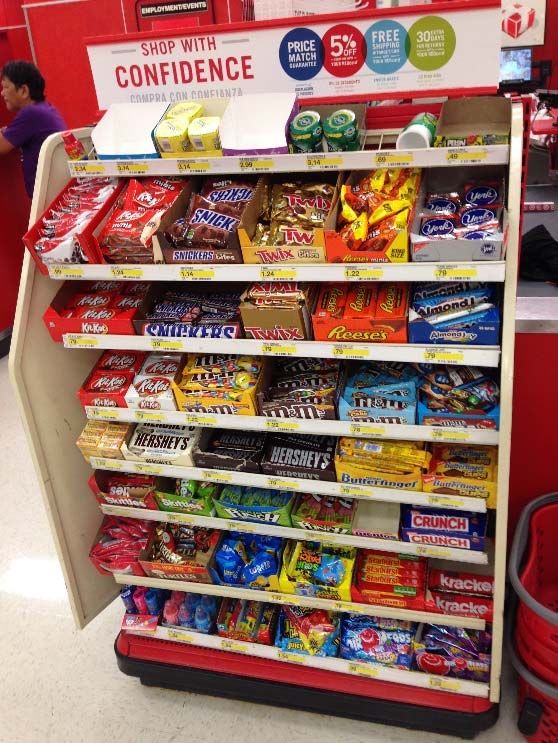
Background

Each year, food and other retailers, and food and beverage manufacturers, spend
billions of dollars on in‐store marketing. The checkout line, where every shopper must
wait on the way to the register, offers a prime location to induce additional purchases
and impulse buys (see Figure 1).

Marketing at checkout may be profitable for         Figure 1. Checkout Aisle at Safeway
industry, but it also contributes to the enormous
public health burden caused by obesity and poor
nutrition.

Two‐thirds of adults and one‐third of children in
the United States are overweight or obese.1,2,3
A mounting body of research identifies the
widespread availability of snack foods as a
contributor to the obesity epidemic. The ubiquity
of snacks provides frequent opportunities to eat
and powerful cues that stimulate feelings of
hunger.4

Food availability has an influence on what and
how much people eat.5 Experimental trials
demonstrate that snack food consumption
increases when foods are put within arm’s reach
or are simply visible.6

The presence of snack foods near the register increases the likelihood that people will
purchase those foods.7 Additionally, sales of food items change significantly in response
to changes in how much shelf space they are allotted.8

Calories consumed through impulse purchases of candy, soda, and other snack foods
can increase a person’s total calorie intake and contribute to weight gain. People given
snacks between meals do not always offset this consumption by eating fewer calories at
later meals.9 National dietary surveys reveal that total calorie consumption increases
with the number of daily eating occasions.10

Most Americans cannot afford to be consuming the additional calories marketed to
them at checkout, especially when these calories provide little nutritional value. Candy,
snack cakes and other grain‐based desserts, and potato chips and other fried potatoes
are among the top 25 sources of calories in the American diet. 11 Soda and other sugar‐
sweetened beverages are the biggest single source of calories for both adults and
children and are directly linked to weight gain and obesity.12

                                            1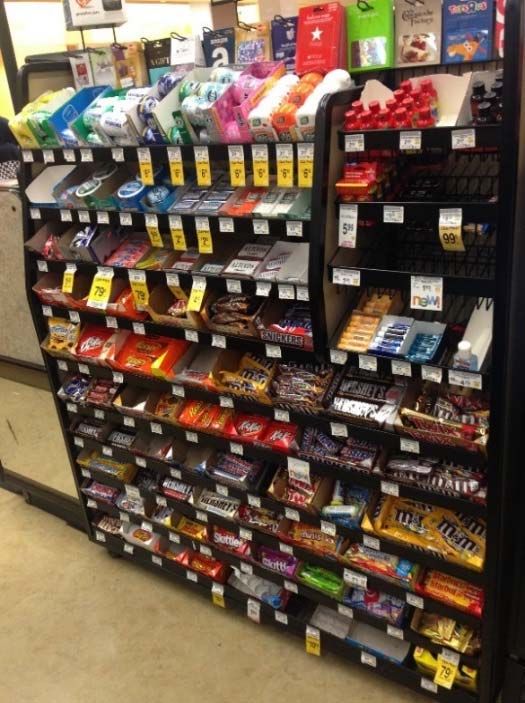
Few studies have examined food and beverages at checkout. 13,14,15,16 Each looked at
checkout only in a particular category of stores, such as food stores, convenience stores,
or non‐food stores. None recorded the presence of non‐food merchandise at checkout.

This study investigates checkout aisles across a range of store types in one metropolitan
area to assess the prevalence of food sold at checkout, the categories of food and
beverages offered, and the presence of non‐food merchandise at checkout.

Methodology

In July 2014, CSPI conducted a field study of checkout aisles in the Washington, D.C.,
metropolitan area. To determine the prevalence of foods and beverages at different
kinds of stores, we assessed 30 retail stores across 14 categories and compared stores
where people traditionally shop for food with outlets that are not primarily food stores.
Food stores included 5 grocery stores, 3 supercenters, and 1 convenience store. Non‐
food stores included 3 drug stores, 2 gas stations, 2 dollar stores, 2 office supply stores,
1 home and bath store, 2 clothing stores, 2 electronics stores, 2 sporting goods stores, 2
home improvement and hardware stores, 2 bookstores, and 1 toy store (see Appendix
A). We selected popular chain stores and chose outlets throughout the city with a range
of neighborhood demographics; stores were not randomly selected. For 3 store types,
we assessed a store in a nearby suburb because no chains were located within city
limits.

We visited each store during regular business hours and used a standardized instrument
to record the presence or absence of food, beverage, and non‐food merchandise at a
sample of checkout aisles in each store (see Appendix B). We assessed 41 aisles overall.
In every store, we assessed a standard checkout. In stores that offered express, self, or
“healthy” or family‐friendly checkouts, we additionally assessed an aisle of each type
offered in the store. Because the products promoted at checkout are relatively uniform
among the same kinds of aisles of the same store—for example, all of the express aisles
in a Safeway grocery store offer roughly the same product assortment—for each store
we assessed one aisle of each type offered.

For stores that had individual queues for each register, checkout was defined as
encompassing the end cap or cooler closely associated with the aisle, the aisle itself, the
area over the belt, and bins and displays within one pace (approximately 30 inches) of
the aisle. For stores that had one queue for more than one register, checkout was
defined as including all belted areas or areas where people wait in line, the end cap or
cooler attached to one aisle, the aisle itself, the area over the belt, and bins within one
pace of the area in which people wait in line.

                                             2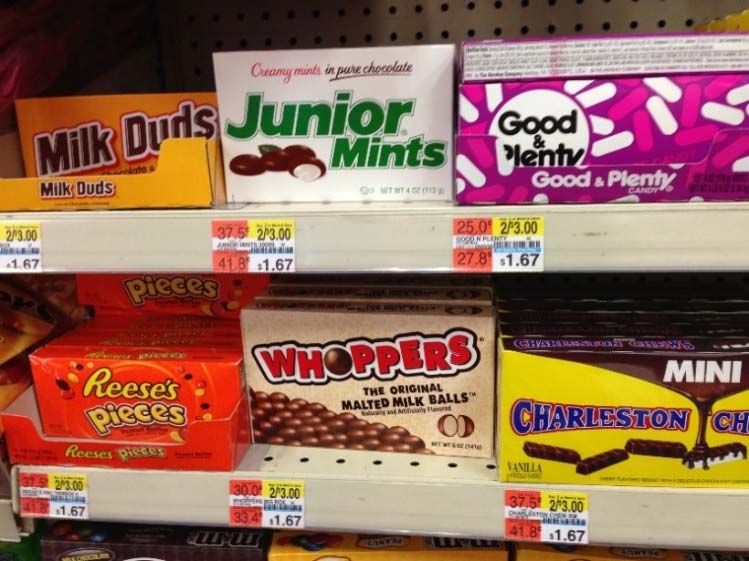
For each checkout, we recorded the number of facings of foods, beverages, and non‐
food merchandise items. A facing was defined as the display of a single product and did
not include items stacked behind it (see Figure 2). We counted facings to determine
what customers are confronted with when they wait at checkout. The checkout area
was photographed and any food or merchandise not listed on the instrument was
recorded.i

                         Figure 2. Photo Depicting 6 Facings of Candy

We categorized food as healthy, healthier, or unhealthy. For purposes of this study,
healthy foods included fruits, vegetables, and nuts; unhealthy foods were candy, energy
bars, chips, cookies/cakes, dried meat, and hot food (i.e. pizza, hot dogs, and chicken
wings); and healthier foods were somewhat nutritionally improved options that
contained nuts, dried fruit, or whole grains, such as granola bars, cereal bars, and trail
mix.ii

We categorized beverages as sugar‐sweetened drinks if they were regular sodas,
sweetened fruit drinks, sweetened water, sweetened iced tea/coffee, or full calorie
energy and sports drinks. Other beverage categories included water, diet/non‐caloric
beverages, and unsweetened juice.

i
 We refer to all checkout items that are neither food nor beverages as merchandise.
ii
 We excluded gum for this assessment, as we did not differentiate between sugar and sugar‐free gum in
data collection.

                                                  3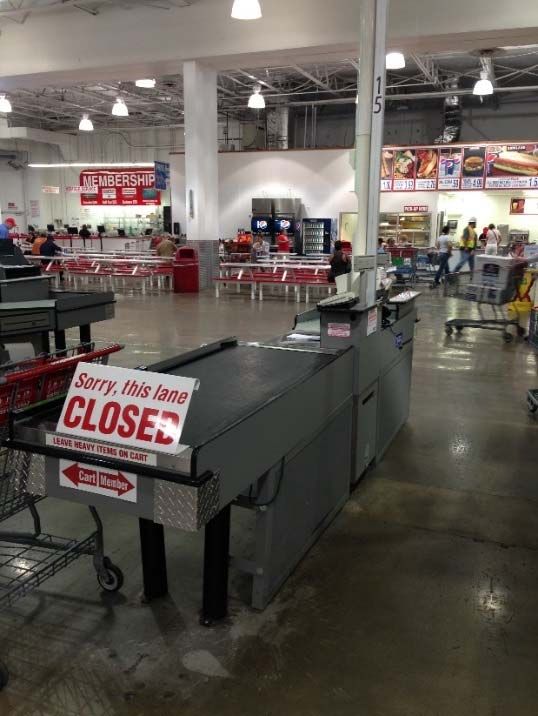
Results

All store types we visited marketed food or beverages, including non‐food stores. Table
1 presents the distribution of food, beverage, and non‐food merchandise for each store
type at their standard checkouts, which are defined as the checkout aisles where
customers wait if they do not choose an express, self, or “healthy” or family‐friendly
checkout.iii Supermarkets, supercenters, and convenience stores marketed mostly food
products. However, some non‐food stores, such as drug stores and toy stores, also
displayed mostly food items.

                           Table 1. Checkout Offerings by Store Type
        Store Type             % Food         % Beverages       % Non‐Food          Average Number of
                                                                Merchandise        Facings per Checkout

       Supercenter               81%                0%                19%                     162

           Drug                  76%               10%                14%                     153

         Grocery                 74%                8%                18%                     300

       Convenience               62%               12%                26%                     162

           Toy                   62%               29%                9%                      139

      Hardware/Home              37%                0%                63%                     77
       Improvement

       Office Supply             27%                8%                66%                     183

      Home and Bath              21%               31%                48%                     566

          Dollar                 20%               12%                68%                     184

         Clothing                17%               11%                72%                     283

          Books                  14%                1%                85%                     570

        Electronic               0%                42%                58%                     267

      Sporting Good              0%                10%                90%                     108

iii
  Some stores only had one style of checkout or one checkout for the entire store, which was considered
the standard checkout.

                                                   4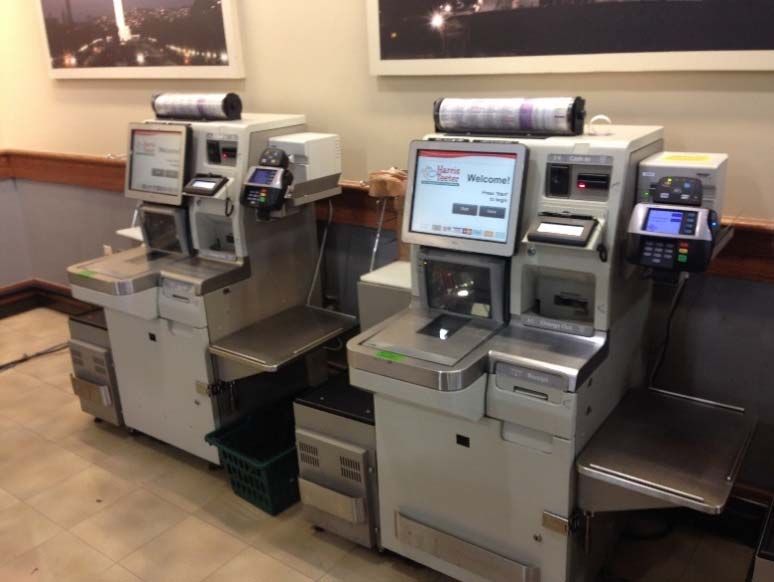
While, on average, non‐food stores displayed more non‐food merchandise than food or
beverages at checkout, food and beverages were common at these stores. iv 86% of all
non‐food stores surveyed carried food, beverages, or both at checkout (see Figure 3).

                       Figure 3. Presence of Food and Beverages at Checkout in
                                           Non‐Food Stores
                                                                       Only Beverages
                                                                             9%

                                                                                 Only Food
                                                                                   18%

                       Food and
                       Beverages
                         59%

                                                                            No Food or
                                                                            Beverages
                                                                               14%

     Figure 4. Costco Checkout Lane

                                                      Three non‐food stores (Best Buy, Old Navy,
                                                      CVS) carried food but no beverages, and 2 (Best
                                                      Buy, City Sports) carried beverages but no
                                                      food.

                                                      Only 3 out of the 21 non‐food stores surveyed
                                                      displayed neither food nor beverages at
                                                      checkout. Those stores were RadioShack,
                                                      Home Depot, and Modell’s, all of which carried
                                                      only merchandise, such as gift cards and
                                                      batteries, at checkout.

                                                      Additionally, only 1 food store surveyed,
                                                      Costco, did not promote any food or beverage
                                                      at checkout (see Figure 4).

ivResults on the presence of food and beverages were determined by looking at all of the aisles evaluated at each
store—and not just the standard checkout aisle—to determine if that store sold food or beverages at any of its
checkouts.

                                                          5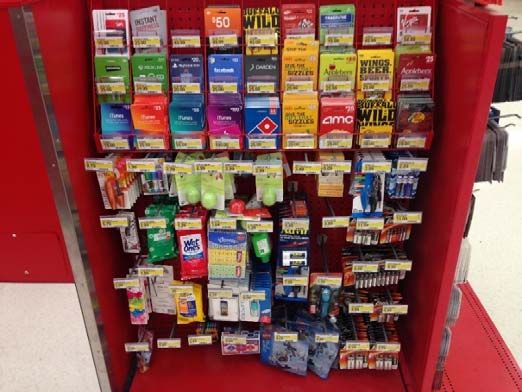
Checkout Offerings at Food vs. Non‐food Stores
Food stores’ checkouts differed from non‐food stores in what they offered. In our
sample, 84% of food store checkout offerings were foods or beverages (see Figure 5a).v
In contrast, 40% of non‐food store checkout offerings were foods and beverages (see
Figure 5b). The majority of items stocked at non‐food stores were non‐food
merchandise.

                                    Figure 5a. Food Store Options

                                                                     Beverages
                                                                        8%

                                Food
                                76%                                       Non‐Food
                                                                         Merchandise
                                                                            16%

                                 Figure 5b. Non‐Food Store Options

                             Beverages
                               15%

                                                                        Non‐Food
                                                                       Merchandise
                                                                          60%
                                 Food
                                 25%

v
 In Figures 5a, 5b, 6, 7, 9, and 11, and related text, we compared only the standard aisles of each store, so
that stores with more than one type of checkout aisle were not weighted more heavily than other stores.

                                                     6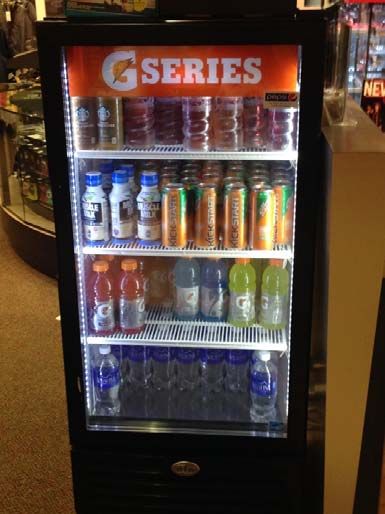
Food Offerings at Checkout
The majority of foods and beverages at checkout at all 30 stores combined were of poor
nutritional quality (see Figure 6). Candy was the most common food offering, followed
by gum, energy bars, chips, and cookies. Two in five food items were candy, and one in
five was gum.

                                                  Figure 6. Food Offerings at Checkout
                              45%   40%
  % of Total Food Offerings

                              40%
                              35%
                              30%
                                          23%
                              25%
                              20%
                              15%               11%
                                                       8%    7%
                              10%                                        4%   3%   2%    1%     1%
                               5%                                                                     0%     0%
                               0%

Overall, at all stores combined, 90% of checkout food options were unhealthy, 8% were
healthier, and just 2% of offerings were healthy (see Figure 7). We found only
occasional packages of nuts and dried fruit, and 3 stores offered baskets of fresh fruit
(see Figure 8).

                                Figure 7. Food Options at Checkout             Figure 8. Healthy and Unhealthy Options
                                                                                         at 7‐Eleven Checkout

                                                            Unhealthy
                                                              90%
             Healthy
               2%
Healthier
  8%

                                                                     7
Beverage Offerings at Checkout
The majority of beverage offerings for all stores combined were sugar‐sweetened
drinks, including regular sodas, fruit drinks, Vitaminwater, calorically sweetened iced
tea/coffee, and full calorie energy and sports drinks (see Figure 9). Water and diet/non‐
caloric beverages were the next most common offerings.vi
Figure 9. Beverage Offerings at Checkout
Milk 0%
JuiceNon‐Food Merchandise Offerings at Checkout
The most common non‐food merchandise offerings at checkout were gift and phone
cards and personal care products (see Figures 11 and 12). Personal care products
included make‐up, shampoo, toothpaste, lotion, and floss.
Figure 11. Non‐Food Merchandise Offerings at Checkout
20% 18%
18%
% Mechrandise Offerings
16%
14% 12% 12% 12% 11% 11%
12% 10%
10%
8% 7%
6% 4% 4%
4%
2%
0%
Home supplies, tech products, and books/print items were the next most common
offerings. Home supplies included cleaning supplies, candles, incense, reusable
shopping bags, air fresheners, plants, paper towels, water bottles and cups, and
flashlights. The technology category included audio/video (CDs, DVDs, headphones),
cameras, and film. Books and print included books, magazines, maps, postcards, and
bookmarks. Other items included ID holders, umbrellas, reading glasses, jewelry, key
chains, balloons, school supplies, gift bags, socks, and sweatbands.
Figure 12. Merchandise at Target Checkout
9Checkout Offerings by Type of Aisle
We compared the offerings at the 30 standard aisles, 5 express checkouts, 6 self‐
checkouts, and 1 family‐friendly checkout (see Figure 13). We found little difference
between the offerings in standard and express lanes across store types. However, self‐
checkouts displayed notably fewer offerings overall. Some self‐checkouts had no items
at all (see Figure 14).
Figure 13. Offerings by Checkout Lane Type
300
Average # Offerings per Checkout
250
200
150
100
50
0
Food Beverages Non‐Food Items Total
Standard (30) Express (5) Self (6) Family‐Friendly (1)
While customers may be able to reduce Figure 14. Harris Teeter Self‐Checkout
the number of items they are confronted
with by choosing the self‐checkout aisle,
they often cannot avoid food and
beverages altogether: two‐thirds of the
self‐checkout aisles we assessed
promoted unhealthy food.
Only 1 of the 30 stores we visited (Giant
Foods) offered a family‐friendly
checkout.vii This checkout was the same
as the store’s other lanes in the amount
and percentage of unhealthy food
offerings. It stocked the same amount of
candy as the other lanes; the only
difference was that it also included a fridge stocked with 12 facings of sugar‐sweetened
beverages, 8 facings of coconut water, and 8 facings of water.viii Future research should
vii
No stores offered “healthy” checkouts.
viii
Family‐friendly appears to refer to the content of the magazines offered, not the nutritional quality of
the food and beverage options.
10investigate more family‐friendly aisles to assess if they really do provide healthier
options.
Discussion
We found that both food and non‐food stores push sales of food and beverages at
checkout. We may be used to food and beverages at checkout, but from a public health
perspective, it is troubling that all but 3 of the 21 non‐food stores we surveyed
promoted unhealthy food or beverages at checkout.
In addition, the food and beverages promoted at checkout are overwhelmingly of poor
nutritional value. Approximately 90% of food at checkout is unhealthy. Soda and other
sugar‐sweetened beverages account for about two‐thirds of beverage choices. The
great majority of foods at checkout are loaded with sugar, and those that are not are
typically made with refined grains and too much salt.
When people shop, they are bombarded with displays of candy, soda, and other
unhealthy foods designed to prompt them to purchase and eat more calories. The
widespread availability of these junk foods and beverages means that customers have
no choice but to face unhealthy food when they check out. Whether customers shop at
pharmacies, gas stations, hardware stores, office supply stores, or even toy stores, the
presence of low‐nutrition foods at checkout serves as a cue to buy and consume junk
foods and sugar drinks.
A growing body of research links
Customers are faced with more than 45,000
junk food availability to obesity.
calories at the Walgreens checkout (Figure 15).
Our findings suggest that the high
prevalence of low‐nutrition and To burn that many calories, approximately 450
high‐calorie impulse buys at people would each have to walk a mile.
checkout reduces the quality of Figure 15. Walgreens Checkout Counter
Americans’ diet. Given the high
levels of obesity and the high
incidence of diseases caused by
poor nutrition, it is unethical for
stores to push people to buy and
consume extra calories that are
harming their health.
We recommend that non‐food
stores stop selling foods and
beverages at checkout. Our study
identified rare but encouraging
examples of stores not offering
foods or beverages in some—or
11any—checkout aisles. Given that non‐food stores already sell mostly merchandise at
checkout, they could sell only merchandise and no food.
We recommend that food stores adopt nutrition standards for their checkout offerings.
Those standards should set limits for calories, saturated and trans fats, added sugars,
and sodium for foods and beverages, and ensure that food offerings have positive
nutritional value by incorporating fruits, vegetables, whole grains, low‐fat dairy, nuts, or
seeds.ix That could be achieved through public policy or through voluntary efforts by
retail stores and food and beverage manufacturers.
Over the last several decades, unhealthy food and beverages at checkout have become
the norm. At the same time, obesity rates have skyrocketed. Given the high costs of
obesity and other diet‐related diseases, it is no longer acceptable for companies to push
extra calories on consumers at checkout.
ix
Alternatively, stores could limit checkout food and beverage offerings to water, fruit, and vegetables
(with no added fats or sugars) and emphasize non‐food merchandise instead.
12Appendix A: Retail Locations by Store Type
Store Type Retailer
Grocery Giant Foods
Harris Teeter
Trader Joe’s
Safeway
Whole Foods Market
Supercenter/Warehouse Costco
Target
Walmart
Drug Store CVS
Rite Aid
Walgreens
Convenience/Gas 7‐Eleven
BP
Shell
Dollar Store Dollar Tree
Five Below
Office Supply Office Depot
Staples
Home and Bath Bed Bath and Beyond
Clothing Old Navy
T.J. Maxx
Electronics Best Buy
RadioShack
Sporting Goods City Sports
Modell’s Sporting Goods
Home Improvement/Hardware Ace Hardware
Home Depot
Toy Store Toys “R” Us
Bookstore Barnes & Noble
Books‐a‐Million
13Appendix B: Checkout Aisle Survey Instrument
Date of Assessment: __________________ Start Time: _________ End Time: ___________
1. Store
Name: ____________________________________________________________________
Location (Address, City, Zip code): ______________________________________________
Type (Circle):
Grocery Office Supply Book Store
Supercenter/Warehouse Dollar Store Sporting Goods Store
Drug Store Home and Bath Home Improvement/Hardware
Convenience Electronics Store Toy Store
Clothing
2. Checkout Design
Checkout Type Total number of queues Is there a common queuing Number of queues
area for this checkout type? evaluated
(Yes/No)
Standard
Express
Self‐Checkout
Healthy/Family
Friendly
Total
For stores that have individual queues for each register, checkout is defined as encompassing
the end cap or cooler attached to the aisle, the aisle itself, the area over the belt, and dump bins
and standing displays within one pace (approximately 30 inches) of the aisle. For stores that
have one queue for multiple registers, checkout is defined to include all belted areas/areas
where people wait in line, the end cap or cooler attached to one aisle, the aisle itself, the area
over the belt, and dump bins or displays within one pace of where people wait in line.
143. Food Evaluation – remember to take a photo of each checkout assessed.
If you are evaluating more than 4 checkouts, use duplicate pages. On the first line, indicate the
checkout type, and on the two lines at the bottom, indicate the type of food sold.
Checkout #1 Checkout #2 Checkout #3 Checkout #4
Checkout Type (Standard, Express, Self,
Healthy)
# of Facings # of Facings # of Facings # of Facings
Candy
Gum & Mints
Chips & Pretzels
Cookies & Cakes
Granola & Cereal Bars
Energy & Power Bars
Trail Mix (with Candy)
Nuts, Seeds & Trail Mix (No Candy)
Dried & Canned Fruit & Vegetables
Fresh Fruit & Vegetables
Dried Meat/Jerky
Other Food – Indicate Type & # Facings
Dump Bins & Free‐Standing Displays –
Indicate Product & # Facings
15Store: ______________________________________ Location: ___________________________
4. Beverage and Merchandise Evaluation – remember to take a photo of each checkout
assessed.
On the first line, indicate the checkout type, and on the bottom line, indicate the type of “other”
sold. For all other lines, indicate the number of facings. Use the back to indicate particularly
creative products.
Checkout #1 Checkout #2 Checkout #3 Checkout #4
Beverages # of Facings # of Facings # of Facings # of Facings
Energy Drinks
Sweetened Beverages
100% Juice
Water/Seltzer
Diet/Non‐Caloric Beverages
Other Drinks – Indicate Type & #
Facings
Merchandise # of Facings # of Facings # of Facings # of Facings
Books, Magazines & Other Print
Phone & Gift Cards
Batteries
Film & Cameras
Personal Care Products
Audio, Video, & Other
Technology
Children’s Toys & Games
Other – Indicate Type & #
Facings
165. Additional Notes
17Appendix C: Food, Beverage, and Non‐Food Offerings in Stores’ Standard Checkout
Aisles
Food Stores Non‐Food Stores Overall
Offering % Total # Offerings % Total # Offerings % Total # Offerings
Food 76% 1,658 25% 1,216 41% 2,874
Beverages 8% 171 15% 693 12% 860
Non‐Food 16% 360 60% 2,876 47% 3,240
Total 100% 2,189 100% 4,785 100% 6,974
Appendix D: Beverage Offerings at Checkoutx
50% 46%
% of total beverage offerings
45%
40%
35%
30%
25%
20% 17%
14%
15% 11%
10% 7%
5%
5% 0%
0%
x
Beverage offerings at checkout—excluding wine—are included in the text of the report as Figure 9.
18References
1
Fryar CD, Carroll MD, Ogden, CL. NCHS Health E‐Stat: Prevalence of Overweight, Obesity, and
Extreme Obesity among Adults: United States Trends 1960‐1962 through 2009‐2010. Atlanta:
Centers for Disease Control and Prevention, September 2012.
2
Centers for Disease Control and Prevention (CDC). Overweight Children Ages 6‐17: Percentage
Has Increased from 6% in 1976 to 17% in 2006, August 2009. Accessed at
.
3
Ogden CL, Carroll MD, Kit BK, Flegal KM. NCHS Data Brief: Prevalence of Obesity in the United
States, 2009‐2010. Centers for Disease Control and Prevention, January 2012.
4
Farley TA, Baker ET, Futrell L, Rice JC. “The Ubiquity of Energy‐Dense Snack Foods: A National
Multicity Study.” American Journal of Public Health 2009, vol. 100, pp. 306‐311.
5
Ni Mhurchu C, Vandevijvere S, Waterlander W, Thornton LE, Kelly B, Cameron AJ, Snowdon W,
Swinburn B. “Monitoring the Availability of Healthy and Unhealthy Foods and Non‐Alcoholic
Beverages in Community and Consumer Retail Food Environments Globally.” Obesity Reviews
2013, vol. 14, pp. 108‐119.
6
Wansink B, Painter JE, Lee YK. “The Office Candy Dish: Proximity’s Influence on Estimated and
Actual Consumption. International Journal of Obesity 2006, vol. 30, pp. 871‐875.
7
Kerr J, Sallis JF, Bromby E, Glanz K. “Assessing Reliability and Validity of the GroPromo Audit
Tool for Evaluation of Grocery Store Marketing and Promotional Environments.” Journal of
Nutrition Education and Behavior 2012, vol. 44, pp. 597‐603.
8
Desmet P, Renaudin V. “Estimation of Product Category Sales Responsiveness to Allocated
Shelf Space.” International Journal of Research in Marketing 1998, vol. 15, pp. 443‐457.
9
Levitsky DA. “The Non‐Regulation of Food Intake in Humans: Hope for Reversing the Epidemic
of Obesity.” Physiological Behavior 2005, vol. 86, pp. 623‐632.
10
Kerver JM, Yang EL, Obayashi S, Biacnhi L, Song Wo. “Meal and Snack Patterns are Associated
with Dietary Intake of Energy and Nutrients in US Adults.” Journal of American Dietetic
Association 2006, vol. 106, pp. 46‐53.
11
U.S. Department of Agriculture (USDA), U.S. Department of Health and Human Services.
Dietary Guidelines for Americans 2010. Washington, D.C.: U.S. Government Printing Office,
December 2010.
12
Malik VS, Schulze MB, Hu FB. “Intake of Sugar‐Sweetened Beverages and Weight Gain: A
Systematic Review.” American Journal of Clinical Nutrition 2006, vol. 84, pp. 274‐288.
13
Farley TA, Baker ET, Futrell L, Rice JC. “The Ubiquity of Energy‐Dense Snack Foods: A National
Multicity Study.” American Journal of Public Health 2009, vol. 100, pp. 306‐311.
14
Gebauer H, Laska MN. “Convenience Stores Surrounding Urban Schools: An Assessment of
Healthy Food Availability, Advertising, and Product Placement.” Journal of Urban Health 2011,
vol. 88, pp. 616‐622.
15
Miller C, Bodor JN, Rose D. “Measuring the Food Environment: A Systematic Technique for
Characterizing Food Stores Using Display Counts.” Journal of Environmental and Public Health
2012, vol. 2012, pp. 1‐6.
16
Barker DC, Quinn C, Turner L, Rimkus L, Zenk S, Chaloupka FC. Availability of Healthy Food
Products at Check‐out Nationwide, 2010‐2012‐‐‐A BTG Research Brief. Chicago: Bridging the Gap
Program, Health Policy Center, Institute for Health Research and Policy, University of Illinois at
Chicago, 2014 (forthcoming).
19You can also read