MONASH-CITYLINK-WEST GATE UPGRADE PROJECT: IMPLEMENTING TRAFFIC MANAGEMENT TOOLS TO MITIGATE
←
→
Page content transcription
If your browser does not render page correctly, please read the page content below
MONASH-CITYLINK-WEST GATE UPGRADE PROJECT:
 IMPLEMENTING TRAFFIC MANAGEMENT TOOLS TO MITIGATE
                FREEWAY CONGESTION

                                      Vincent Vong
                      Team Leader Ramp Metering & Network Operation,
                          Monash-CityLink-West Gate Upgrade Project
                                           VicRoads,
                     3 Prospect Hill Road, Camberwell, Vic, 3124 Australia
      Tel 613 9811 8191, Fax: 613 9811 8278, Email: vincent.vong@roads.vic.gov.au

                              Correspondent John Gaffney
                                Delivery Manager Ramp Metering,
                          Monash-CityLink-West Gate Upgrade Project
                                            VicRoads,
                      3 Prospect Hill Road, Camberwell, Vic, 3124 Australia
       Tel 613 9811 8259, Fax: 613 9811 8278,Email: john.gaffney@roads.vic.gov.au

                                    ABSTRACT:
This paper provides a high level overview of the Monash - CityLink - West Gate Upgrade
Project with an emphasis on freeway design and the integration of Intelligent Transport
Systems (ITS) elements in the project.

The $1.39 billion ($AUS) project includes a Freeway Management System consisting of
Coordinated Freeway Ramp Signals (CFRS) at 64 sites over 75km corridor to improve traffic
operations as well as incorporating an extensive section of Lane Use Management System
(LUMS) comprising integrated lane control, speed control and enroute information, including
extensive use of pictograms and text messages to improve safety and incident management.

In particular, the project deploys the latest CFRS technology developed in Europe but
enhanced in Australia to meet local operations requirements. A $1M pilot project of this
technology has been implemented at six consecutive sites on the Monash Freeway. This pilot
replaced the existing fixed time ramp metering system, and the results have exceeded
expectations in reducing delays, improving reliability and increasing traffic throughput. The
economic payback period of the pilot project was just 11 days.

This paper explains how CFRS works with a particular emphasis on control modules, system
functionalities, performance measurement and analysis, as well as preliminary result from the
before and after study.

                                      Page 1 of 17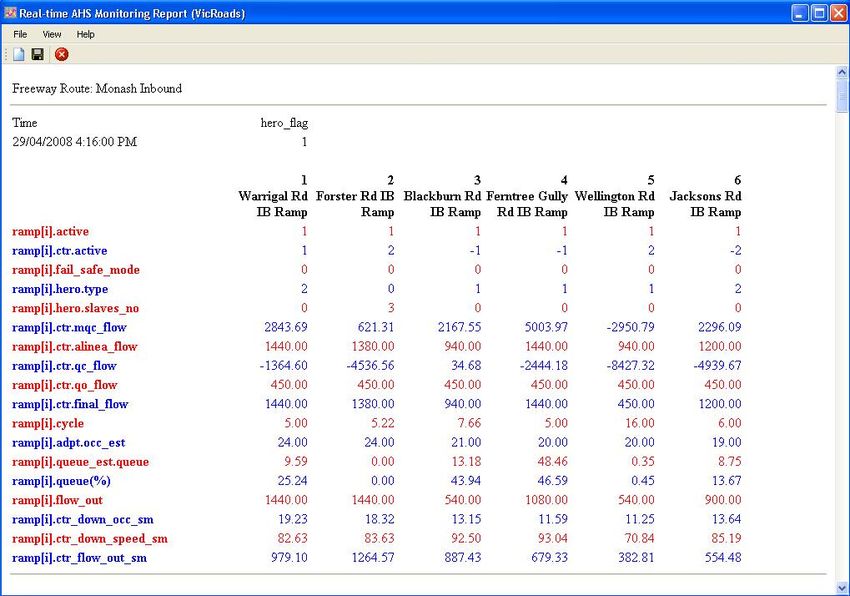
1 INTRODUCTION
In May 2006, the Premier of Victoria, Australia announced a $1.39 billion ($AUS) four-year
project to improve traffic flow and safety on the Monash-West Gate Freeway, a 75 km east-
west corridor. The project is known as the Monash-CityLink-West Gate Upgrade Project as
the 10 km CityLink Section of the corridor is privately funded and operated toll road. The
upgrade is a joint project between the Victorian Government and toll road operator
Transurban.
A unique feature of this upgrade is the provision of a Freeway Management System (FMS)
including a wide range of ITS tools and the provision of a state-of-the-art communication and
control systems to provide integrated operations.
Approximately $100 million is being devoted to ITS including the implementation of a
Coordinated Freeway Ramp Signals (CFRS) at 64 sites over 75km corridor to improve traffic
operations. In particular, it involves the deployment of the latest CFRS technology developed
in Europe but enhanced in Australia to meet local operations requirements.
A $1M pilot project of this technology has been implemented at six consecutive sites on the
Monash Freeway. This pilot replaced the existing fixed time ramp metering system, and the
results have exceeded expectations in reducing delays, improving reliability and increasing
traffic throughput. The economic payback period of the pilot project was just 11 days.
This paper provide an overview of the scope of the Monash-CityLink-West Gate Upgrade
Project and present information on the how CFRS works, system functionalities, performance
measurement and analysis, as well as preliminary results from the before and after study.
2 THE PROJECT
2.1 Overview
The project provides a leading edge solution to Melbourne’s most heavily trafficked and
economically important transport connection, the West Gate Freeway and Monash Freeway.
It includes not only civil engineering work to upgrade of the Monash, CityLink and West
Gate Freeways but also a dynamic, intelligent system to maintain smooth traffic flow, despite
increasing future demand. The project (refer to Figure 1 below) commenced in 2007 and
includes:
provision of an additional lane on the Monash Freeway and CityLink in both directions;
widening of the West Gate Freeway between the CityLink tunnels and the West Gate
Bridge to separate merging and weaving traffic;
strengthening of the West Gate Bridge to provide five lanes in each direction instead of
four;
commissioning of a state of the art monitoring and control system and communication
network;
introduction of a system wide coordinated freeway ramp signals to control all traffic
entering the freeway at 64 sites including some sites on adjacent freeways which enter
this route, the use of variable speed limits and lane control to provide optimum flow, as
well as providing real-time traffic information both on and off the freeway providing
motorists with information to make route choice decisions; and
Page 2 of 17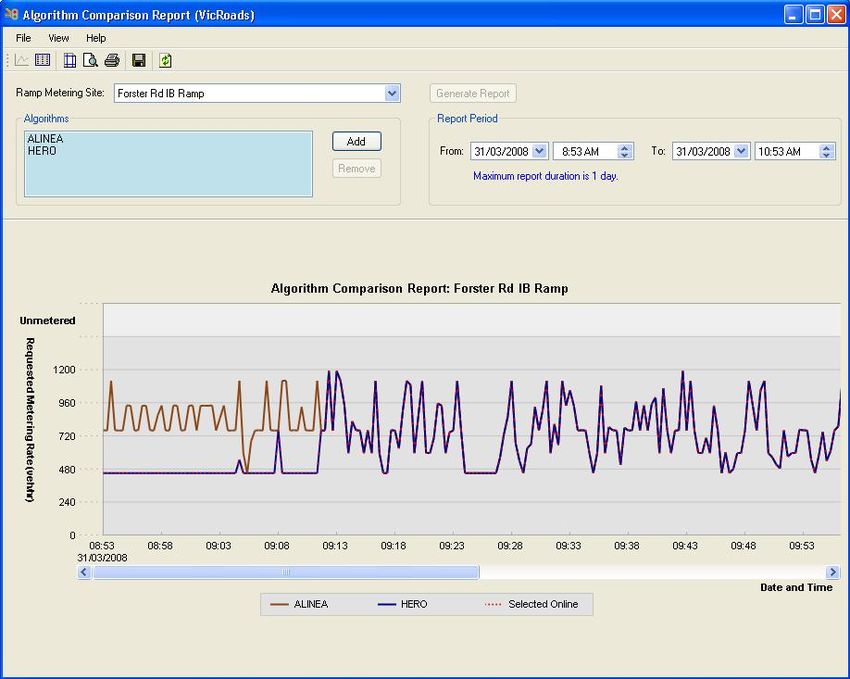
five ramps will be provided with priority access lanes for truck/bus/High Occupancy
Vehicle and arterial roads/freeway interfaces will be managed with supporting real-time
information systems and integrated traffic signal management plans.
One new lane in each direction on Monash Fwy and CityLink
Additional lane in each direction on West Gate Fwy to separate merging and
weaving traffic
Strengthening of the West Gate Bridge to provide 5 lanes in each direction
instead of 4
Freeway Management System to better manage traffic flow
Figure 1 – Monash – CityLink -WestGate Upgrade Locality Plan
Stated Project Objectives are:
maximise performance across the entire 75 km route;
maximise utilisation of the West Gate Bridge and City Link tunnels;
improve the efficiency of the route by reducing travel times, travel time variability and
congestion;
improve safety; and
improve access to the freeway network.
Upon completion of the project in late 2010, it is estimated that peak hour travel time savings
on this corridor will be significant as existing average speeds are low and in the order of 25
km/h and 40 km/h on the West Gate and Monash Freeways respectively. It should be noted
the higher flows predicted from the integrated ITS tools are realistic as these volumes were
achieve five or more years ago during peak periods, and are currently being achieved today
although outside of peak periods, before flow breakdown sets in. Therefore, this project is
about sustaining the performance we achieved in the past, and locking in the benefits of new
civil works.
2.2 Transport Context of Corridor
In summary the West Gate – Monash Freeway corridor is Melbourne’s most important
freeway route providing a continuous, high standard 6/8 lanes transport link between the
national routes at Melbourne’s eastern and western extremities and is used:
Page 3 of 17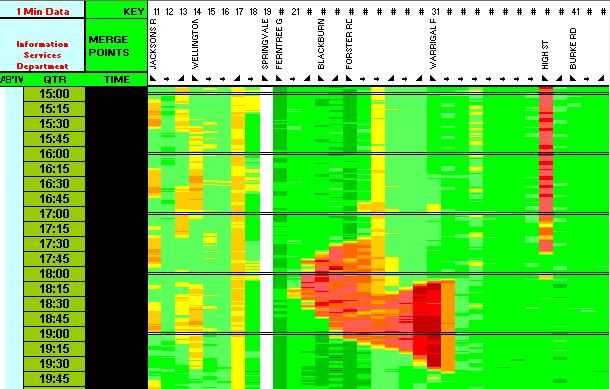
•   to transport primary produce from interstate and regional corridors to Melbourne’s
    industrial centres;
•   to transport bulk building and road construction materials from extraction sites in nearby
    regions to facilitate general growth within the Melbourne metropolitan area;
•   to distribute processed and manufactured goods between key industrial and warehousing
    centres in metropolitan Melbourne, and regional centres such as Geelong, Bendigo,
    Ballarat and the Latrobe Valley; and to the Dynon Rd intermodal interchange, Avalon and
    Tullamarine airports and interstate routes serving Sydney, Brisbane and Adelaide;
•   to transport the majority of containerised, imported and exported goods that enters and
    leaves the Port of Melbourne. Most of these containers are packed or unpacked in outer
    metropolitan areas;
•   by employees, contractors, tradesmen and university students to travel from residential
    areas, particularly those located in the developing, outer metropolitan areas and nearby
    regions, to jobs and contracts in major business districts and industrial areas, and
    universities;
•   by business and retail representatives to access customers and markets at major business
    and retail centres along the route and along its primary feeders. The route is critical to
    this group because it passes through the geometric centre of the Melbourne metropolitan
    area;
•   by long-distance, private and freight vehicles moving east-west across Melbourne
    between regional centres and interstate origins and destinations;
•   by private persons living along the corridor and its major tributaries who access airports,
    schools, retail centres, leisure and tourism venues, and their families and friends.; and
•   multiple large sporting and entertainment facilities in the centre of Melbourne.

This vital piece of existing transport infrastructure includes the eight lane West Gate Bridge
and the six lane CityLink tunnels. It carries up to 160,000 vehicles per day, with 18,000 to
22,000 trucks per day on most sections between Western Ring Road and Heatherton Road.
The high level of commercial vehicle volumes, as can be seen is primarily due to the route
connecting the Central Business District (CBD) and the Port of Melbourne, key industrial
precincts at Laverton and Dandenong, and to regional transport corridors. Traffic volumes on
this route have increased at a rate of 3-5 percent each year over the past four years.
Peak period demand exceeds capacity and users are travelling earlier and later to avoid the
delays of the peak. The peak period typically extends for up to 3-4 hours and is becoming
longer each year by about 12 mins. Users experience stop-start travel conditions, with a 15
minute journey under free flow conditions taking up to one hour in peak periods. This means
that the level of service provided to transport users is lowest when demand is highest.

               3     CURRENT OPERATING PROBLEMS
3.1 Existing Bottlenecks
The continuous development of Melbourne’s Freeway network, primarily by extending
existing routes towards the outer suburbs has resulted in many bottlenecks unwittingly being
built into the road network. These bottlenecks did not manifest themselves until many years
later when sections of the freeway began to reach their design capacity.

                                       Page 4 of 17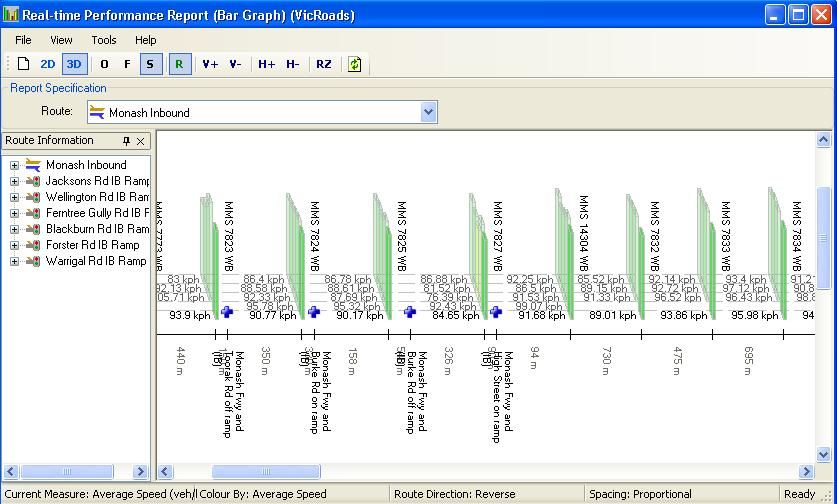
3.2 Loss of Productivity
On freeways without any form of system wide dynamic traffic management (i.e. most
Victorian urban freeways) traffic flow during the peak periods can remain collapsed for two
to six hours, with an average loss of throughput of 20 percent to 25 percent per hour
compared to normal free-flow conditions. This loss of throughput is illustrated in Figure 2
which shows week day vehicle volumes for a typical (3 lane) recurrent bottleneck on the
Monash Freeway. The red line indicates the traffic volume on a hard-to-find good day (only 1
such day found in August 2004 when flow break down did not occur – now flow breakdown occurs virtually
every day of the year except public holidays and weekends). The green line indicates a typical flow
breakdown volume with the loss in productivity indicated by the yellow shaded area.

                            Figure 2: Lost productivity due to congestion
It has been considered that freeways often perform at their worst when they are needed the
most and that freeways rarely operate at capacity and when they do it is usually only for a
short period of time. When freeway flow collapses it generally results in upstream and
downstream sections of the freeway also not reaching capacity due to the widespread effects
of shockwaves and flow breakdown induced bottlenecks discharging at much lower rates and
restricting supply to downstream sections of the freeway.
On average, peak period flows of Melbourne’s congested freeways appear to be operating
closer to 1,600 - 1,700 veh/hr per lane, representing a loss of productivity between 20 percent
and 25 percent during the combined six hour period of peak AM and PM demand. As the
peak period demand increases, productivity will continue to decline if the freeway is left
unmanaged.
The Monash-CityLink-West Gate Upgrade project sets about removing these bottlenecks by
the use of tools such as the provision of additional capacity at known bottlenecks, use of
braided ramps to improve heavy merging and diverging movements, extensive use of add
lanes rather than merging lanes, use of collector distributor roads to separate vehicles
travelling to different destinations thus reducing mainline turbulence and a move towards a
fully coordinated Freeway Ramp Signals to manage all inflows.

          4     COORDINATED FREEWAY RAMP SIGNALS
4.1 Introduction
The following sections describe the new coordinated freeway ramp signals (FRS)
implemented on the six inbound entry ramps on Monash Freeway between Jackson Road and

                                          Page 5 of 17
Warrigal Road (refer Figure 3 below) It provides information on the system functionalities,
performance measurement and the results achieved based on a before and after study.

                          Warrigal Rd
                               Forster Rd
                                       Blackburn Rd
                                                  Ferntree Gully Rd
                                                      Wellington Rd
                                                          Jacksons Rd

Figure 3 – Locality Plan of 6 Inbound Freeway Ramp Signals

The objectives of the coordinated FRS are to:
•   improve safety by reducing the number of crashes and incidents;
•   optimise freeway throughput and mitigate congestion by managing bottlenecks to
    minimise the occurrence of flow breakdown;
•   enable the existing (built) capacity of the freeway to be reached by managing supply to
    optimise freeway capacity;
•   balance demands across multiple ramps rather than managing individual ramps;
•   provide equity of access and consistent traffic conditions on the freeway network;
•   provide smoother flow and reduce the effects of incidents;
•   improve travel time and travel time reliability; and
•   improve access from the arterial road network

4.2 Background
In 2002, VicRoads commenced the installation of ramp signals at freeway interchanges
where entry ramp traffic needed to be managed to prevent traffic flow problems on the
freeway. The entry ramp signals operated in a simple manner at each site to assist with safe
merging of the traffic onto the freeway.

In 2004 VicRoads undertook further analysis of the freeway data (i.e. loops every 500m in
each lane) and from video footage. This analysis led to further understanding of critical
bottlenecks and the formation and influence of shock waves. This work identified the need

                                        Page 6 of 17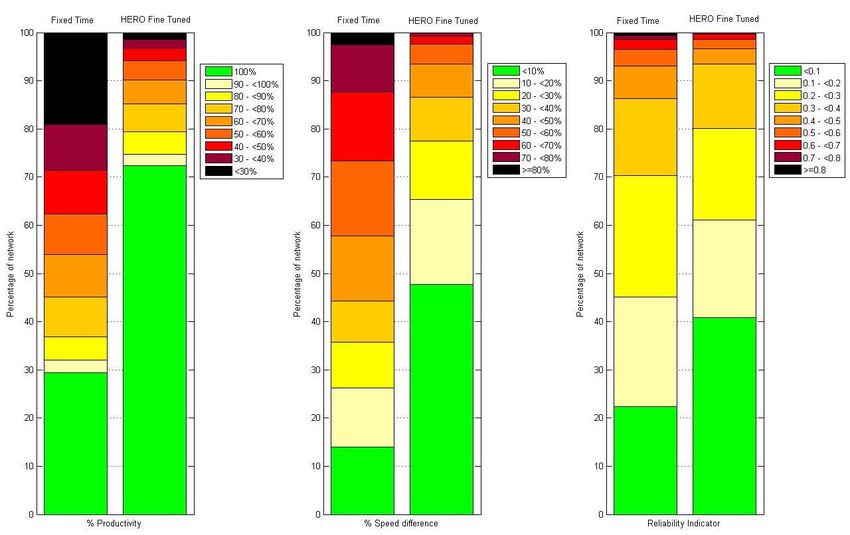
for a system wide approach to freeway management and the need for coordination of ramp
signals to further improve the quality of freeway service and throughput. VicRoads has
recognised the value of a coordinated freeway ramp signals as well as the benefits of
providing priority for specific users such as trucks, buses and other priority users such as high
occupancy vehicles and taxis.

The concept of a coordinated approach to ramp signals can enable the freeway to be managed
to its capacity. This requires the management of inflows to the freeway to match the capacity
of the freeway and to control the volume of traffic at congested locations (e.g. bottlenecks).

Evaluation of the various freeway ramp signal algorithms used around the world has
concluded that one which deserves very serious attention is the European HERO algorithm
designed by Prof. Markos Papageorgiou and Associates. This algorithm best reflected
VicRoads understanding of freeway flow and is intuitive to the traffic engineer. The HERO
algorithm and its supporting subsystems have been adopted by the EURAMP (EUropean
RAmp Metering Project) and funded by the European Community under the “Information
Society Technologies” Programme (2002-2006). Considering Melbourne’s freeway
conditions, HERO has been chosen as the core algorithm for the coordinated FRS trial.
HERO is responsible for a number of estimation and control tasks for each individual
controlled ramp. Thus, the HERO software part (consisting of a number of software modules)
is run for each controlled ramp separately, each time with specific ramp configuration
parameters and specific (local) real-time measurements. HERO is a unique software module
that coordinates the individual decisions for each ramp.

4.3 The Coordinated Freeway Ramp Signal System
4.3.1    Algorithm Implementation
HERO Software is the algorithm implemented within the coordinated FRS system. A brief
description of some of the key modules of the algorithm is given below:
•   ALINEA Core Module: compares the occupancy from the mainline detector with the
    set-point to calculate desired exit flow to maximise mainline throughput. The value is
    restrained by the minimum and maximum allowable exit flow for the ramp. The set-point
    is either user defined or calculated from the Critical Occupancy Estimation Module.

•   Queue Estimation Module: estimates the queue length by using flow measurements at
    the on-ramp entrance and exit, and the occupancy on the middle of the ramp.

•   Queue Control Module: uses the ramp queue length and measures the ramp demand at
    the entrance to calculate a desired ramp exit flow. This is to ensure adequate storage
    exists to meet demands and prevent overspill onto the arterial road.

•   Queue Override Module: determines whether the occupancy measurements at the
    entrance of the on-ramp and the arterial road exceed a preset threshold. If so, then a
    predetermined high ramp flow value is recommended as the ramp exit flow.

•   HERO Module: coordinates ramps by balancing queues. It obtains the queue length
    estimation of all ramps and the average occupancy from all mainline locations and
    recommends minimum queue lengths for each ramp. A ramp is activated as a ‘HERO
    Master’ if its queue length exceeds a preset threshold. A ‘HERO Master’ automatically

                                        Page 7 of 17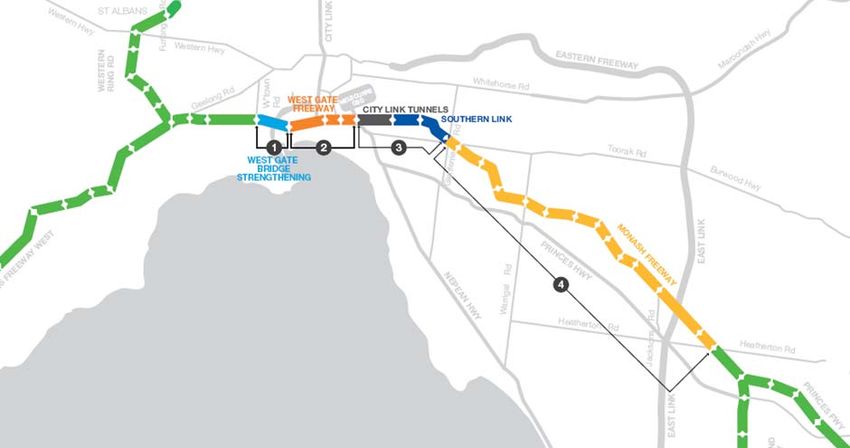
activates a ‘HERO Slave’ from the first upstream ramp and engages more ramps if the
total queue continues to exceed the preset threshold. The ‘HERO Master’ deactivates
itself and all it’s ‘HERO Slaves’ when the total queue reduces below the preset threshold.
• Minimum Queue Control Module: uses the ramp queue length and demand on the ramp
to calculate the recommended flow so that a minimum queue ordered by HERO is
attained.
4.3.2 System Functionality
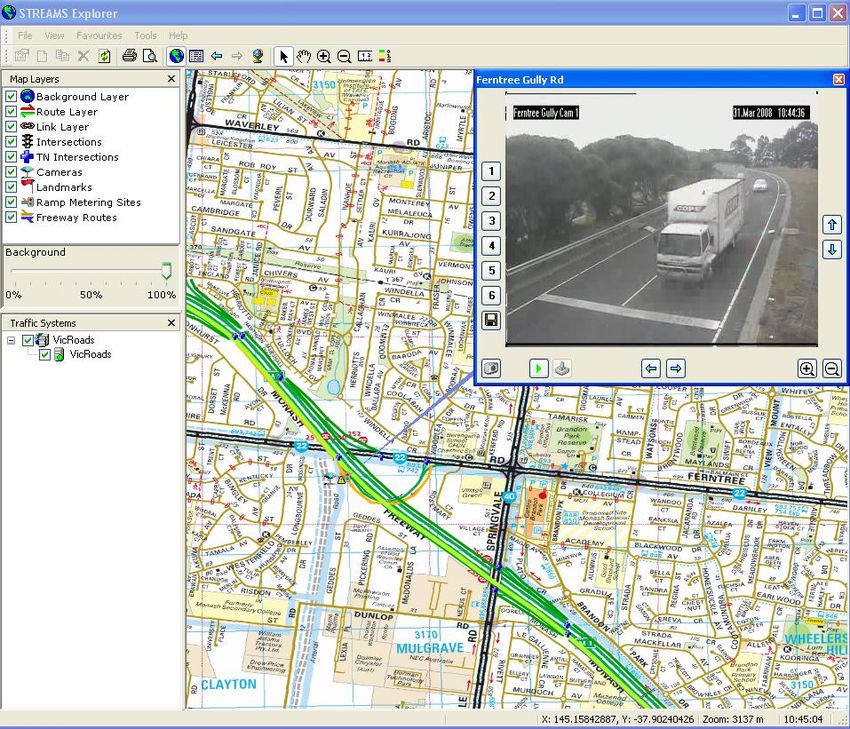
The coordinated FRS system has been developed based on a Service Oriented Architecture
(SOA) utilizing web services for this platform. Its Explorer (Figure 4) provides a consistent,
integrated map style interface for the operator. Operational data relevant to the selected view
is updated throughout the interface (including the map) in real time. All system functions are
made available to the operator through the map interface, list views, property pages, feature
windows and/or menus.
Figure 4, System Explorer
An example of some of the other useful ramp and route reports available are as follows:
• Route Bar Graph (Figure 5): Displays the real time performance data of occupancy, flow
or speed at detector sites on the route.
Page 8 of 17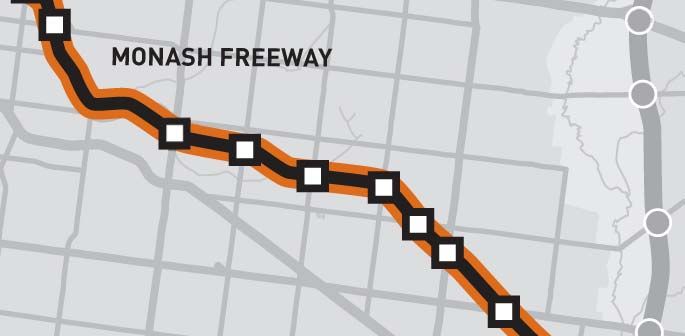
Figure 5 Route Bar Graph (Speed)

•   Algorithm Comparison Report (Figure 6): Compares the activation/ deactivation periods
    and Freeway Ramp Signals rates proposed by each of the algorithms associated with the
    Freeway Ramp Signals sites.

       flow value in                                              implemented
       case of isolated                                           flow value
       FRS                          flow value in
                                    case of
                                    coordinated FRS

      Figure 6 Algorithm Comparison Report

                                     Page 9 of 17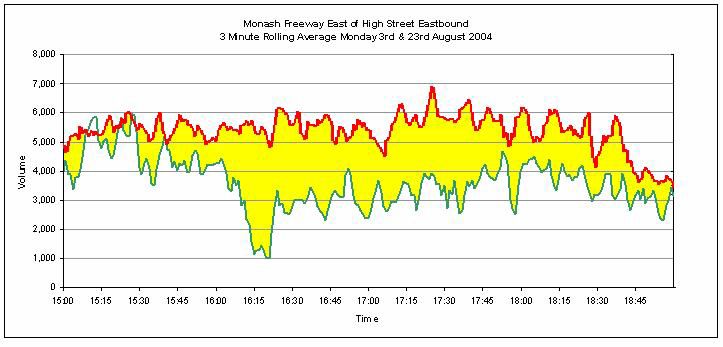
•       Real Time AHS Monitoring Report (Figure 7): Displays instantaneous traffic flow
        performance measures for a freeway route and associated Freeway Ramp Signals sites.

                                                                                Final ramp
                   Forster                                                      flow is
                   ramp is a                                                    chosen by
                   master,                                                      considering
                   and has 3                                                    all modules
                   ramps as                                                     calculated
                   slaves                                                       flow

                                                                                Ramp cycle
                                                                                time in
                                                                                seconds

                                                                              No of cars
                                                                              queued on
                                                                              the ramp

    Figure 7. Real Time AHS Monitoring Report

4.4 Before and After Study
4.4.1      AM Peak

4.4.1.1 Previous Fixed Time System
Figure 8 shows the AM Peak speed contour plot for a typical day when the ramp signals were
run by the original fixed time system. The following points are observed from this Figure 8:

•   There is a bottleneck created around 6:30 am between Forster and Warrigal ramps. This
    bottleneck has been intensified due to recent road works.

•   There is second bottleneck created around 6:30 am at High Street ramp where the number
    of lanes in the freeway increases from 3 to 4 resulting in a large number of lane changes.
    The new coordinated FRS is intended to effectively manage this bottleneck to achieve
    increase flow and speed in this area.

•   There is a third bottleneck created further downstream where no freeway ramp signals
    exist between High Street and Toorak Road. This bottleneck propagates upstream and
    reaches the second bottleneck before 8:00 am, consequently causing flow breakdown on
    the freeway. Due to the small number of FRS in operation (only 6), there is limited
    opportunity to effectively manage this bottleneck at the moment.

                                      Page 10 of 17
Bottleneck 2
Bottleneck 1
Bottleneck 3
Figure 8. AM Peak Typical Day (Fixed Time)
4.4.1.2 HERO
Figure 9 shows the speed contour plot of a typical day when the FRS was run by the new
coordinated FRS system (HERO). It could be revealed that the second bottleneck was nearly
removed and the average speed was increased in that area.
Bottleneck 2
Bottleneck 1
Bottleneck 3
Figure 9. AM Peak Typical Day (HERO)
Page 11 of 174.4.1.3 Before and After Speed Contour Plot
Figure 10 shows the speed contour plots side by side when the FRS was run by the previous
fixed time system vs. the new coordinated FRS system (HERO). The improvements achieved
are more obvious in this before and after plot.
With more upstream &
downstream ramp signals further
improvement is possible
Figure 10. Before and After Speed Contour Plot
4.4.1.4 Comparison
As discussed in section 4.4.1.1, there are 3 bottlenecks within the area of study. The first
bottleneck is in the vicinity of Forster Road. The effectiveness of the FRS in managing this
bottleneck is limited due to the inability to control inflow east of Jacksons Road (i.e. no FRS
upstream of Jacksons Road) and the impact of ongoing roadworks. The third bottleneck is
created from congestion west of High Street at approximately 8.00am. This third bottleneck
propagates upstream and eventually reaches the second bottleneck. Similarly this third
bottlenecks is unmanageable due to no FRS downstream of High Street. Therefore to provide
a meaningful evaluation of the performance of the new coordinated FRS, the study has
primarily concentrated on the effectiveness of the system in managing the second bottlenecks
between 6.00am and 9.00am which is within the full control of these 6 FRS.
Comparing the previous fixed time systems and the new HERO system, the average flow on
the freeway between Warrigal Road and High Street shows an increase of 5 percent between
6:00am to 9:00am (from 1931 veh/h/lane in fixed time to 2022 veh/h/lane in HERO). It
should be noted that this 5 percent increase in flow is on top of 15 percent flow increase
achieved by fixed time freeway ramp signals compared to no freeway ramp signals in AM
peak. Moreover, considering the large percentage of heavy vehicles using this section of
Monash Freeway, the passenger car equivalent (pcu) flow of the new coordinated system is
2166 pcu/h/lane which is very close to the maximum possible throughput, i.e. 2200
pcu/h/lane.
Page 12 of 17Evaluating the performance of the two systems over five different days between 6:00am and
9:00am, using the Austroads National Performance Indicators 1 shows that:
• average travel speed has increased by 35 percent (from 49 km/h to 66 km/h);
• productivity 2 has significantly improved (Figure 11). In the new system, 72 percent of the
network has 100 percent productivity compared to 29 percent in the previous fixed time
system;
• variation from posted speed limits has significantly decreased (Figure 11). In the new
system, 65 percent of the network has less than 20 percent variation from posted speeds
compared to 26 percent in the previous fixed time system; and
• reliability 3 has significantly improved (Figure 11). In the new system, 41 percent of the
network was operating in “grade one” reliability compared to 22 percent in the previous
fixed time system.
Figure 11. Austroads National Performance Indicators
1
R. Troutbeck, M. Su, J. Luk; “Austroads Report: National Performance Indicators for Network Operations”,
RCNS1207-6, Aug 2007.
2
Productivity is an indicator of the product of speed and flow. A high productivity is achieved if both speed and
flow are maintained near maximum values.
3
Reliability is based on the coefficient of variation of travel time. Stable travel times result in a small value for
the coefficient of variation.
Page 13 of 174.4.2 PM Peak
4.4.2.1 Previously No Freeway Ramp Signals
Figure 12 shows the PM Peak speed contour plot for a typical day with no freeway ramp
signals on Monash freeway. The following points are observed from this Figure 12:
• There is a bottleneck created around 17:30 (5:30pm) between Blackburn and Forster
ramps due to the large number of cars entering the freeway from Forster ramp at that
time. The new coordinated FRS is intended to remove this bottleneck and increase the
flow and speed in this area.
• There is another bottleneck created near Warrigal Ramp due to high merging demand in
some days around 18:30. By extending the operating hours of the new coordinated FRS to
19:30, this bottleneck can be better managed.
Bottleneck 1
Bottleneck 2
Figure 12. PM Peak Typical Day (No Freeway Ramp Signals)
4.4.2.2 HERO
Figure 13 shows the speed contour plot for a typical day when the ramp signals were run by
the new coordinated FRS system (HERO). It could be observed that the Forster Road
bottleneck was removed and the average speed was increased in that area. In that day, no
bottleneck was created at the vicinity of Warrigal Road entry ramp.
Page 14 of 17Bottleneck 1 cleared
Figure 13 PM Peak Typical Day (HERO)
4.4.2.3 Comparison
Comparing the two systems average flow on the freeway between Blackburn Road and
Huntingdale Road shows an increase of 8 percent between 17:30 to 18:30 (from 1836
veh/h/lane with no Freeway Ramp Signals to 1990 veh/h/lane in HERO). Considering the
large percentage of heavy vehicles using this section of Monash Freeway, the passenger car
equivalent (pcu) flow of the new coordinated system is 2075 pcu/h/lane and a very good
outcome considering this section of freeway is currently under roadworks. There is still some
room for more growth as the demand increases.
Evaluating the performance of the two systems over five different days between 17:30 and
18:30, based on Austroads National Performance Indicators shows that:
• average travel speed has increased by 59 percent (from 50 km/h to 80. km/h);
• productivity has significantly improved. In the new system, 88 percent of the network has
100 percent productivity compared to 35 percent with no freeway ramp signals;
• variation from posted speed limits has significantly decreased. In the new system, 83
percent of the network has less than 20 percent variation from posted speeds compared to
13 percent with no freeway ramp signals; and
• reliability has significantly improved. In the new system, 60 percent of the network was
operating in “grade one” reliability compared to 23 percent with no freeway ramp signals.
4.4.3 Economic Benefits
Improved travel speed both in the AM and PM peak has resulted in a net savings of
approximately 5 minutes per vehicle over the 15km section which is equivalent to 1900
veh.hrs of delay savings per day. The daily economic benefits (travel time savings and
vehicle operating cost savings) were estimated to be around $94,000 per day. Consequently
the payback period against a cost of the project of $1M is 11 days.
Page 15 of 175 CONCLUSIONS
The evaluation of the new coordinated FRS system (Table 1 below) indicates that the primary
objectives of the system have been met. The new system has:
• Increased throughput by 5 percent in AM peak and 8 percent in PM peak, reaching to
2165 pcu/h/lane which is very close to the maximum possible throughput.
• Improved travel speed (and consequently travel time) by 35 percent in AM peak and 59
percent in PM peak.
• Significantly improved in all “Austroads National Performance Indicators” for both AM
and PM peak, as shown in Table 1.
• Balanced demands across multiple ramps rather than managing individual ramps hence,
providing equity of access and consistent traffic conditions on the freeway network by
balancing queues across the ramps using HERO algorithm.
• Ramps average exit flow have remained stable with little or no statistical change being
identified
Safety was not able to be evaluated at this stage as any improvements made by the new
system takes at least three years of crash data.
Table 1. Performance Summary of Different Freeway Ramp Signals Systems in AM and PM Peak
AM Peak PM Peak
Performance Indicators
Fixed HERO Improvement No FRS HERO Improvement
Time
Flow (pcu/h/lane) 2068 2165 +5% 1914 2074 +8%
Travel Speed (km/h) 48.9 66.0 +35% 50.2 79.6 +59%
100% Productivity (%) 29.4 72.3 +146% 34.5 87.9 +155%
Less than 20% Speed 26.3 65.4 +149% 13.4 82.6 +516%
Variation (%)
Grade One Reliability 22.4 40.8 +82% 23.1 59.5 +158%
It should be noted that the system has only six FRS in operation at this stage, and as more
FRS are added as part of the Monash – CityLInk – West Gate Upgrade, the freeway will be
able to be managed more effectively using the HERO system.
Page 16 of 17REFERENCES
1. R. Troutbeck. M. Su, J. Luk, “Austroads Report, National Performance Indicators for Network Operations” ,
RCNS1207-6, Aug 2007..
2. VicRoads Nov 2007, Monash-City Link-West Gate upgrade project, brochure
Page 17 of 17You can also read