INVESTOR UPDATE September 2021 - TSX & NYSE: ERF - Enerplus

Page created by Tyler Smith
 
CONTINUE READING
INVESTOR UPDATE September 2021 - TSX & NYSE: ERF - Enerplus
INVESTOR UPDATE
                      September 2021

TSX & NYSE: ERF
INVESTOR UPDATE September 2021 - TSX & NYSE: ERF - Enerplus
Forward looking information and statements
This presentation contains certain forward-looking information and statements ("forward-looking information") within the meaning of applicable securities laws. The use of any of the words "expect", "anticipate", "continue", "estimate",
“guidance”, "ongoing", "may", "will", "project", "plans", “budget”, "strategy" and similar expressions are intended to identify forward-looking information. In particular, but without limiting the foregoing, this presentation contains forward-looking
information pertaining to the following: anticipated completion of the Acquisition, including expected purchase price, terms, timing and completion thereof; expected benefits of the Acquisition; expected impacted of the Acquisition on
Enerplus' operations and financial results, including inventory of drilling locations, expected accretion to Enerplus' metrics (including expected free cash flow in 2021 and beyond and year-end net debt to adjusted funds flow ratio); Enerplus'
expected 2021 average production volumes and expected capital levels to support such production; anticipated production mix and Enerplus’ expected source of funding thereof; expected operating plans; oil and natural gas prices and
differentials; anticipated impact of the Acquisition on Enerplus' future costs and expenses; expected increase in the size of Enerplus’ credit facility; Enerplus' five year outlook, including expected capital spending levels and resulting
production, production growth and free cash flow, and plans for excess cash flow, including potential share repurchases.

The forward-looking information contained in this presentation reflects several material factors, expectations and assumptions including, without limitation: that we will conduct our operations and achieve results of operations as anticipated,
including considering the Hess asset and Bruin acquisitions; that our development plans will achieve the expected results; that lack of adequate infrastructure and/or low commodity price environment will not result in curtailment of
production and/or reduced realized prices beyond our current expectations ; current and estimated commodity price, differentials and cost assumptions; the general continuance of current or, where applicable, assumed industry conditions,
including expectations regarding the duration and overall impact of COVID-19; the continued ability to operate DAPL and lack of court order restricting its operation; that our development plans will achieve the expected results; the
continuation of assumed tax, royalty and regulatory regimes; the accuracy of the estimates of our reserve and contingent resource volumes; the continued availability of adequate debt and/or equity financing and adjusted funds flow to fund
our capital, operating and working capital requirements, and dividend payments as needed; the continued availability and sufficiency of our adjusted funds flow and availability under our bank credit facility to fund our working capital
deficiency; our ability to comply with our debt covenants; the availability of third party services; the extent of our liabilities; the rates used to calculate the amount of our future abandonment and reclamation costs and asset retirement
obligations; the availability of technology and processes to achieve environmental targets. In addition, Enerplus’ 2021 outlook contained in this presentation is based on the following rest of year prices: US$69/bbl WTI, US$3.92/Mcf NYMEX,
and a USD/CDN exchange rate of 1.26. Enerplus’ five-year outlook contained in this presentation is based on the following prices for 2022-2025: US$50/bbl and US$55/bbl WTI, US$2.75/Mcf NYMEX, and a USD/CDN exchange rate of 1.27.
Enerplus believes the material factors, expectations and assumptions reflected in the forward-looking information are reasonable but no assurance can be given that these factors, expectations, and assumptions will prove to be correct.

The forward-looking information included in this presentation is not a guarantee of future performance and should not be unduly relied upon. Such information involves known and unknown risks, uncertainties and other factors that may
cause actual results or events to differ materially from those anticipated in such forward-looking information including, without limitation: continued instability, or further deterioration, in global economic and market environment, including
from COVID-19; continued low commodity prices environment or further volatility in commodity prices; changes in realized prices of Enerplus’ products; changes in the demand for or supply of our products; failure to realize the anticipated
benefits of the Hess assets or Bruin acquisitions; unanticipated operating results, results from our capital spending activities or production declines; the legal proceedings in connection with DAPL; curtailment of our production due to low
realized prices or lack of adequate infrastructure; changes in tax or environmental laws, royalty rates or other regulatory matters; changes in our capital plans or by third party operators of our properties; increased debt levels or debt service
requirements; inability to comply with debt covenants under our bank credit facility and outstanding senior notes; inaccurate estimation of our oil and gas reserve and contingent resource volumes; limited, unfavourable or a lack of access to
capital markets; increased costs; a lack of adequate insurance coverage; the impact of competitors; reliance on industry partners and third party service providers; changes in law or government programs or policies in Canada or the United
States; and certain other risks detailed from time to time in our public disclosure documents (including, without limitation, those risks and contingencies described under "Risk Factors and Risk Management" in Enerplus’ 2020 MD&A and in
our other public filings).

The purpose of our estimated free cash flow disclosure, is to assist readers in understanding our expected and targeted financial results, and this information may not be appropriate for other purposes. Information in this presentation is
provided as of the date hereof and Enerplus assumes no obligation to update any forward-looking statements, unless otherwise required by law.

                                                                                                                                                                                                                                                       2
INVESTOR UPDATE September 2021 - TSX & NYSE: ERF - Enerplus
Enerplus overview
 Concentrated acreage position in the Bakken core

 Strong balance sheet and liquidity position                                                                                CDN
                                                                                                                         WATERFLOODS

 Robust free cash flow outlook

 Disciplined returns-based capital allocation
                                                                                                                               BAKKEN                          MARCELLUS

 Committed to strong ESG performance

2021e production by area (1)                          2021e production by product(1)                                            Dual listed: TSX & NYSE
                                                                                                                                Market capitalization: C$2.0 billion
                               28%                                                                                              2021e production: 113,500 BOE/d (62% liquids)(1)
 63%                                                     62%

                              6%                                                       38%
                           3%
   Bakken               Marcellus
                                                             Liquids       Natural Gas
   Waterfloods          Other
                                                                                                                                                                          3
 1) Production is based on the guidance mid-point. Not adjusted for Williston Basin divestment announced Aug 30, 2021.
INVESTOR UPDATE September 2021 - TSX & NYSE: ERF - Enerplus
2021 update

                                                                                   STRONG                                   Company record production of 115,350 BOE/d in Q2, up 26% q-o-q
                                                                                   PRODUCTION                               2021 annual average guidance now 112,000 to 115,000 BOE/d(1)

                                                                                   FREE CASH FLOW                           Generated ~$55MM in free cash flow in Q2
                                                                                   GENERATION                               Estimate >$450MM in free cash flow in 2021(2)

                                                                                   FINANCIAL                                Allocating ~90% of FCF, after dividends, to debt reduction in near term
                                                                                   FLEXIBILITY                              $400MM debt target expected to be achieved by end of Q1 2022(3)

                                                                                                                            Dividend increased 15%, share buyback program reinitiated
                                                                                   INCREASING
                                                                                   RETURN OF CAPITAL                        Expectation of further increasing capital returns to shareholders once debt
                                                                                                                             target achieved

                                                                                   SOLID                                    Averaging >30% improvement in ND completions efficiency YTD vs 2020
                                                                                   EXECUTION                                Tracking 25% improvement in total ND well costs in 2021 vs 2019

1) Not adjusted for Williston Basin divestment announced Aug 30, 2021. Divestment expected to close end of October 2021.
2) Non-GAAP measure, see “Advisories”. Based on forward strip commodity prices at July 21, 2021 .                                                                                                   4
3) Based on current commodity price environment.
INVESTOR UPDATE September 2021 - TSX & NYSE: ERF - Enerplus
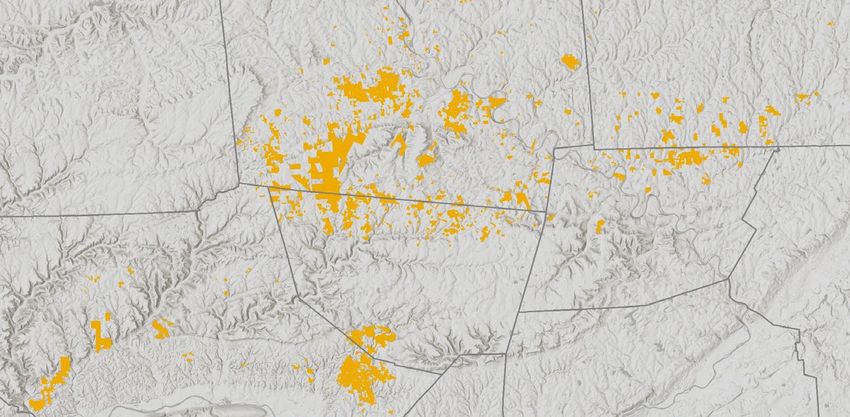
2021 operating outlook
     2021e total production                                                              2021e liquids production                                E&D capital spending
     (mboe/d)
                                                    +27.5                                (mbbl/d)
                                                                                                                                     +22.5       (C$ millions)
                                                                                                                                                                                     +$80MM
                                                    MBOE/d(1)                                                                        MBBL/d(1)
                                          112-115                                                                        69.5-71.5                                         $360-400

                    86                                                                                                                                    $300
                                                                                                          48

           Original guidance Current guidance                                                    Original guidance Current guidance                  Original guidance Current guidance
                             (post acquisitions)                                                                   (post acquisitions)                                 (post acquisitions)

1) Based on guidance mid-points. Guidance has not been adjusted for Williston Basin divestment announced Aug 30, 2021.

                                                                                                                                                                                             5
INVESTOR UPDATE September 2021 - TSX & NYSE: ERF - Enerplus
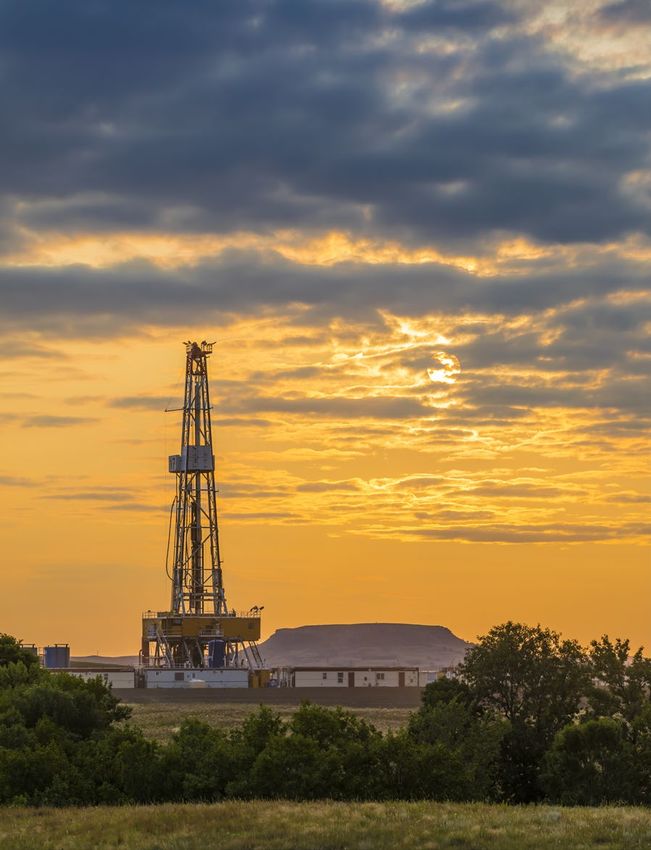
Strong liquidity position and line of sight to leverage target
Significant liquidity                                                                                                     Debt reduction target
Estimated liquidity position at June 30, 2021 (US$ millions)                                                              From Q2 2021 (C$ millions)
             Enerplus was the first North American E&P to transition its principal credit facility to a                                            Debt target expected to be achieved by end of Q1
             Sustainability Linked Credit Facility, incorporating ESG performance targets                                   $1,200                 2022 based on current commodity price environment
                                                                                                                                       $1,130
~US$700
                                                                                                                           $1,000

                                                                          TERM FACILITY                                      $800
                                                                      Avg. interest rate: 2.15%(1)
                                                                                                                                                                                 ~$730

                        Cash and                                                                                             $600
                                                                                 $400
                     undrawn portion                                                          SLL FACILITY
                     of US$900 SLL
                      Credit Facility
                                                                                           Avg. interest rate: 2.15%(1)
                                                                                                                             $400
                                                                                                                                                      ~$400MM
                                                                                                $270
                                                                                                                                                     Debt reduction target
                                                     SENIOR NOTES
                                                  Avg. interest rate: 4.4%                                                   $200
                                                   $101            $81            $81                             $21
                                     $0                                                              $21                       $0
 Liquidity                      H2 2021           2022           2023           2024            2025            2026                 Debt net of                               Debt net of
                                                                                                                                       cash                                       cash
        SLL Credit Facility               Senior Notes              Term Facility             SLL Drawn Amount                        Q2 2021                                    target

                                                                                                                                                                                              6
  1) Drawn fees are expected to be approximately 2.15% based on an underlying 3-month LIBOR rate of 0.1%
INVESTOR UPDATE September 2021 - TSX & NYSE: ERF - Enerplus
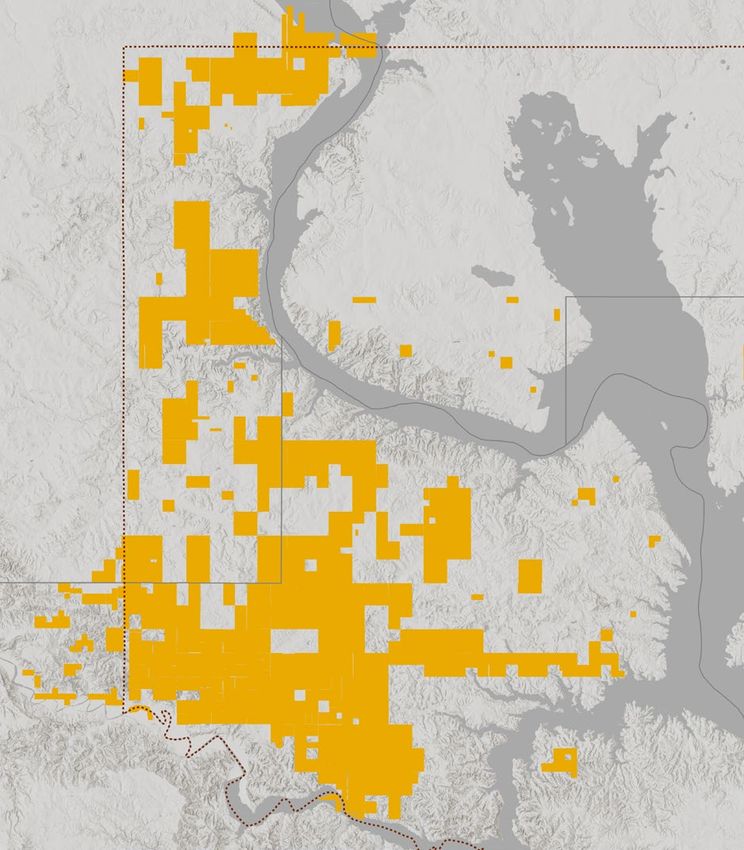
Capital allocation principles and framework
Principles                                         Framework                                                   Execution
                                                                                                                ~90% of free cash flow, after dividends, to debt
             MAINTAIN                              Long term ND/AFF ratio(1) target: 1.0x or less assuming       reduction until leverage target achieved
             LOW LEVERAGE                          US$50 WTI price environment                                  Targeting $400MM debt reduction from Q2 2021
                                                                                                                 (estimated to be achieved by end Q1 2022(2))

                                                                                                                On track to generate >$450MM in free cash flow
             GENERATE                              Long term capital spending reinvestment rate(1) of less       in 2021(1)(2)
             FREE CASH FLOW                        than 75% of adjusted funds flow
                                                                                                                2021 estimated reinvestment rate ~45%(1)(2)

                                                                                                                Dividend increased 27% YTD
             RETURN                                Sustainably grow base dividend supported by an increasing    ~10% of free cash flow, after dividends, to
             CAPITAL TO                            cash flow base. Consider share repurchases to further         incremental shareholder returns in near term.
             SHAREHOLDERS                          enhance the return of capital to shareholders                 Allocation of free cash flow to shareholders
                                                                                                                 expected to increase once debt target achieved

The key principles above and the macro environment will drive Enerplus’ disciplined approach to growth,
maximizing free cash flow and shareholder returns
1) Non-GAAP measure. See “Advisories”.                                                                                                                         7
2) Based on current commodity price environment.
INVESTOR UPDATE September 2021 - TSX & NYSE: ERF - Enerplus
Five year outlook focused on free cash flow growth
   HIGHLIGHTS OF THE FIVE YEAR OUTLOOK
   (assumes constructive oil price: ~US$50-55+/bbl WTI)

   ANNUAL CAPITAL SPENDING                                                                                 ~$500 MM
                                                                                                                  (2022-2025)

   CUMULATIVE FREE CASH FLOW(1)                                                                      ~$1.5 to $2.0 Bn
                                                                                                                    (2021-2025)

  AVERAGE REINVESTMENT RATE(1)                                                                          ~55% to 60%
                                                                                                                   (2021-2025)

  ANNUAL LIQUIDS PRODUCTION GROWTH RATE                                                                     ~3% to 5%
                                                                                                                   (2022-2025)

1) Non-GAAP measure, see “Advisories”. 2021 is based on year to date commodity prices and forward strip for the remainder of the year. Years 2022-   8
  2025 are based on WTI oil prices of US$50-$55/bbl and NYMEX natural gas prices of US$2.75/Mcf.
INVESTOR UPDATE September 2021 - TSX & NYSE: ERF - Enerplus
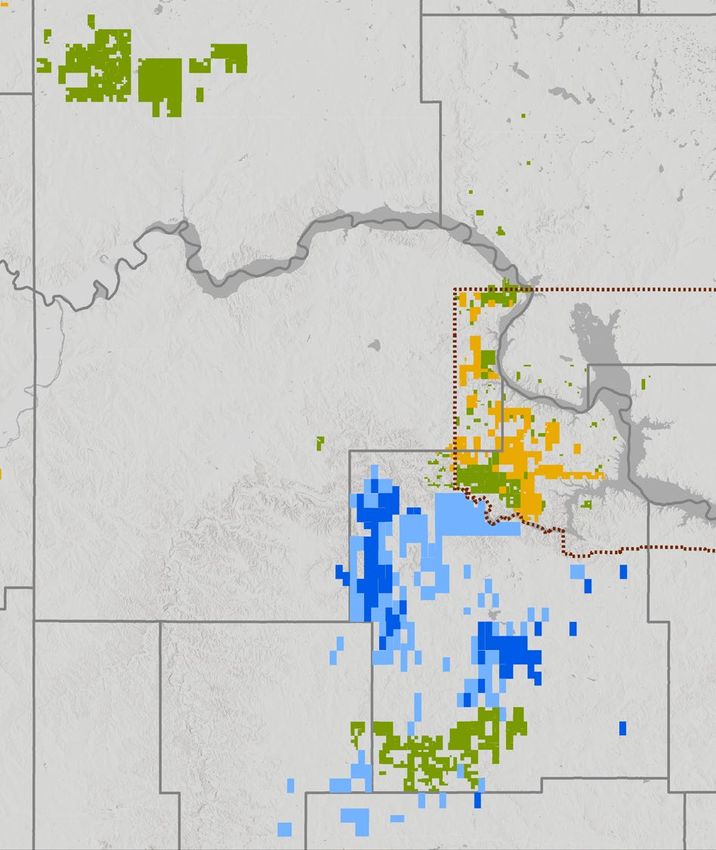
Strategic acquisitions improve Bakken scale
HIGHLIGHTS OF ACQUISITIONS                                                                                                                                                ENERPLUS NORTH DAKOTA POSITION

 3.5x increase in acreage position; now 238,000 net acres(1)                                                                                                                                                 Legacy Enerplus
                                                                                                                                                                                                              Bruin
                                                                                                                                                                                                              Dunn co. – op
         − 98,000 net acres (Bruin acquisition)(1)                                                                                                                         Williams                           Dunn co. – non op

         − 74,000 net acres (Dunn county acquisition acquired from Hess                                                      Corporation)(1)                                                                         Mountrail

                                                                                                                                                                                                                  Fort Berthold
 340 net identified economic drilling locations(1) added
         − Bruin: 111 locations (FBIR, eastern Williams), additional upside potential
         − Dunn county: 110 tier 1, 120 MB upside, TF upside potential                                                                                                      McKenzie

 ~30,000 BOE/d current production added
         − Bruin: 24,000 BOE/d (low 30% decline rate)
         − Dunn county production: 6,000 BOE/d (18% decline rate)
                                                                                                                                                                                                                     Dunn
                                                                                                                                                                                      Billings    DIVESTMENT
             Bruin acquisition                                                                Dunn county acquisition                                                                            Announced Aug 30,
             CLOSED March 10, 2021                                                            CLOSED April 30, 2021                                                                                    2021

1) Excludes the acreage sold in connection with the Williston Basin divestment announced Aug 30, 2021.                                                                                                                            9
2) See “Advisories – Drilling Inventory” for a reconciliation of undrilled locations between those associated with reserves and those not associated with any reserves.
INVESTOR UPDATE September 2021 - TSX & NYSE: ERF - Enerplus
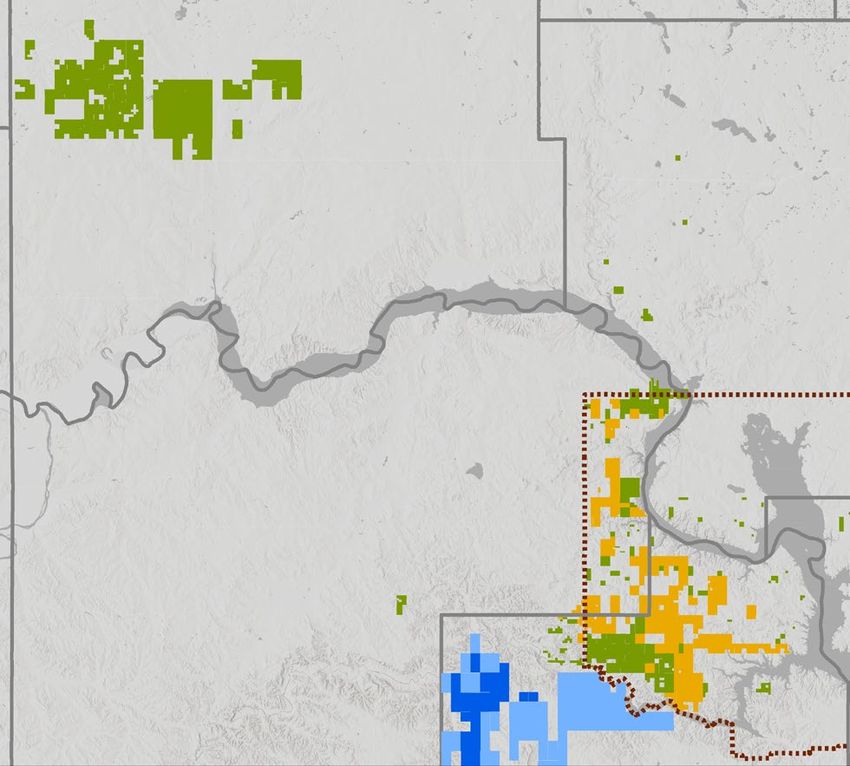
Acquisitions have extended high quality inventory
      Drilling inventory expansion(1)
      Net locations

                                                                                                                                                                             Non-FBIR development plan
                                                                                                                                               ~675
                                                                                                             120                                                             5-6 wells per spacing unit
                                                                                                                                                                              MB
                                                                                            110                                                                               TF 1                                              Upside

                                                        60
                                       51
                                                                                                                                                                             FBIR development plan per spacing unit
                    333                       Bruin acquisition                                   Dunn co. acquisition                                                       ~10 wells per spacing unit
                                                                                                                                                                               MB

                                                                                                                                                                               TF 1

                                                                     UPSIDE                                               UPSIDE                                               TF 2                              TF2 locations in select areas
                                                                    POTENTIAL                                            POTENTIAL

                                                                                                                                                                                                                                                 10
1) See “Advisories – Drilling Inventory” for a reconciliation of undrilled locations between those associated with reserves and those not associated with any reserves. As at 1 Jan 2021. Includes drilled uncompleted wells.
ENVIRONMENTAL, SOCIAL & GOVERNANCE
   Material focus areas
                                                                                                                                                                                     Water Management
                                                                                          2020
TARGETS           (1)
                                                                                          PERFORMANCE (1)
GHG emissions intensity reduction targets(2)                                                24%
  2022 target: 20% reduction in methane emissions                                          Emissions intensity                                                                                                                 Community
  2030 target: 50% reduction                                                               reduction in 2020                                      Greenhouse Gas
                                                                                                                                                      Emissions                                                                 Engagement
                                                                                                                                                                                                ESG
Freshwater use reduction targets                                                                                                                                                            MATERIAL
                                                                                            23%
  2021 target: 25% reduction/well comp. in FBIR                                            Freshwater use reduction
                                                                                                                                                                                             FOCUS
  2025 target: 50% reduction/well comp. corporately                                        per completion in 2020                                                                           AREAS

Health & Safety target                                                                                                                          Board Constitution                                                                    Culture
                                                                                            67%                                                     & Culture
  Reduce LTIF(3) by 25% on average, between 2020-                                          LTIF(3)   reduction in 2020
   2023

                                                                                                                                                                                         Health & Safety
 1) Targets and 2020 performance are relative to a 2019 baseline.
 2) Enerplus’ GHG emissions reduction targets address scope 1 and 2 emissions. Scope 1 emissions are direct emissions from owned and operated facilities. Scope 2 emissions are indirect emissions from the generation of purchased
    energy for the Company’s owned and operated facilities. Targets are relative to a 2019 baseline.                                                                                                                                      11
 3) Lost Time Injury Frequency.
TRACK RECORD
  High return growth, free cash flow and low leverage
High return oil growth              Focus on free cash flow                 Return of capital                   Low financial leverage
Production, MBOE/d                  Free cash   flow(1),   C$ millions      C$ millions                         Net debt to adjusted funds flow ratio(1)

8%                                  >$380MM                                 >$370MM                             1.0x
3-year liquids                      Cumulative free cash                    Returned to shareholders            Leverage ratio at Dec 31, 2020
production CAGR since 2017          flow since 2017                         since 2017                          3x
                      101                                            $382
            93                 91                              $67
 85
                      46                             $90
            43                                                                                                  2x
                               40
 44
                                                                                              $179
                                          $160
                                                                                                                                                 1.0x
                                                                                      $79                       1x
                      55
                                                                                                                       0.6x             0.6x
            50                 51
  41                                                                                                    $3                     0.4x
                                    $66
                                                                             $29      $29      $28     $27
                                                                                                                0x
 2017      2018       2019   2020   2017 2018 2019 2020 Total                2017    2018     2019    2020             2017    2018     2019    2020
       Liquids        Natural gas                                            Dividends      Share repurchases
                                                                                                                                                  12
1) Non-GAAP measure
OPERATIONS UPDATE

                    13
ENERPLUS NORTH DAKOTA WELL COST PERFORMANCE
             Solid execution delivering capital efficiency gains
         Drilling efficiency gains
         Drilling days vs. depth (spud to rig release)(1)
                                                                   Days
                       0            2           4           6            8            10   12          14
                  0                                                                                                               Total well costs
              3,000                                                                             2018 Avg                          (US$MM)(1)(2)
              6,000                                                                             2019 Avg
                                                                                                             >20%   IMPROVEMENT
Depth (ft)

              9,000                                                                             2020 Avg            SINCE 2018        $7.6
             12,000                                                                             2021 H1
             15,000                                                                             Pacesetter
             18,000
             21,000

                                                                                                                                                                 $5.7
         Completion efficiency gains
         Stages per day
                                                                             12.8
                                                                                                15.3
                                                                                                                                                     25%
                                                 9.5                                                                                                 WELL COST
                      6.7                                                                                    >90%   IMPROVEMENT
                                                                                                                    SINCE 2019
                                                                                                                                                     REDUCTION

                  2019                        2020                     2021                Pacesetter                                2019                        2021e
                 Average                     Average                Average YTD               pad
             1) Based on two-mile lateral wells.                                                                                                                         14
             2) Total well cost includes drilling, completion and facilities costs.
FORT BERTHOLD WELL PERFORMANCE
 Maintaining strong well performance at lower cost
 Enerplus Fort Berthold well performance                                                                                      ENERPLUS FBIR RECENT COMPLETIONS
 Cumulative oil production per well (Mbbl)

500                US$2.4MM
                     REDUCTION
400                   IN WELL COSTS
                      SINCE 2017(1)

300

200                                                                                                                                                    BELFORD PAD
                                                                                                                                                 Onstream Q2 2021 (6 wells)

100

 -                                                                                                                                                                            IGNEOUS PAD
      0                100                200             300                      400           500          600    METAMORPHIC PAD                                    Onstream Q2 2021 (9 wells)
                                                                                                                    Onstream Q2 2021 (5 wells)
                                                     Producing days
        2017 wells               2018 wells             2019 wells                  2020 wells         2021 wells
        2017 Avg                 2018 Avg               2019 Avg                    2020 Avg           2021 Avg
                                                                                                                                                                                          15
  1) Well costs in 2017 averaged US$8.1mm compared to US$5.7mm expected in 2021.
MARCELLUS OVERVIEW
     Core acreage position in the Marcellus dry gas window
                                                                                                                                                                   MARCELLUS POSITION – NE PENNSYLVANIA
    Non-operated position in Marcellus dry gas core                                                                                                                                        Bradford                                Susquehanna
           − 32,600 net acres, ~200 MMcf/d                                        production(1)
    Capital efficient and highly productive well performance
           − >10 year drilling inventory(2)                                                                                                                                                                                 Wyoming
                                                                                                                                                                                                Sullivan
    High quality exposure to improving natural gas prices
                                                                                                                                                                Lycoming
           − Consistent free cash flow generation

  Marcellus production & capex                                                                Marcellus pricing exposure                                               Marcellus unhedged annual net operating income
 MMcf/d and US$ millions                                                                      Approx. % of natural gas sales                                           Sensitivity to NYMEX (US$ millions)                                $122
                                                                                                                                                 26%
 300                                                                       $75                                                                                                                                          $96
        $45     $51                                                                               Leidy
 200                     $37                                               $50                                                                                                                      $70
                                                            $35-$40                               TZ6 Non-NY
                                                   $24                                                                       US$0.65/Mcf                                        $43
  100                                                                      $25                    Gulf Coast                  2021e portfolio
              198         208          227         193      195-200                                                          differential below        19%
     0                                                                     $0                     Other                           NYMEX
             2017       2018     2019             2020   2021e                                                     52%                                                        $2.50               $3.00                $3.50             $4.00
                      Production                     Capex                                                                                          3%
                                                                                                                                                                                             NYMEX Benchmark Price (US$/Mcf)
                                                                                                                                                                                                                                              16
1) Enerplus working interest production.
2) 56 net future drilling locations as at December 31, 2020. Includes 23.7 proved plus probable undeveloped reserves locations and drilled uncompleted wells, and 32.6 best estimate contingent resources locations. See “Advisories”.
MARCELLUS WELL RESULTS
          Capital efficient and highly productive drilling inventory
          Marcellus well performance 2018-2021(1)
          Average cumulative well production per 1,000 ft lateral
                                                                                                                                                                Avg.
                       0.8                                                                                                                                     8,200      ~20% INCREASE
                                                                                                                                                             lateral ft   IN 6-MONTH CUMULATIVE PRODUCTION /
                       0.7
                                                                                                                                                                Avg.      LATERAL FT IN 2021 VS 2018
                       0.6                                                                                                                                    9,200
                                                               Avg. 10,600                                                                                   lateral ft
Bcf/1,000 ft lateral

                       0.5                                      lateral ft                                                                                      Avg.
                                                                                                                                                              6,300
                       0.4                                                                                                                                   lateral ft
                       0.3

                       0.2

                       0.1

                        0
                             1        2           3           4          5     6       7      8                         9         10           11       12
                                                                          Months on production
                                                             2018                 2019                 2020                  2021
                                                                                                                                                                                                        17
        1) Enerplus’ average working interest in the Marcellus wells is 4.4% in 2021, 3.3% in 2020, 9.7% in 2019, 9.2% in 2018 (production weighted).
APPENDIX

           18
2021 guidance, operating statistics and well economics
  2021 GUIDANCE(1)                                                                                                                             WELL ECONOMICS
  E&D capital spending        (C$MM)(2)                                                                              $360-400                  BAKKEN - FORT BERTHOLD(1)

  Total production (Mboe/d)                                                                                               112-115              WTI oil price                                           US$50/bbl                   US$60/bbl

  Liquids production (Mbbl/d)                                                                                          69.5-71.5               Payout                                                    1.5 years                  0.9 years
                                                                                                                                               IRR:                                                        60%                        100%+
  Avg. royalty & production tax rate                                                                                          26%
                                                                                                                                               Breakeven (10% IRR)                                                 US$38/bbl WTI
  Operating expense ($/boe)                                                                                                  $8.25
                                                                                                                                               MARCELLUS(2)
  Transportation expense ($/boe)                                                                                             $3.85
                                                                                                                                               NYMEX natural gas price                               US$3.00/Mcf                  US$3.50/Mcf
  Cash G&A expense ($/boe)                                                                                                   $1.25
                                                                                                                                               Payout                                                   2.0 years                    1.4 years
  Current income tax expense (US$MM)                                                                                         $5-7
                                                                                                                                               IRR                                                         50%                         90%
  Bakken oil price differential compared to WTI (US$/bbl)                                                                 $(2.35)              Breakeven (10% IRR)                                             US$2.30/Mcf NYMEX
  Marcellus natural gas price differential compared to NYMEX (US$/Mcf)                                                   $(0.65)              1) Fort Berthold well economics are based on the average 2P reserves booked per undeveloped location for
                                                                                                                                                a 2-mile lateral (~730 mboe) and a total well cost of US$5.7MM.
                                                                                                                                              2) Marcellus well economics are based on the average 2P reserves booked per undeveloped location (~18
  2021 ASSET DETAILS(3)                        BAKKEN               MARCELLUS                 CANADA                DJ BASIN                    Bcf/well, 7,400 ft lateral) and a total well cost of US$6.3MM.

  Capital allocation     (approx.)(2)             76%                     12%                     6%                    6%

  Wells drilled (gross)                          19-23                  54-66                    2                       -
                                               (~99% WI)               (~5% WI)              (~15% WI)
  Wells online (gross)                          42-50                   64-72                    2                      3
                                              (~80% WI)                (~7% WI)              (~15% WI)              (~87% WI)
1) Guidance has not been adjusted for Williston Basin divestment announced Aug 30, 2021 (~3 MBOE/d). Closing end of October 2021.                                                                                                             19
2) Capital spending includes capitalized G&A.
3) Wells drilled and completed are based on operated activity only except for the Marcellus and Canada which include non-operated activity.
BRUIN ACQUISTION
                        Strong well performance in FBIR & Williams Co. acreage
           Enerplus and Bruin North Dakota well performance                                                                   ENERPLUS NORTH DAKOTA POSITION
           Average cumulative oil production per well since 2019
                                                                                                                                                      Legacy Enerplus
                        250                                                                                                                           Bruin
                                                                                                                                                      Dunn co. – op
                                                                                                                  62 WELLS                            Dunn co. – non op
                                                                                                                  30 WELLS                 Williams
                        200                                                                                        12 WELLS
Oil production (mbbl)

                        150                                                                                                                                   Fort Berthold

                                                                      Line of sight to lower cost structures in
                                                                      Williams Co. acreage due to shallower
                        100                                           depths and lower ancillary costs                          McKenzie

                         50

                         0
                              0   50         100    150       200         250          300          350
                                                     Producing days
                                  Enerplus - FBIR    Bruin - FBIR         Bruin - Williams Co.
                                                                                                                                                                          20
DUNN COUNTY ACQUISITION
Active proximal development delivering strong results
  OFFSET OPERATOR DEVELOPMENT (2018+)                    Active DSU development in Middle Bakken and Three Forks by offset operators(1)

                                                                                                                 2 Continental Resources-Carus Pad: 4 MB / 5 TF

                                  Fort Berthold
                                                      1 ExxonMobil-Jorgenson Pad: 2 MB / 3 TF
                                                         Development Spacing (wells/mi)            6 MB / 6 TF      Development Spacing (wells/mi)                  6 MB / 6 TF
                      1                                  Completion Date:                             2019          Completion Date:                                   2019
                                                         Avg. Proppant Loading (lbs/ft):              799           Avg. Proppant Loading (lbs/ft):                    1249
                                                         Avg. Fluid Loading (Bbs/ft):                  38           Avg. Fluid Loading (Bbs/ft):                        26
                                                         Avg MB / TF 6 Month Oil Cum (MBbl)         100 / 86        Avg MB / TF 6 Month Oil Cum (MBbl)               166 / 149
                          2
              3                                       3 ConocoPhillips-Franklin Pad: 2 MB / 3 TF                 4 Continental Resources-Nadia Pad: 4 MB / 4 TF
                                                         Development Spacing (wells/mi)            5 MB / 5 TF      Development Spacing (wells/mi)                  6 MB / 7 TF
                                                         Completion Date:                             2019          Completion Date:                                   2020
                                                         Avg. Proppant Loading (lbs/ft):               833          Avg. Proppant Loading (lbs/ft):                    949
                                                         Avg. Fluid Loading (Bbs/ft):                   18          Avg. Fluid Loading (Bbs/ft):                        20
                  4                                      Avg MB / TF 6 Month Oil Cum (MBbl)         116 / 89        Avg MB / TF 6 Month Oil Cum (MBbl)                   -

                          5                           5 Marathon Oil-Northrop Pad: 4 MB / 0 TF                   6 Continental Resources-Marshal Pad: 2 MB / 1 TF
             6                                           Development Spacing (wells/mi)            6 MB / TF        Development Spacing (wells/mi)                  6 MB / 6 TF
                                                  7      Completion Date:                            2018           Completion Date:                                   2020
                                                         Avg. Proppant Loading (lbs/ft):              616           Avg. Proppant Loading (lbs/ft):                    734
                                                         Avg. Fluid Loading (Bbs/ft):                  17           Avg. Fluid Loading (Bbs/ft):                        16
                                                         Avg MB / TF 6 Month Oil Cum (MBbl)          153 /          Avg MB / TF 6 Month Oil Cum (MBbl)                97 / 57

                                                      7 Marathon Oil-Pletan Pad: 2 MB / 2 TF
                                                         Development Spacing (wells/mi)            6 MB / 5 TF
                                                         Completion Date:                             2019
Existing Enerplus                                        Avg. Proppant Loading (lbs/ft):               760
Acquired acreage – operated                              Avg. Fluid Loading (Bbs/ft):                   19
Acquired acreage – non operated                          Avg MB / TF 6 Month Oil Cum (MBbl)         148 / 135                                                        21
                                                         1) Source: Enervus.
Bakken egress and oil price differential outlook
Bakken oil production & takeaway capacity(1)
Millions of bbl/d
                                                                                                                                                   DAPL
2.8                                                                                                                                                expansion to
                                                               ~400 mb/d of incremental rail capacity would be                                     750 mb/d            BAKKEN DIFFERENTIAL
2.4                                                            required to clear the basin if DAPL cannot flow.                                    Aug 2021                   (BELOW WTI)
                                                               Estimated that:
2.0                                                                 ~300 mb/d available in the near term                                                                     2021 OUTLOOK
                                                                    ~100 mb/d available per month thereafter

1.6
                                                                                                                                                                             US$2.35/BBL
                                  Excess rail loading capacity(3)                                     Production(2)                                                       (ASSUMES DAPL OPERATIONAL)

 1.2
                                                                                                      DAPL
0.8
                                                                                                      Pipelines (ex DAPL)
0.4
                                                                                                      Rail volumes(3)
0.0
                Jun-14

                                   Jun-15

                                                      Jun-16

                                                                           Jun-17

                                                                                             Jun-18

                                                                                                               Jun-19

                                                                                                                                          Dec-20

                                                                                                                                                              Dec-21
       Dec-13

                         Dec-14

                                            Dec-15

                                                                  Dec-16

                                                                                    Dec-17

                                                                                                      Dec-18

                                                                                                                        Dec-19

                                                                                                                                 Jun-20

                                                                                                                                                     Jun-21
1) Source: NDIC, company estimates.
2) Production on chart is shown net of local refining demand.                                                                                                                                          22
3) Forecast rail volumes assume 175 mb/d are contracted going forward. Excess rail loading capacity is based on NDIC data.
CANADIAN OIL WATERFLOOD PORTFOLIO
 Consistent, low decline production

  Assets under water or polymer flooding                                                                    CANADIAN WATERFLOODS

  Portfolio optimized to focus on highest return, strong                                     ANTE CREEK

   cash flow generating assets
  Portfolio consistently generates free cash flow                                                                        GILTEDGE

        − ~$200MM in free cash flow since 2017(1)                                                                CADOGAN             Saskatchewan

  Low decline production
                                                                                                                      MEDICINE HAT
        − Q2 2021 production was ~7,240 BOE/d (95% oil)
                                                                                          British Columbia      Alberta                       FREDA LAKE
        −
EMERGING OPPORTUNITY – DJ BASIN
Northern extension of Wattenberg field
                                                                                             DJ BASIN
 ~38,000 net acres in NW Weld County                                            WYOMING

   − Low entry price achieved through leasing and farm-in activity               COLORADO      2017/2018 - 5 wells online
                                                                                               (4 Codell, 1 Niobrara)
   − Significant oil in place through all Niobrara benches and Codell
                                                                                               2019 - 5 wells online
                                                                                               (4 Codell, 1 Niobrara)
 Initial well results compare favorably to core DJ oil rates
                                                                                               2020 - 2 wells online
                                                                                               (2 Codell)
 Focused on enhancing well economics through further drilling
                                                                                               2021 – 3 wells online
  & completion optimization                                                           WELD
                                                                                               (3 Codell)

 2021 operated activity focused on completing DUCs                                                                     MORGAN

                                                                                                               ADAMS

                                                                        DENVER

                                                                                                                                 24
COMMODITY HEDGING SUMMARY
         Price risk management
     CRUDE OIL HEDGES (WTI)(1)
                                               ERF Swaps                              Bruin Swaps(2)                                            ERF Three-way Collars                                                         Bruin Collars(2)

     Period
                                                                                                                                                                Purchased                                                       Purchased
                                      Volume              Swaps              Volume               Swaps                  Volume           Sold Put                                       Sold Call            Volume                               Sold Call
                                                                                                                                                                   Put                                                             Put
                                     (Mbbl/d)           (US$/bbl)           (Mbbl/d)            (US$/bbl)               (Mbbl/d)         (US$/bbl)                                      (US$/bbl)            (Mbbl/d)                             (US$/bbl)
                                                                                                                                                                (US$/bbl)                                                       (US$/bbl)

     Jul 1 – Dec 31, 2021                 -                  -                8.465               $42.52                   23.0            $36.39                 $46.39                  $56.70                  -                   -                  -

     Jan 1 – Dec 31, 2022                 -                  -                3.828               $42.35                   17.0            $40.00                 $50.00                  $57.91                  -                   -                  -

     Jan 1 – Oct 31, 2023                 -                  -                0.250               $42.10                     -                 -                      -                      -                   2.0               $5.00           $75.00

     Nov 1 – Dec 31, 2023                 -                  -                   -                   -                       -                 -                      -                      -                   2.0               $5.00           $75.00

     NATURAL GAS HEDGES (NYMEX)
                                                                                  ERF Swaps                                                                                               ERF Collars

     Period                                                      Volume                           Swaps                                 Volume                             Sold Put                       Purchased Put                       Sold Call
                                                                 (Mcf/d)                        (US$/Mcf)                               (Mcf/d)                           (US$/Mcf)                         (US$/Mcf)                        (US$/Mcf)

     Jul 1 – Oct 31, 2021                                        60,000                            $2.90                                40,000                              $2.15                               $2.75                            $3.25

     Nov 1, 2021 – Mar 31, 2022                                     -                                -                                  40,000                                -                                 $3.43                            $6.00

1)      The total average deferred premium spent on these hedges is US$0.87/bbl from July1, 2021 to December 31, 2021 and US$1.22/bbl from April 1, 2022 to December 31, 2022. Transactions with a common term have
        been aggregated & presented at weighted average prices & volumes.
2)      Upon closing of the Bruin Acquisition, Bruin’s outstanding hedges were recorded at a fair value liability of $96.5 million. At June 30, 2021, the fair value of the Bruin hedges was a liability of $100.0 million. For the three
        and six months ended June 30, 2021 we recorded a realized loss of $2.2 million and $1.7 million, respectively, on the settlement of the Bruin hedges. In addition, we recognized an unrealized loss of $52.8 million and                             25
        $35.4 million, respectively, for the change in the fair value of the Bruin hedges over the same periods. See Note 17 to the Q2 2021 Financial Statements for further detail.
The Board of Directors
      Hilary A. Foulkes (Director since February 2014)         Susan M. MacKenzie (Director since July 2011)
                                                               Compensation & Human Resources Committee (Chair)
      Board Chair                                              Reserves, Safety & Social Responsibility Committee

     Judith D. Buie (Director since January 2020)              Elliott Pew (Director since September 2010)
     Audit & Risk Management Committee                         Previous Board Chair
     Corporate Governance & Nominating Committee
     Reserves, Safety & Social Responsibility Committee

     Karen E. Clarke-Whistler (Director since December 2018)   Jeffrey W. Sheets (Director since December 2017)
     Compensation & Human Resources Committee                  Audit & Risk Management Committee (Chair)
     Corporate Governance & Nominating Committee               Compensation & Human Resources Committee
     Reserves, Safety & Social Responsibility Committee

     Ian C. Dundas                                             Sheldon B. Steeves (Director since June 2012)
                                                               Audit & Risk Management Committee
     President and CEO                                         Reserves, Safety & Social Responsibility Committee (Chair)

     Robert B. Hodgins (Director since November 2007)
     Compensation & Human Resources Committee
     Corporate Governance & Nominating Committee (Chair)

                                                                                                                            26
ESG & Sustainability reporting

                                 6 YEARS
                                 OF ESG &
                                 SUSTAINABILITY
                                 REPORTING

                                                  27
Summary of operational and financial metrics
                                                 2018      Q1 2019       Q2 2019       Q3 2019       Q4 2019           2019      Q1 2020       Q2 2020     Q3 2020       Q4 2020         2020      Q1 2021   Q2 2021
Average Benchmark Prices
 WTI Crude Oil (US$/bbl)                     $     64.77   $     54.90   $     59.81   $     56.45   $     56.96   $     57.03   $     46.17   $   27.85   $     40.93   $   42.66   $     39.40   $ 57.84   $ 66.07
 NYMEX Natural Gas (US$/Mcf)                 $      3.09   $      3.10   $      2.64   $      2.23   $      2.50   $      2.63   $      1.95   $    1.72   $      1.98   $    2.66   $      2.08   $ 2.69    $ 2.83

Production(1)
 Oil (mbbl/d)                                     45,424        41,105        48,141        55,023        54,344        49,704        49,044    43,168          46,082    43,405          45,421    42,465    61,803
 Natural gas liquids (mbbl/d)                      4,486         4,383         4,720         5,098         5,502         4,929         5,346     4,929           6,457     5,790           5,633     6,581     9,890
 Natural Gas (MMcf/d)                            259,837       258,568       287,000       282,360       285,537       278,451       262,913   235,579         230,895   222,292         237,857   255,749   261,945
 Total (MBOE/d)                                   93,216        88,583       100,694       107,181       107,436       101,042        98,209    87,360          91,022    86,244          90,697    91,671   115,351

 % Crude oil and natural gas liquids                54%           51%           52%           56%           56%           54%           55%         55%           58%         57%           56%        54%       62%

Selected Financial Results (C$/BOE)
 Oil and natural gas sales(2)                $     47.35  $      44.70  $      44.00  $      40.75  $      41.64  $      42.65  $ 31.96  $         19.53  $ 28.65  $         30.60  $      27.82  $ 43.55   $ 48.60
 Royalties and production taxes              $    (11.92) $     (10.48) $     (11.26) $     (10.80) $     (10.93) $     (10.88) $ (8.16) $         (5.15) $ (7.36) $         (7.67) $      (7.12) $ (10.66) $ (12.58)
 Commodity hedging                           $     (1.05) $       1.32  $      (0.13) $       0.53  $       0.07  $       0.42  $  3.69  $          6.73  $  2.36  $          3.12  $       3.95  $ (2.35) $ (3.53)
 Operating expenses                          $     (7.00) $      (8.75) $      (7.84) $      (7.06) $      (8.05) $      (7.88) $ (8.84) $         (6.84) $ (7.78) $         (8.20) $      (7.94) $ (7.82) $ (8.43)
 Transportation costs                        $     (3.63) $      (3.92) $      (4.02) $      (3.96) $      (3.82) $      (3.93) $ (3.95) $         (4.28) $ (3.85) $         (3.89) $      (3.99) $ (3.98) $ (3.45)
 Netback(3)                                  $     23.75  $      22.87  $      20.75  $      19.46  $      18.91  $      20.38  $ 14.70  $          9.99  $ 12.02  $         13.96  $      12.72  $ 18.74   $ 20.61
 Cash general and administrative expenses    $     (1.47) $      (1.55) $      (1.26) $      (1.19) $      (1.34) $      (1.32) $ (1.37) $         (1.14) $ (1.40) $         (1.46) $      (1.35) $ (1.59) $ (1.04)
 Cash share-based compensation               $     (0.01) $      (0.17) $       0.07            -   $       0.01  $      (0.02) $  0.31  $         (0.15) $  0.09  $         (0.11) $       0.04  $ (0.33) $ (0.22)
 Interest, FX and other                      $     (0.92) $      (0.68) $      (0.79) $      (0.49) $      (0.89) $      (0.72) $ (0.97) $         (1.69) $ (0.82) $         (0.81) $      (1.06) $ (1.30) $ (1.39)
 Current inome tax recovery                  $      0.80  $       0.69  $       1.52            -   $       1.41  $       0.91  -        $          1.81  $  0.02  $           -    $       0.44  -         $ (0.40)
 Adjusted Funds Flow(3)                     $      22.15 $       21.16 $       20.29 $       17.78 $       18.10 $       19.23 $ 12.67 $            8.82 $   9.91 $          11.58 $       10.79 $ 15.52 $ 17.56

Notes:
(1) Based on Company interest production volumes. See "Basis of Presentation" section in the MD&A.
(2) Before transportation costs, royalties and the effects of commodity price derivatives.
(3) Please see "Non-GAAP Measures" section in the MD&A.

                                                                                                                                                                                                               28
Advisories
                                                         Assumptions
Investor Relations Contacts                              All amounts in this presentation are stated in Canadian dollars unless otherwise specified. All financial information in this presentation has been prepared and presented in accordance with U.S. GAAP, except as noted below under
                                                         “Non-GAAP Measures”.
Drew Mair
                                                         Barrels of Oil Equivalent and Cubic Feet of Gas Equivalent
Manager, Investor Relations &                            This presentation also contains references to "BOE" (barrels of oil equivalent), “MBOE” (one thousand barrels of oil equivalent), and “MMBOE” (one million barrels of oil equivalent). Enerplus has adopted the standard of six thousand
Corporate Planning                                       cubic feet of gas to one barrel of oil (6 Mcf: 1 bbl) when converting natural gas to BOEs. BOE, MBOE and MMBOE may be misleading, particularly if used in isolation. The foregoing conversion ratios are based on an energy
403-298-1707                                             equivalency conversion method primarily applicable at the burner tip and do not represent a value equivalency at the wellhead. Given that the value ratio based on the current price of oil as compared to natural gas is significantly
                                                         different from the energy equivalent of 6:1, utilizing a conversion on a 6:1 basis may be misleading.

Krista Norlin                                            Non-GAAP Measures
Sr. Investor Relations Analyst                           In this presentation, Enerplus uses the terms "adjusted funds flow", “free cash flow” (including per share measures), “net debt to adjusted funds flow ratio”, and “reinvestment rate” as measures to analyze operating and financial
403-298-4304                                             performance. “Adjusted funds flow” is calculated as net cash generated from operating activities but before changes in non-cash operating working capital and asset retirement obligation expenditures. “Free cash flow” is defined as
                                                         “Adjusted funds flow less exploration and development capital spending”. “Net debt to adjusted funds flow ratio” is calculated as total debt net of cash divided by a trailing twelve months of adjusted funds flow. “Reinvestment rate”
                                                         is calculated as exploration and development capital spending divided by adjusted funds flow..
Email:
investorrelations@enerplus.com                           Enerplus believes that, in addition to net earnings and other measures prescribed by U.S. GAAP, the terms "adjusted funds flow", “free cash flow” (including per share measures), “net debt to adjusted funds flow ratio”, and
                                                         “reinvestment rate” are useful supplemental measures as such provide an indication of the results generated by Enerplus' principal business activities. However, these measures are not recognized by U.S. GAAP and do not have a
                                                         standardized meaning prescribed by U.S. GAAP. Therefore, these measures, as defined by Enerplus, may not be comparable to similar measures presented by other issuers.

   Presentation of Production and Reserves Information
   All production volumes and revenues presented herein are reported on a “company interest” basis, before deduction of Crown and other royalties, plus Enerplus’ royalty interest with the exception of production utilized to calculate reserves replacement ratios which are on a working
   interest basis. Unless otherwise specified, all reserves volumes in this presentation (and all information derived therefrom) are based on "gross reserves" using forecast prices and costs. "Gross reserves" (as defined in NI 51-101), are Enerplus' working interest before deduction of any
   royalties. Enerplus’ oil and gas reserves statement for the year ended December 31, 2020, which will include complete disclosure of our oil and gas reserves and other oil and gas information in accordance with NI 51-101, is contained within our Annual Information Form (AIF) for the year
   ended December 31, 2020 which is available on our website at www.enerplus.com and under our SEDAR profile at www.sedar.com. Additionally, our AIF forms part of our Form 40-F that is filed with the U.S. Securities and Exchange Commission and is available on EDGAR at
   www.sec.gov. Readers are also urged to review the Management’s Discussion & Analysis and financial statements filed on SEDAR and as part of our Form 40-F on EDGAR concurrently with this presentation for more complete disclosure on our operations. All references to “liquids” in
   this presentation include light and medium crude oil, heavy oil and tight oil (all together referred to as “crude oil”) and natural gas liquids on a combined basis.

   Drilling Inventory
   Drilling locations associated with proved plus probable undeveloped reserves have been evaluated or reviewed by Enerplus’ independent qualified reserves evaluators in accordance with the COGE Handbook. Drilling locations associated with unrisked “best estimate” economic
   contingent resources in “development pending” project maturity sub-class pertaining to North Dakota have been evaluated by internal qualified reserves evaluators and audited by Enerplus’ independent qualified reserves evaluators, McDaniel & Associates Ltd, in accordance with the
   COGE Handbook. Unbooked future drilling locations are not associated with any reserves or contingent resources of Enerplus and have been identified by internal qualified reserves evaluators and have not been audited by Enerplus’ independent qualified reserves evaluators. Existing
   Enerplus net locations are as at 1 Jan 2021 and comprise 287 2P undeveloped reserves locations (includes drilled uncompleted wells), 136 best estimate contingent resources locations and 251 unbooked future locations.

                                                                                                                                                                                                                                                                                              29
You can also read