Restarting Silver Operations at Keno Hill - More Ounces - Lower Costs - September 2014 - Denver Gold Group
←
→
Page content transcription
If your browser does not render page correctly, please read the page content below
Alexco Corporate Presentation
September 2014                                 NYSE-MKT: AXU
                                               TSX: AXR

   Restarting Silver Operations at Keno Hill
               More Ounces – Lower Costs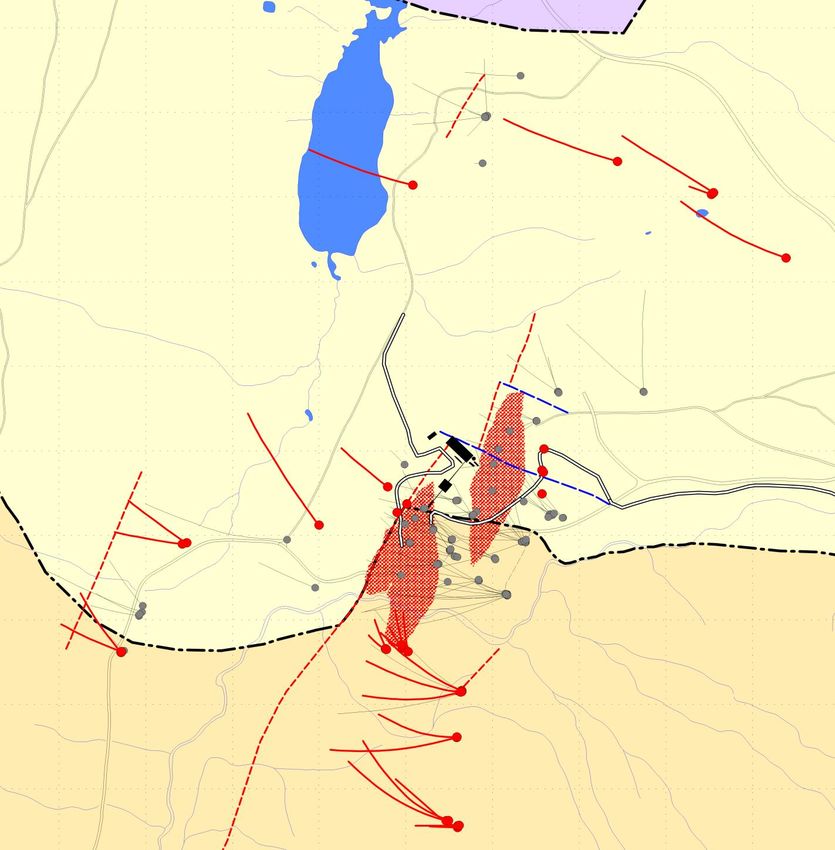
Forward Looking Statement
This presentation contains forward-looking statements within the meaning of the United States Private Securities Litigation Reform Act of 1995 and forward-looking
information within the meaning of applicable Canadian securities laws (together, “forward-looking statements”) concerning Alexco's business plans, including but
not limited to anticipated results and developments in Alexco’s operations in future periods, planned exploration and development of its mineral properties, plans
related to its business and other matters that may occur in the future, made as of the date of this presentation. Alexco does not intend, and does not assume any
obligation, to update these forward-looking statements, except as required by applicable law.
Forward-looking statements may include, but are not limited to, statements with respect to any proposed offering, anticipated closing of any proposed offering,
potential exercise by the Underwriter of any over-allotment option, anticipated use of proceeds, the amendment to the Silver Purchase Agreement, its impact on
Alexco and the Keno Hill Silver District and the parties’ rights, obligations and conditions thereunder, including Alexco’s condition to pay Silver Wheaton US$20
million and obtain regulatory approvals for any financing related thereto, future remediation and reclamation activities, future mineral exploration, the estimation of
mineral reserves and mineral resources, the realization of mineral reserve and mineral resource estimates, future mine construction and development activities,
future mine operation and production, the anticipated timing of making a production decision in the Eastern Keno Hill Silver District including recommencement of
production at the Bellekeno mining operation, the timing of activities, the amount of estimated revenues and expenses, the success of exploration activities,
permitting time lines, requirements for additional capital and sources and uses of funds.
Forward-looking statements are subject to a variety of known and unknown risks, uncertainties and other factors which could cause actual events or results to
differ from those expressed or implied by the forward-looking statements. Such factors include, but are not limited to, risks related to regulatory approval of any
proposed offering; risks related to Alexco's ability to raise additional capital; the parties’ performance under the amendment to the Silver Purchase Agreement,
including Alexco’s ability to raise additional capital to make the $20 million payment to Silver Wheaton to meet its condition thereunder; success and timing of
regulatory approvals; actual results and timing of exploration and development activities; actual results and timing of mining activities; actual results and timing of
environmental services operations; actual results and timing of remediation and reclamation activities; conclusions of economic evaluations; changes in project
parameters as plans continue to be refined; future prices of silver, gold, lead, zinc and other commodities; possible variations in mineable resources, grade or
recovery rates; failure of plant, equipment or processes to operate as anticipated; accidents, labour disputes and other risks of the mining industry; First Nation
rights and title; continued capitalization and commercial viability; global economic conditions; competition; and delays in obtaining governmental approvals or
financing or in the completion of development activities. Furthermore, forward-looking statements are statements about the future and are inherently uncertain,
and actual achievements of Alexco or other future events or conditions may differ materially from those reflected in the forward-looking statements due to a variety
of risks, uncertainties and other factors, including but not limited to those referred to in the section entitled "Risk Factors" in the MD&A included in Alexco’s most
recent interim and annual financial reports, its current AIF and U.S. Form 40-F, and various of its other continuous disclosure documents.
Forward-looking statements are based on certain assumptions that management believes are reasonable at the time they are made. In making the forward-
looking statements included in this presentation, Alexco has applied several material assumptions, including, but not limited to, the assumption that: (1) the
Company will be able to raise additional capital, including to make the US$20 million payment to Silver Wheaton under the amendment, and that regulatory
approval will be obtained in a timely fashion; (2) the proposed development of its mineral projects will be viable operationally and economically and proceed as
planned; (3) market fundamentals will result in sustained silver, gold, lead and zinc demand and prices, and such prices will be materially consistent with or more
favourable than those anticipated in the EKHSD PEA, (4) the actual nature, size and grade of its mineral resources are materially consistent with the resource
estimates reported in the supporting technical reports; and (5) any additional financing needed will be available on reasonable terms. Financial outlook information
contained in this presentation about potential future cash flows is based on assumptions about future events, including economic conditions and proposed courses
of action, based on management's assessment of the relevant information currently available. Readers are cautioned that any such financial outlook information
contained herein should not be used for purposes other than for which it is disclosed herein.                                                                   2
Preliminary Economic Assessment
             Cautionary Statement
    On December 12, 2013, Alexco Resource Corp. filed a Preliminary Economic
Assessment Technical Report entitled “Updated Preliminary Economic Assessment for
      the Eastern Keno Hill Silver District Project – Phase 2, Yukon, Canada”
 Readers are cautioned that mineral resources are not mineral reserves and do
 not have demonstrated economic viability. The PEA is preliminary in nature; as
 well, while the consolidated mine production under the PEA is derived primarily
 from indicated mineral resources, approximately 6% is derived from inferred
 m ineral r esources. Ther e is no certainty that the PEA w ill be reali zed, and it
 includes inferred mineral resources that are considered too speculative
 geologically to have the economic considerations applied to them that would
 enable them to be categor i zed as m ineral reserves . The PEA contemplates an
 initial development and construction period beginning in the second quarter of
 2014, with startup of commercial production in the second quarter of
 2015. Commencement of development and construction remains dependent on
 Alexco making a development decision, which would be dependent on a number
 of factors, including but not limited to expectations regarding market prices for
 silver, lead, zinc and gold as w ell as the US- Canadian dollar exchange rate, and
 the availability of development capital.      Additionally, a production decision
 which is made without a feasibility study of mineral reserves demonstrating
 economic and technical viability carries additional potential risks which include,
 but are not limited to, the risk that additional detailed work may be necessary
 with respect to mine design and mining schedules, metallurgical flow sheets and
 process plant designs, and the noted inherent risks pertaining to the inclusion of
 approximately 6% inferred mineral resources in the mine plan.

                                                                                       3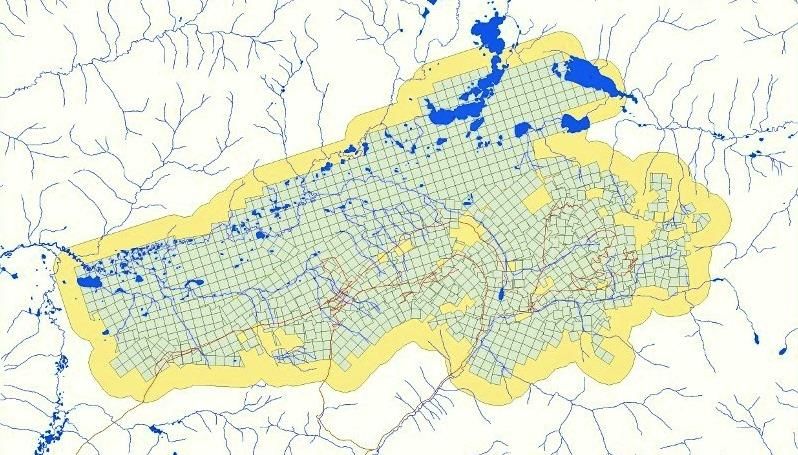
Alexco: A Silver Mining Company
              with a Valuable Subsidiary Business
                         Alexco Resource Corp.                                NYSE-MKT: AXU
                                                                              TSX: AXR
                                      2008-2012
  Alexco: Silver               $                                        Alexco
                                                    $
  Development &                                                      Environmental
     Mining                           2013-2014                       Group (AEG)
Keno Hill Silver District, Yukon, Canada     A branded, respected and growing
World class silver grades                    environmental remediation business
Interim production suspension Q3 2013        2013 revenue: $16.3 million, with a
Driving future costs down by:                42.5% margin normalized*
    Developing Flame & Moth deposit          Turnkey projects in Canada & U.S.
    Achieving 400tpd throughput
                                             Offices in Vancouver BC, Whitehorse
    Renegotiated silver streaming            YT, Denver and Toronto
    agreement
                                             *Reported gross margin for 2013 was 54%, including the
Successful exploration program               impacts from the execution of the ARSA and changes in the
                                             estimates of the environmental services contract loss provision
Silver production decision in H1-2015        were included.
                                                                                                          4
Alexco Objective:
  to be a Sustaining Silver Producer
       through all Silver Cycles
            Tasks Completed During
        Interim Operations Suspension

Identified path to 400tpd as quickly as possible
Renegotiated third party agreements
Pushed the ‘reset button’ on underlying fixed costs:
   Self mining, fly in/fly out, etc.
   Reviewed vendor contracts
   Labor rates
Have a cornerstone discovery (Flame & Moth) that
 will provide 5-10 year planning horizon

                                                       5
Key Step:
                     Resuming Production with Amended
                         Silver Purchase Agreement
All US$                                                          For comparative purposes only – 25% silver stream is preserved,
                                                                            but with new variable payment structure
   New variable production                           30%
   payment curve based on the                                    Va r i a b l e P r o d u c t i o n P a y m e n t E x p r e s s e d
   spot silver price (previously                                  as Silver Streaming Equivalent Curve
   a fixed $3.90/oz payment)                         25%

                                     Equivalent Stream %
                                                     20%
   Production payment varies                                     Alexco Area
   between $18.00/oz and
   $3.90/oz                                          15%
                                                                 of Benefit

   Subject to US$20 million                          10%
   payment to SLW, with SLW
   to participate in $5 million of                         5%
   Alexco equity raise
                                                           0%

                                                                $27
                                                                $15
                                                                $16
                                                                $17
                                                                $18
                                                                $19
                                                                $20
                                                                $21
                                                                $22
                                                                $23
                                                                $24
                                                                $25
                                                                $26

                                                                $28
                                                                $29
                                                                $30
                                                                $31
                                                                $32
                                                                $33
                                                                $34
                                                                $35
                                                                $36
                                                                $37
                                                                $38
                                                                $39
                                                                $40
   400 tonne per day
   completion test deferred up                                                    Silver Price/Oz ($US)
   to 24 months after delivery                              SLW Current Share of Payable Silver Production – 25%                      6
   of first concentrate to
   smelter                                                  Variable Production Payment Shown as Silver Streaming Curve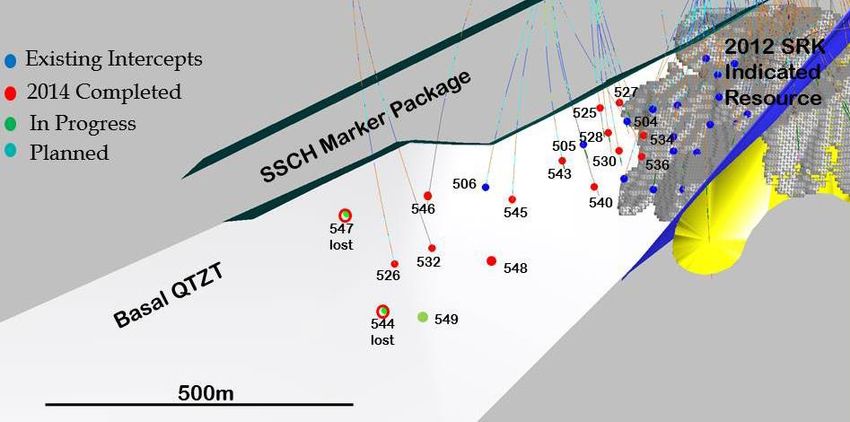
Total Alexco Gross Profit
                                   2011-2013: $50.8 Million
                                                                          TOTAL               20131            2012           2011
    Ore tonnes processed                                                 242,171              66,297          94,810         81,064

    Mill throughput (tonnes per day avg)                                     250                  271                260        222

    Grade of ore processed:
     Silver (grams per tonne)                                                  779                705                760        834

     Lead                                                                     9.5%              7.7%            9.6%          10.2%

     Zinc                                                                     5.1%              3.8%            4.8%             6%

    Recoveries:
     Silver                                                                    93%               94%             93%           92%

     Lead in lead concentrate                                                  91%               92%             90%           90%

     Zinc in zinc concentrate                                                  61%               61%             56%           65%

    Production – contained metal:
     Silver (ounces)                                                 5,579,818             1,408,164       2,150,959       2,020,695

     Lead in lead con (pounds)                                      44,963,128           10,324,978      18,183,755 16,454,395

     Zinc in zinc con (pounds)                                      16,339,879             3,443,855       5,676,284       7,219,740

    Cash costs of production2
     Per ounce of payable silver produced                                  $11.81             $14.00          $11.89         $10.17

1 The year ended December 31, 2013 represents a shortened operating period encompassing 245 days.
2 Cash costs of production per ounce of payable silver produced is a non-IFRS measure with no standardized meaning
prescribed under IFRS. See page 16 of Alexco’s December 31, 2013 MD&A for explanation and reconciliation.                              7
Targeted Potential Cost
                                  Reductions at Keno Hill
35

30

25      ~$27
20
                                          20-30%           10-15%             5-10%            5-10%
                             ~$19
15
                                                                                                                ~$16
10

 5

 0

        2012-13            Q2 2013      Increase in Increase in Self Mining                     Cost           Targeted
        Average             AISC        Throughput Variable Cost                             Reduction          AISC
         AISC                                                                                Initiatives
             Cash Cost per Oz
             Cost    per Oz
             net of by product*
                                   AISC
                                   AISCper
                                        per Oz**
                                            Oz        Cost Reductions          SLW
                                                                               SLW Share
                                                                                   Stream          Cost Increases

     *Cost per Ounce is calculated on a payable ounces produced.
     **AISC is calculated on payable ounces sold on a co product basis, as defined by the World Gold Council. Targeted
                                                                                                                          8
     AISC includes impact of Amended Silver Purchase Agreement.
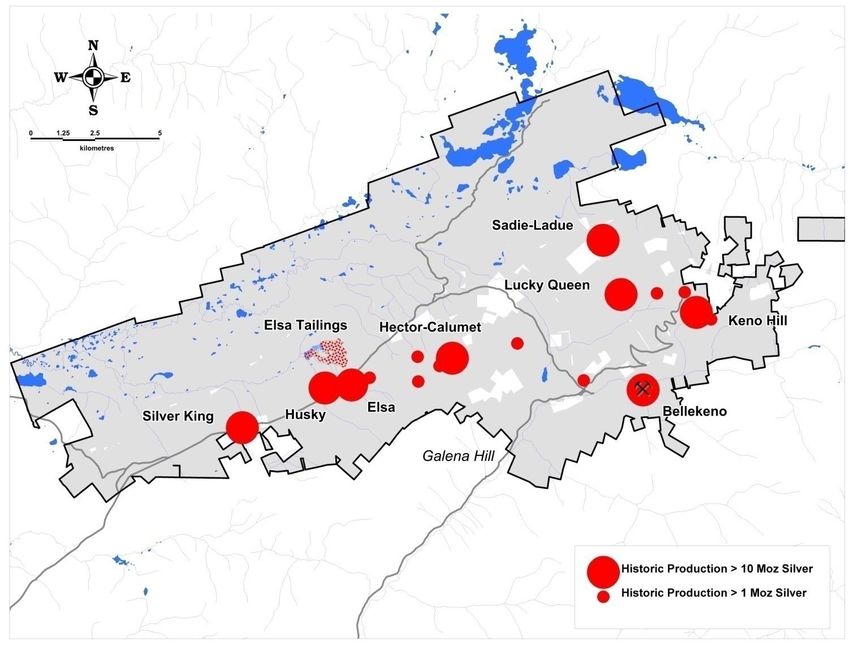
Area of Production Focus:
               2015-2020
                                                       Area of
233 square km property                                 production
                                                       focus:
       position                                        2015-2020
                                     Lucky
                                     Queen

                      Flame
                      & Moth
                                            Keno 700
                                     Onek

                     District Mill

                                            Bellekeno

                                                              9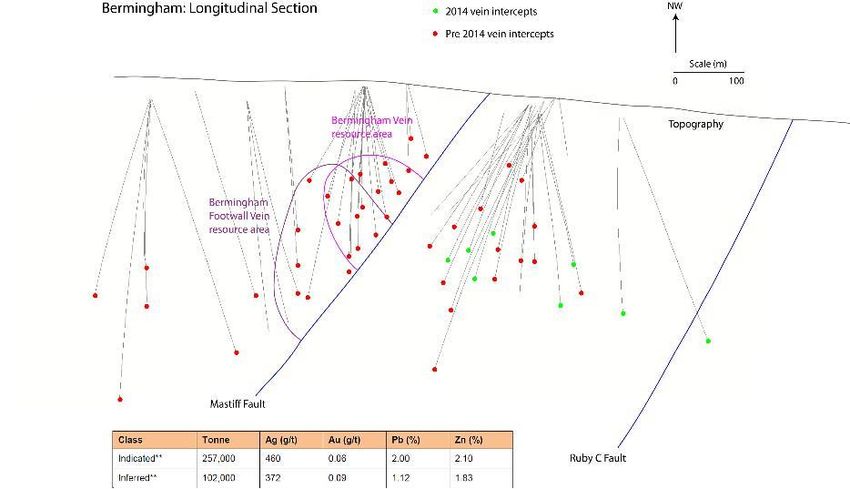
2013 PEA Plan *
                 Flame & Moth, Bellekeno & Lucky Queen
             Sustainable 400tpd achieved by sequentially operating
           Bellekeno, Flame & Moth and Lucky Queen
             9 month construction period for Flame & Moth
             5.5 years of production
             Annual estimated average production:
                      3.1 million ounces of payable silver
                      6.8 million pounds of lead
                      6.6 million pounds of zinc
                      1,050 ounces of gold
             Initial capital (including working capital) of approximately
           $25 million with optimization ongoing
                      Can be constructed in phases
                Optimization work well advanced
(*See Preliminary Economic Assessment (PEA) Cautionary Statement. The PEA is based on metal prices of US$24 per ounce for
                                                                                                                            10
silver, US$0.95 per pound for lead, US$0.85 per pound for zinc and US$1,300 per ounce for gold. )
Timeline:
Next Steps
2014 2015
Milestones Jun Jul Aug Sep Oct Nov Dec Jan Feb Mar Apr May Jun Jul Aug
QML Amendment*
WUL Amendment**
Mill Modifications
Bellekeno Development
New Resource
Calculations
Surface Infrastructure
Setup
Portal & Decline Ramp
Development
Ore Access Development
Production Decision
*Quartz Mining Licence
**Water Use Licence
11Flame & Moth Underground Development
Capital Estimate & Schedule
Flexibility to Develop Flame & Moth in Phases
Category $ M Cdn
Surface Infrastructure/PPE $ 0.9
Water Treatment Plant $ 0.8
Primary Decline Ramp (622 m) $ 4.4
Ore and Level Accesses (500 m) $ 3.5
Ventilation Raise (99 m) $ 0.5
Underground Definition Drilling $ 1.0
Contingency (10%) $ 1.1
Total Development Cost $ 12.2
UNDERGROUND DEVELOPMENT SCHEDULE
Permitting for Initial Development 2 months
Underground Initial Development 8 months
Ore Access, Stope Prep 2-4 months
(The underground development phase capital is a subset of the total initial capital required for the
Flame & Moth deposit as described in the PEA. See PEA Cautionary Statement on slide 3.)
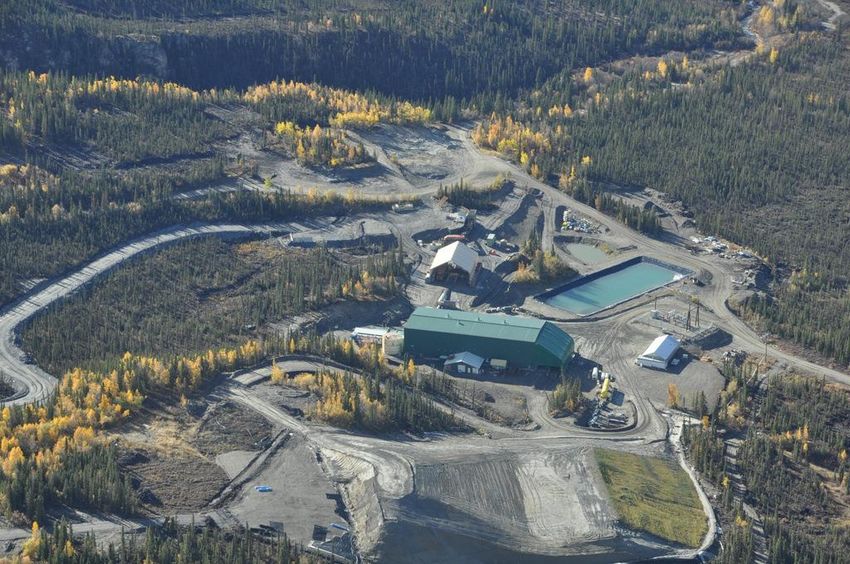
12Flame & Moth:
Cornerstone Asset for Next 6+ Years
Conveniently Proximate to Mill
Flame & Moth
West
Proposed Portal
Location
Keno Hill Mill
13Flame & Moth Resource
Proposed Development Design
Block Model at $185 NSR Cutoff
Mill
2013 Updated Resource Estimate1
Indicated = 22,859,000 Moz Ag, 516 gpt
0 100 200m Inferred = 1,081,000 Moz Ag, 313 gpt
(1See appended Summary of Silver Resources slide) 14Potential Mineable Tonnes
included in PEA Plant Feed
2014 - 2020
Mine Tonnes Silver Gold Lead Zinc
(gpt) (gpt) (%) (%)
Flame & Moth 593,000 690 0.52 2.18 5.44
Bellekeno 85,700 660 6.74 4.15
Lucky Queen 129,000 1054 0.12 2.35 1.47
Total 807,700 745 0.40 2.69 4.67
Please see the December 12, 2013, Alexco Resource Corp. Preliminary Economic Assessment Technical Report entitled “Updated
Preliminary Economic Assessment for the Eastern Keno Hill Silver District Project – Phase 2, Yukon, Canada” for further information. 15Bellekeno Mine Plan
Bellekeno Indicated Mineral Resource Estimate* Note: Bellekeno East Zone Mineral Resource
not shown in this figure
Tonnes Silver (gpt) Lead (%) Zinc (%) Silver (Oz)
262,000 585 3.5% 5.3% 4.9 mil
Bellekeno Potentially Mineable Tonnes in PEA**
Tonnes Silver (gpt) Lead (%) Zinc (%)
85,700 660 6.7% 4.2%
Planned
Mine Blocks
Previously Mined
Bellekeno: 3 years from discovery
to commercial production
0 100 200
metres
*Please see appended Summary of Resources slide for full mineral resource disclosure.
16
**Please see appended Potentially Mineable Tonnes slide for full disclosure.Lucky Queen Development
Lucky Queen
Historical
Current Resource
Workings
Tonnes Ag Au Pb Zn Ag ozs.
(gpt) (gpt) (%) (%) (000)
Indicated 124,000 1,227 0.2 2.6 1.7 4,891
Proposed
Inferred 150,000 571 0.2 1.4 0.9 2,753 Development
(see appended Summary of Silver Resources slide)
Lucky Queen Potentially Mineable Tonnes in PEA**
Tonnes Silver (gpt) Au (gpt) Lead (%) Zinc (%)
Historical Production:
129,000 1054 0.12 2.35% 1.47% 10.96 Moz Ag
(**Please see Potential Mineable Tonnes slide for full disclosure.) 500 Level
123,530 tons @ 88.7opt Ag
Workings
Lucky Queen
Rehabilitation
Completed
0 200 400
metres
17Where Do We Rank?
Silver Ore Grade Milled
Silver Grade
800
For comparison purposes: ALEXCO
700 estimated ore grade to be milled during
600 life of Preliminary Economic Assessment
Grams per Tonne
project (745 gpt). Other companies
500
actual 2013 silver ore grade milled.
400
300
200
100
0
Source: Public information available April 2014 18Where Do We Rank?
All In Sustaining Costs
(e st i m ate d co m p ari son o n l y )
$25 For comparison purposes: ALEXCO’s estimated future AISC.
Other companies actual 2013 AISC reported or calculated.
$20
Dollars per ounce
Pre-SLW Amendment
$15
Post-SLW Amendment
$10
$5
$0
Source: Public information available April 2014 and internal Alexco calculations 19Significant Silver Resource Growth,
Exploration Efficiency
60 Average Discovery Cost
Since 2008: approx.
50 $0.60 per ounce/silver
INDICATED
SILVER 40
RESOURCE*
in 30
Millions of
Ounces 20
10
0
2009 2010 2011 2012 Current
20
*Please see appended Summary of Silver Resources slide for full mineral resource disclosure.Exploration:
An Unqualified Success
From inception to date, exploration spending is
approximately $65 million
Efficient SILVER DISCOVERY Inception – To Date Inception – To Date
Discovery Cost Discovery Rate
All Exploration ’05-’13 $0.92/oz 500 oz/meter
Last 5 years ’08-’13 $0.60/oz 700 oz/meter
Flame & Moth $0.42/oz 1,040 oz/meter
Lucky Queen $0.72/oz 690 oz/meter
Bellekeno $1.08/oz 375 oz/meter
Onek $1.25/oz 400 oz/meter
Bermingham $1.69/oz 300 oz/meter
2014 Exploration Program - $5 million
--Targeting minimum of 14,000 meters of surface
exploration drilling in 2014
21Earn Group
Flame
&
Moth
Flame
--
Christal Lake NE Extension
Target
Christal
Corridor
Lake
Moth Vein Corridor
Target
2014
Drilling
Flame West
Target
2014 Drilling
Pre 2014 Drilling
Flame
SW Extension
Sourdough Hill Target
Member
22Flame & Moth
2014 Drilling
23Bermingham Longitudinal Section
2014 Completed
Pre 2014 Vein Intercepts
Class Tonnes Ag(g/t) Au(g/t) Pb(%) Zn(%)
Indicated 257,000 460 0.06 2.00 2.10
23
Inferred 102,000 372 0.09 1.12 1.83 (see appended Summary of Silver Resources slide)2014 – 2015 Plan of Action
Conclude permitting for Flame & Moth deposit
Continue to grow Flame & Moth silver resources
through expanded 2014 exploration program
Ready Bellekeno for operation
Continue optimization work for development and
production
Monitor commodity and capital market conditions
2015: Production decision / start up
25Alexco Environmental Group:
Record Technical and Financial Results
Patented remediation
technologies
Northern mine
permitting/environmental
assessment expertise
Globeville smelter cleanup
Platoro in-situ
underground mine treatment
2013 revenue: $16.3
million, with a 42.5% margin
normalized
+$70M backlog including
Keno closure
Globeville smelter site, Denver, CO
26The Alexco Advantage
NYSE-MKT:AXU / TSX:AXR
69.6 Million Shares Issued & Outstanding
Owns 100% of high grade Keno Hill Silver District
Safe jurisdiction, good infrastructure
Favorable silver streaming amendment
Moving toward long-term, sustainable silver
production
Indicated silver resources of 49.7 million ounces*
Additional 9.9 million oz Inferred resource*
Additional 5.4 million oz Historical resource*
Alexco Environmental Group: an established
brand – record growth and profitability
Cash position :
End of Q2’14 -- $6.3 million and net working capital
of $11.7 million
Subsequent bought deal for additional $8 million
*Please see appended Summary of Silver Resources slide for full mineral resource disclosure. 27Alexco Resource Corp.
APPENDIX SLIDES
28Summary of Silver Resources:
Keno Hill Silver District
Category1,2,11 Property Tonnes Ag (g/t) Au (g/t) Pb (%) Zn (%) Contained Ag (oz)
4
Indicated Bellekeno Deposit 262,000 585 n/a 3.5% 5.3% 4,933,000
Lucky Queen Deposit5 124,000 1,227 0.2 2.6% 1.7% 4,891,000
Flame & Moth Deposit6 1,378,000 516 0.4 1.7% 5.7% 22,859,000
Eastern Keno Hill Silver District3 1,764,000 576 n/a 2.0% 5.4% 32,683,000
Onek7 585,000 194 0.7 1.2% 13.7% 3,648,000
Bermingham8 257,000 460 0.1 2.0% 2.1% 3,800,000
Total Indicated – Sub-Surface Deposits 2,606,000 479 n/a 1.9% 6.9% 40,131,000
Elsa Tailings9 2,490,000 119 0.1 1.0% 0.7% 9,526,000
Total Indicated – All Deposits 5,096,000 303 n/a 1.4% 3.9% 49,657,000
Inferred Bellekeno Deposit4 243,000 428 n/a 4.1% 5.1% 3,338,000
Lucky Queen Deposit5 150,000 571 0.2 1.4% 0.9% 2,753,000
Flame & Moth Deposit6 107,000 313 0.3 0.9% 4.2% 1,081,000
Eastern Keno Hill Silver District3 500,000 446 n/a 2.6% 3.7% 7,172,000
Onek7 236,000 203 0.4 1.1% 11.5% 1,540,000
Bermingham8 102,000 372 0.1 1.1% 1.8% 1,220,000
Total Inferred 838,000 369 n/a 2.0% 5.6% 9,932,000
Historical Silver King10
Resources - Proven, probable and indicated 98,998 1,354 n/a 1.6% 0.1% 4,310,000
- Inferred 22,581 1,456 n/a 0.1% n/a 1,057,000
Notes:
1. All mineral resources are classified following the CIM Definition Standards for Mineral Resources and Mineral Reserves (December 2005), in accordance with the CIM Estimation of Mineral Resources
and Mineral Reserves Best Practice Guidelines and the guidelines of NI 43-101.
2. Mineral resources are not mineral reserves and do not have demonstrated economic viability. All numbers have been rounded to reflect the relative accuracy of the estimates.
3. The Eastern Keno Hill Silver District property is comprised of three deposits: Bellekeno, Lucky Queen and Flame & Moth. The resource estimates for the Eastern Keno Hill Silver District are supported by
disclosure in the news release dated December 5, 2013 entitled “Alexco Releases Positive Preliminary Economic Assessment for Expanded Silver Production from Eastern Keno Hill Silver District, Yukon”
and by a technical report filed on SEDAR dated November 15, 2013 entitled “Updated Preliminary Economic Assessment for the Eastern Keno Hill Silver District Project – Phase 2, Yukon, Canada”.
4. The resource estimates for the Bellekeno deposit are based on a geologic resource estimate having an effective date of May 31, 2012. The Bellekeno indicated resources are as at September 30, 2013,
and reflect the geologic resource less estimated subsequent depletion from mine production.
5. The resource estimates for the Lucky Queen deposit have an effective date of July 27, 2011.
6. The resource estimates for the Flame & Moth deposit have an effective date of January 30, 2013.
7. The resource estimates for Onek have an effective date of July 27, 2011, and are supported by disclosure in the news release dated July 27, 2011 entitled “Alexco Announces Initial Resource Estimates
for Lucky Queen and Onek” and by a technical report filed on SEDAR dated September 8, 2011 entitled “Technical Report on the Onek Deposit, Onek Property, Keno Hill District, Yukon”.
8. The resource estimates for Bermingham have an effective date of June 27, 2012, and are supported by disclosure in the news release dated June 28, 2012 entitled “Alexco Announces Initial Resource
Estimates for Flame & Moth and Bermingham” and by a technical report filed on SEDAR and signature dated August 8, 2012 entitled “Technical Report on the Bermingham Deposit, Bermingham
Property, Keno Hill District, Yukon”.
9. The resource estimate for the Elsa Tailings has an effective date of April 22, 2010, and is supported by the technical report dated June 16, 2010 entitled “Mineral Resource Estimation, Elsa Tailings
Project, Yukon, Canada”.
10. Historical resources for Silver King were estimated by United Keno Hill Mines Limited, as documented in an internal report entitled “Mineral Resources and Mineable Ore Reserves” dated March 9, 1997.
The historical resources were estimated based on a combination of surface and underground drill holes and chip samples taken on the vein and calculated using the polygonal (block) method and the
1997 CIM definitions for resource categories. These estimated historical resources include a total of 55,674 tonnes classified as proven and probable reserves and 43,324 tonnes classified as indicated
resources, plus an additional 22,581 tonnes classified as inferred resources. Though believed by Alexco management to be relevant and reliable, this estimate of historical resources has not been verified
by Alexco, pre-dates NI 43-101 and is not compliant with NI 43-101 resource categories. Verification of the estimate would require new drill holes into a statistically significant number of the historical
resource blocks and/or a combination of on-vein sampling. A qualified person has not done sufficient work to classify this estimate of historical resources as current, nor is Alexco treating this historical
estimate as a current mineral resource.
11. The disclosure regarding the summary of estimated resources for Alexco’s mineral properties within the Keno Hill District has been reviewed and approved by Scott Smith, P.Eng., former Bellekeno Mine 29
Manager and a Qualified Person as defined by NI 43-101.Amended Silver Purchase Agreement:
Variable Production Payment Curve
$20
At $19.45 spot silver price,
$18 maximum SLW production
Production Payment Per Ounce $USD
payment/oz is $18.00
$16
$14
$12
$10
$8
$6
$4
$2
$0
$10.45
$29.45
$11.45
$12.45
$13.45
$14.45
$15.45
$16.45
$17.45
$18.45
$19.45
$20.45
$21.45
$22.45
$23.45
$24.45
$25.45
$26.45
$27.45
$28.45
$30.45
$31.45
$32.45
$33.45
$34.45
$35.45
$36.45
$37.45
$38.45
$39.45
$4.45
$5.45
$6.45
$7.45
$8.45
$9.45
Previous Month's COMEX Monthly Average Silver Price $USD
Production Payment Curve
30Amended SPA Agreement: Impact
on 2013 Preliminary Economic
Assessment Plan (PEA)
(All $Cdn)
At US$19/oz silver price PEA - Original SLW PEA - Amended SLW
Agreement Agreement
$13 million
PEA Pre-tax NPV ($14 million)
(net of $22M SLW buy-down)
Silver stream expressed as NSR 20% 2%
$26 million
PEA cumulative net cash ($11.5 million)
(net of SLW buy-down)
Alexco share of project
Under Water 90%
cumulative net margin
2013 PEA and Alexco Metrics* ($Cdn)
9 month construction period; 5.5 years of production
Annual production: average 3.1 million ounces of payable silver, 6.8 million
pounds of lead, 6.6 million pounds of zinc and 1,050 ounces of gold
Underground development capital - $12.2 million (Alexco internal estimate)
Working capital, sustaining development, scale up – additional $12 million
(Alexco internal estimate)
(*See PEA Cautionary Statement on slide 3. The PEA (2013) is based on metal prices of US$24 per ounce for silver,
US$0.95 per pound for lead, US$0.85 per pound for zinc and US$1,300 per ounce for gold.) 31PEA Impact:
Cumulative Net Margin % Increase
• At $20/oz silver, Alexco’s share of cumulative net margin under the amended
agreement is 85%, compared to just 2% under the original agreement
• Between $20-$30/oz silver, under the original agreement SLW’s share of cumulative
net margin averaged ~69%, reduced to ~37% under the amended agreement
100%
80%
Cumulative Net Margin %
60%
40%
20%
0%
$19 $20 $21 $22 $23 $24 $25 $26 $27 $28 $29 $30 $31 $32 $33 $34 $35
-20% Silver Price/oz ($US)
AXU % Share of PEA cumulative Net Margin under original silver purchase agreement
-40%
AXU % Share of PEA cumulative Net Margin with amended agreement
(See PEA Cautionary Statement on slide 3. The PEA (2013) is based on metal prices of US$24 per ounce for silver,
US$0.95 per pound for lead, US$0.85 per pound for zinc and US$1,300 per ounce for gold.) 32Net Cumulative Pre-Tax Cash:
25% Silver Stream versus
Variable Production Payment
Variable Production Payment Curve –
Impact on PEA Cumulative Pre-Tax Net Cash Net of USD$20M Buy-down
$140 132.4 130.3
$120
$100
$80 75.4
CAD Millions
$60 53.7
$40
26.0
$20
(11.5)
$0
-$20
$19 $24 $30
Ag Price USD/Oz
PEA Pre-Tax Net Cash - Current 25% Stream
PEA Pre-Tax Net Cash - New Production Payment Curve
(See PEA Cautionary Statement on slide 3. The PEA (2013) is based on metal prices of US$24 per ounce 33
for silver, US$0.95 per pound for lead, US$0.85 per pound for zinc and US$1,300 per ounce for gold.)Net Cumulative Post-Tax Cash:
25% Silver Stream versus
Variable Production Payment
Variable Production Payment Curve –
Impact on PEA Cumulative Post-Tax Net Cash, Net of USD$20M Buy-down
92.4 84.2
$100
$80
$60
CAD Millions
49.0
41.4
$40
$20 16.8
(11.0)
$-
$(20)
$19 $24 $30
Ag Price USD/Oz
PEA Post-Tax Net Cash - Current 25% Stream
PEA Post-Tax Net Cash - New Production Payment Curve
(See PEA Cautionary Statement on slide 3. The PEA (2013) is based on metal prices of US$24 per ounce
34
for silver, US$0.95 per pound for lead, US$0.85 per pound for zinc and US$1,300 per ounce for gold.)Silver Wheaton’s Expanded
‘Area of Interest’
Keno Hill Silver District
Current 233 square km property position 35PEA – Key Metrics
Consolidated production 806,900 tonnes (t)
Consolidated production grade 745 grams per tonne (gpt) silver (Ag), 0.4 gpt gold (Au), 2.7%
lead (Pb), 4.7% zinc (Zn)
Commercial production period Q2 2015 – Q2 2020
Development, construction period Q2 2014 – Q1 2015
Mill throughput Average 406 tonnes per day (tpd)
Mill recoveries Ag 93.6%, Au 71.3%, Pb 83.9%, Zn 60.4%
Concentrate produced (6% moisture) 30,685 tonnes Pb con, 51,026 tonnes Zn con
Total payable metal production Ag 16.8Moz, Au 5,800oz, Pb 37.7Mlb, Zn 36.4Mlb
Production cost (mining, milling and G&A) $253 per tonne of ore
Net Smelter Return (NSR) per tonne of ore
(after incorporation of original Silver Purchase $419 per tonne of ore
Agreement)
Total capital (life of mine) $76 million, including $37 million underground development
Initial capital to achieve positive cash flow $25 million
Net Cash Contribution Pre-Tax $53.7 million
IRR Pre-tax 45%
NPV Pre-tax (5%) $39.9 million
Net Cash Contribution After Tax $41.4 million
IRR After Tax 38%
NPV After Tax (5%) $29.6 million
Prices Used in PEA Ag US$24.00/oz, Pb US$0.95/lb, Zn US$0.85/lb, Au
US$1,300/oz
36
(See PEA Cautionary Statement on slide 3.)A Win-Win Partnership
A unique business model combining mine operations and
environmental remediation expertise
A “Win-Win” partnership between Alexco/Canada/Yukon/First Nations through a
cooperative District Closure Plan
Contributions of $22M to date to remediate historical environmental liabilities
Reduction of zinc release to the environment from the historical Galkeno 300
mine by 99.5%, reduced the concentration of zinc in Christal Creek by 75%
Taxpayer liability reduced 37Alexco History
2005 Company Founded
2006 Listed with TSX; symbol AXR
2006 Acquired Keno Hill Silver District, initiated exploration
2007 Listed with NYSE-MKT; symbol AXU
“Discovery” of Bellekeno deposit
2008 Silver Wheaton Agreement - $50 million and $3.90/oz for 25%
of future silver mined
2009 Bellekeno Construction Begins
2010 Comprehensive Cooperation Agreement with First Nation
2011 Bellekeno Mine Production – Three years discovery to
production
2012 52% Increase in Indicated Silver Resources
2013 Grew Flame & Moth to approx. 23 million oz Indicated resource
2013 Announced interim winter shutdown of operations to optimize
costs, Published new PEA for Eastern Keno Hill Silver District
2014 Announced amended silver streaming agreement 38Share Structure
Trading Symbol: NYSE-MKT:AXU TSX:AXR
Issued & Outstanding: 69.6 million shares
Fully diluted: 77.4 million shares
Major Shareholders: Alexco Directors & Officers
Sprott Inc.
Columbia Wanger Asset Mgt.
Global X Management Co. LLC
Pathstone Family Office LLC
Canada Pension Plan Investment
39SENIOR MANAGEMENT
Clynton R. Nauman, B.Sc. - President & CEO
Board of Directors
Senior Management &
(Hons.)
Brad A. Thrall, B.Sc., MBA - Executive Vice President, COO &
President, Alexco Environmental Group
David E. Whittle, C.A. - Senior Vice President & CFO
Al McOnie, M.Sc. - Vice President, Exploration
(Geology), FAusIMM
Jim Harrington, M.Sc. - Senior Vice President & Chief Technology Officer,
Alexco Environmental Group
Vicki Veltkamp - Vice President, Investor Relations
BOARD OF DIRECTORS
George Brack, Chairman
Michael Winn
David H. Searle, C.M., Q.C.
Terry Krepiakevich, C.A., ICD.D.
Rick Van Nieuwenhuyse, M.Sc.
Rick Zimmer, P.Eng., MBA
Clynton R. Nauman, B.Sc. (Hons.)
40Qualified Persons & Cautionary Note
Concerning Reserve & Resources Estimate
Except where specifically indicated otherwise, the disclosure in this presentation of scientific and technical information regarding exploration projects on Alexco’s
mineral properties has been reviewed and approved by Alan McOnie, FAusIMM, Vice President, Exploration, while that regarding mine development and
operations has been approved by Scott Smith, P.Eng., former Bellekeno Mine Manager, both of whom are Qualified Persons as defined by National Investment
43-101 - Standards of Disclosure for Mineral Projects (“NI 43-101”). All material technical information included herein has previously been disclosed by Alexco,
and the viewer Is particularly directed to the company’s most recently filed AIF and U.S. Form 40-F and its most recently filed interim and annual financial reports;
as well as the remaining filings completing Alexco’s continuous disclosure records.
This presentation has been prepared in accordance with the requirements of the securities laws in effect in Canada, which differ from the requirements of U.S.
securities laws. Unless otherwise indicated, all resource and reserve estimates included in this presentation have been prepared in accordance with NI 43-101
and the Canadian Institute of Mining and Metallurgy Classification System. NI 43-101 is a rule developed by the Canadian Securities Administrators which
establishes standards for all public disclosure an issuer makes of scientific and technical information concerning mineral projects. NI 43-101 permits the
disclosure of an historical estimate made prior to the adoption of NI 43-101 that does not otherwise comply with NI 43-101, using the historical terminology, if the
disclosure: (a) identifies the source and date of the historical estimate; (b) comments on the relevance and reliability of the historical estimate; (c) to the extent
known, provides the key assumptions, parameters and methods used to prepare the historical estimate; (d) states whether the historical estimate uses categories
other than those prescribed by NI 43-101 and if so includes an explanation of the differences; (e) includes any more recent estimates or data available to the
issuer; (f) comments on what work needs to be done to upgrade or verify the historical estimate as current mineral resources or mineral reserves; and (g) states
with equal prominence that a qualified person has not done sufficient work to classify the historical estimate as current mineral resources or mineral reserves and
that the issuer is not treating the historical estimate as current mineral resources or mineral reserves.
Canadian standards, including NI 43-101, differ significantly from the requirements of Industry Guide 7 promulgated by the United States Securities and
Exchange Commission (“SEC”) under the United States Securities Act of 1933, as amended, and resource and reserve information contained herein may not be
comparable to similar information disclosed by U.S. companies. In particular, and without limiting the generality of the foregoing, the term “resource” does not
equate to the term “reserves”. Under U.S. standards, mineralization may not be classified as a “reserve” unless the determination has been made that the
mineralization could be economically and legally produced or extracted at the time the reserve determination is made. The SEC's disclosure standards under
Industry Guide 7 do not define the terms and normally do not permit the inclusion of information concerning “measured mineral resources”, “indicated mineral
resources” or “inferred mineral resources” or other descriptions of the amount of mineralization in mineral deposits that do not constitute “reserves” by U.S.
standards in documents filed with the SEC. U.S. Investors should also understand that “inferred mineral resources” have a great amount of uncertainty as to
their existence and great uncertainty as to their economic and legal feasibility. It cannot be assumed that all or any part of an “inferred mineral resource” will ever
be upgraded to a higher category. Under Canadian rules, estimated “inferred mineral resources” may not form the basis of feasibility or pre-feasibility studies
except in rare cases. Investors are cautioned not to assume that all or any part of an “inferred mineral resource” exists or is economically or legally mineable.
Disclosure of “contained ounces” in a resource is permitted disclosure under Canadian regulations; however, the SEC normally only permits issuers to report
mineralization that does not constitute “reserves” by SEC standards as in place tonnage and grade without reference to unit measures. The requirements of
NI 43-101 for identification of “reserves” are also not the same as those of the SEC’s Industry Guide 7, and reserves reported by the Corporation in compliance
with NI 43-101 may not qualify as “reserves” under Industry Guide 7 standards. Accordingly, information concerning mineral deposits set forth herein may not be
comparable with information made public by companies that report in accordance with U.S. standards.
41Alexco Contact Information
Investor Relations:
Clynton R. Nauman, President & CEO
Vicki Veltkamp, Vice President, Investor Relations
David Whittle, CFO
Phone: (604) 633-4888
Email: info@alexcoresource.com
Website:
www.alexcoresource.com
Vancouver Office:
1150 - 200 Granville Street
Vancouver, BC V6C 1S4
P. 604-633-4888
F. 604-633-4887
42You can also read