Q4 2019 Investor Presentation - Santander Consumer Bank Nordic Group
←
→
Page content transcription
If your browser does not render page correctly, please read the page content below

v

Q4 2019 Investor
Presentation
Santander Consumer Bank
Nordic Group

February 2020

Index

1. SCB Nordic Overview 2019

2. Financials 2019

3. Capital and Funding 2019

4. Appendix: Santander Group

5. Appendix: Santander Consumer Finance

                                          2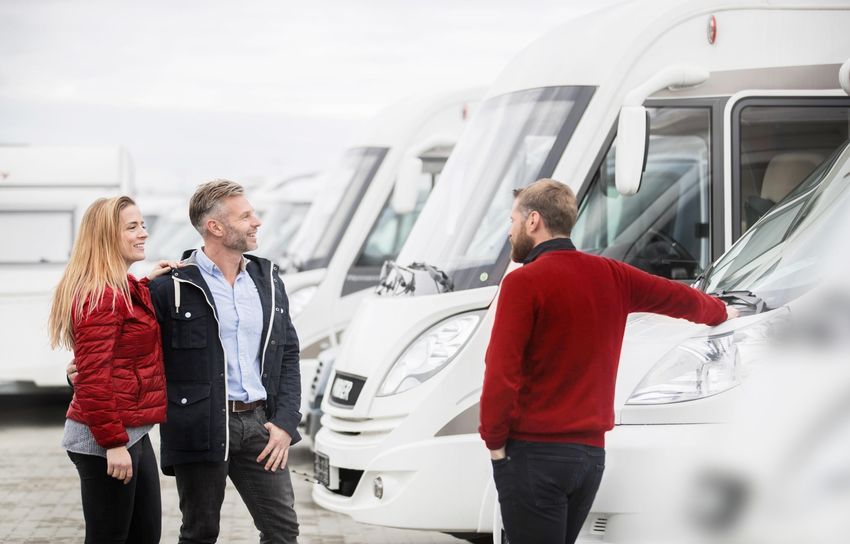
SCB Nordic
Overview 2019

                01
Who we are
                                                               Santander Consumer Bank AS is a Nordic bank with more
                                                               than 1,400 colleagues in Sweden, Norway, Denmark and
                                                               Finland, with a long history in the Nordics, and with global
                                                               strength through being a part of Banco Santander.

We are one of the largest Nordic banks providing loans and
credits, credit cards, deposits and insurance to private and
business customers. We work with the best people in an
engaged, challenging and passionate organization, which
provides great opportunities for professional growth.

                                                                                                                              4
Regulated in Norway, owned by Banco Santander

                                                              Santander Consumer        SCB AS is
                                                                   Bank AS              regulated
                                                                                          by the
                                                                 Fitch/Moody’s          Norwegian
                                                                     A-/A3                 FSA

                       Santander
     Banco
                       Consumer
 Santander S.A.
                      Finance S.A.
 Fitch/Moody’s/S&P
       A-/A2/A       Fitch/Moody’s/S&P
                           A-/A2/A-

                                         Santander Consumer    Santander Consumer   Santander Consumer
                                            Bank Denmark         Finance Finland       Bank Sweden
                                              (Branch)             (Subsidiary)          (Branch)

                                                                                                         5
Key Figures
2019 (vs. 2018)

                        Gross
                                                                         Core Capital                 Total                    Profit Before
                        Outstanding
                                                                         CET11                        Deposit                  Tax
                        Loans

       165.3                   (+2%)                          18.1         (+2.4)       65.5           (+20%)       3,611            (-13%)
       NOK Billion                                            Per cent                  NOK Billion                 NOK Million

                        People2                                          Customers                 Net Interest                Partners
                                                                                                   Income Ratio3

                                                                                                                   5,060          +5,600
         1,484                  (-51)                         1.60         (+3.0%)      4.4            (-0.2)      Merchants      Car Dealers
         Employees                                            Million                   per cent

Source: SCB Group 2019 Annual Report and Management Figures
1) Adjusted for IFRS9 transitional rules
2) Headcount includes permanent and temporary employees
3) NII Ratio = Net Interest Income (annualized) / ANEA

                                                                                                                                                6
Loan growth in the Nordics

                                                                                                 CAGR1
                                                                                                  15%
                                                                                                                                                                               143,615
                                                                                                                                                                           165 331
                                                                                                                                            162 8022                            (mNOK)
                                                                                                                      2                          124,625
                                                                                                                                               mNOK
                                                                                                              147 970
                                                                                                                  116,297                              (mNOK)
                                                                                                                                                                              mNOK
                                                                                                                 mNOK
                                                                                                                    (mNOK)
                                                                                127 852
                                                  118 991                          mNOK
                                                    mNOK                                83,322
                                                                                         (mNOK)
                                                         71,891
                    83 322
                       59,575
                                                          (mNOK)
                      mNOK
                        (mNOK)

                       2014                          2015                           2016                          2017                           2018                          2019
Source: SCB Annual Reports 2014 – 2019
1) Compound Annual Growth Rate 2014 – 2019
2) SCB Group has reclassified Consignment from the financial statement line “Consignment” to “Loans to customers” in 2018. Comparison figures are changed similarly. As of December 31 2018 the Consignment
portfolio constitute NOK 4.2 billion of the financial statement line “Loans to customers”. Please see principle 6) on page 57 in the 2018 Annual Report for further details.

                                                                                                                                                                                                              7
Solid profitability

                                                                                                           CAGR1
                                                                                                            22%

                                                                                                                              3 995     2                      4 1342
                                                                                                                                                                mNOK
                                                                                                                               mNOK                                                              3 611
                                                                                             3 250                                                                                               mNOK
                                                                                              mNOK

                                                            1 942
                                                            mNOK
                           1 321
                           mNOK

                            2014                              2015                             2016                             2017                             2018                              2019
Source: SCB Annual Reports 2014 – 2019
1) Compound Annual Growth Rate 2014 – 2019
2) The Group reclassified issued AT1 capital of NOK 2.25 billion from liabilities to equity in 2017. Interest expenses for 2017 of NOK 169 million are consequently presented in equity instead of profit and loss,
with related tax impact presented as part of other equity. Comparison figures are changed similarly. Please see principle 6) on page 40 in the 2017 Annual Report for further details.

                                                                                                                                                                                                                      8
2019 | SCB Group overview
Portfolio and results by region

                                                 % of Gross Outstanding Loans        Norway                  Finland
     Nordic
   2019 Result                                                                        47.9 Bn   Auto
                                                                                                Loans        32.1 Bn   Auto
                                                                                                                       Loans

                                                                                                Unsecured              Unsecured
                                                                                      10.3 Bn   Loans         3.7 Bn   Loans
       165.3 Bn                                                            22%
                                                                                     1,571 MM   Profit
                                                                                                             519 MM    Profit
     Gross Outstanding                                35%                  Finland              Before Tax             Before Tax
                                                      Norway

                                                                                     Denmark                 Sweden
      3,611 MM
      Profit Before Tax                                                                         Auto                   Auto
                                                                                      25.8 Bn   Loans        23.3 Bn   Loans

                                                                23%                    7.0 Bn   Unsecured
                                                                                                             15.2 Bn   Unsecured
                                                                                                                       Loans
                                                                Sweden                          Loans

                                                 20%                                  929 MM    Profit
                                                                                                             592 MM    Profit
                                                                                                                       Before Tax
                                                 Denmark                                        Before Tax

Source: SCB Group 2019 Annual Report (All figures in NOK)

                                                                                                                                    9
History

  ELCON Finance                                Bankia Bank acquired
                                                  (credit cards)
A leading Norwegian                                                                                                                                                                                    Forso Nordic AB
   company within                               ELCON Finance
                                                                                              GE Finland acquired                                                                                   SCB agrees to acquire the
 equipment leasing,                            becomes Santander
                                                                                                 (auto finance,                                Deposits launched in                                captive finance operation of
 factoring and auto                                Consumer                                                                                                                                                               1
                                                                                               consumer loans)                                   Denmark (2014)                                       Ford in the Nordics
      financing                                  Bank AS (SCB)

    1963                                           2005                                          2009                                              2015                                                  2019

                          2004                                        2006/07                                       2012/13                                                     2017
                                                                       Launch consumer                              Consumer loans in            SCB merges with              Solidified position in
                     Santander Consumer
                                                                         loans Norway                               Sweden (2012) and            GE Money Bank               sales finance with the
                     Finance S.A. acquires
                                                                                                                     Denmark (2013)                                              onboarding of
                        ELCON Finance                                   Skandiabanken                                                               SCB becomes
                                                                                                                    Deposits launched in           leader within car          Elkjøp/Elgiganten,
                            Company                                   Bilfinans acquired in
                                                                            Denmark                                 Norway and Sweden                 finance and              Power and Media
                        demerges and auto
                                                                          (auto finance)                                  (2013)                 unsecured loans in                   Markt
                      finance is retained in
                                                                                                                                                  the Nordic region
                      Norway and Sweden                            Start up auto finance in
                                                                           Finland

Source: SCB Group 2019 Annual Report
1) Forso Nordic AB, the captive finance operation of Ford Motor Company in the Nordics, have agreed to an acquisition by Santander Consumer Bank AS. Part of the transaction is a long-term agreement on retail and wholesale
finance to Ford dealers under the Ford brand. The transaction is subject to regulatory approval.

                                                                                                                                                                                                                                  10
Executive Committee
Anders Knut Øvernes Tina Krogsrud Fjeld Michael
Bruun-Olsen MD Norway
IT & Ops Hvidsten
Commercial B2B
CFO Director CEO
Knut has held various
Anders has held several business management Tina has vast experience within Michael started in GE
senior positions within positions in GE Money commercial, business development, (first in GE Capital,
banking institutions like DNB, Bank and Santander compliance, group strategy and Non later in GE Money
Eksportfinans and since he started in 1996. Financial Risk. She joined Santander in Bank) in 2000, where
Handelsbanken. He joined 2019. he held various key
Santander in 2011. position within risk
management. He
joined Santander in
2005 as Nordic Chief
Risk Officer, and was
Peter Sjöberg Martin Brage Andres Diez appointed Nordic CEO
in 2012.
MD Finland MD Sweden Chief Risk Officer
Strategy and M&A Commercial B2C Andres has held
Martin joined GE in 1999. different leadership
Peter has 20 years positions within Risk
experience from banking With his long and extensive
experience within the and Credit. Joined
and financial services. He Santander in 2007.
has held several leadership financial sector and
positions in SCB. Joined Santander, he has built up
Santander in 2010. years of experience within
auto and unsecured.
11Responsible Banking Strategy
Creation of a holistic bank culture centered on responsible banking principles
Internal environment Inclusive and sustainable growth
Ensuring we have the right culture, skills, Supporting to create new jobs and helping
governance, digital and business practices people access finance, supporting the financing
of the low carbon economy and fostering
sustainable consumption
Strong corporate culture
Talented and motivated team
Responsible business practices
Risk focus INCLUSIVE SUSTAINABLE
GROWTH GROWTH
Stakeholder value
Responsible procurement
12Pursuing active contribution to the UN SDGs
Overview of other highly relevant SDGs for SCB AS:
GOAL 3: Ensure healthy lives and promote well-being for all GOAL 7: Ensure access to affordable, reliable, sustainable and
• Across the Nordics, SCB AS encourages a broad base of people to modern energy
physical activity:
• We engage in collaborations to innovate new and more environmental
• Partnering “Team Rynkeby”, a charity cycling team that raise money friendly mobility solutions, and we add the commercial strength to bring
for children with critical illnesses them to the market
• Engaging employees in “Kræftens Bekæmpelse”, the Danish Cancer • In 2013 Santander pioneered the All-in-One product suite in Finland,
Society speeding up renewal of one of the oldest car parks in Europe
• Supporting the Football Association to make “3v3” kid’s soccer
• We developed the IT solution to enable online sales of the all electric
tournaments – an inclusive sports variety where every team member is
Nissan Leaf - helping it to be last year's single most sold car model in
part of the active play and gets equal playing time
Norway
• Promoting health and well-being initiatives internally
GOAL 4: Ensure inclusive and equitable quality education and GOAL 13: Take action to combat climate change and its
promote lifelong learning opportunities for all impacts by regulating emissions and promoting
developments in renewable energy
• SCB AS is a Gold partner supporting “Right To Play”, an organization
that protects, educates and empowers children to rise above adversity • In 2018, SCB AS partnered with CHOOOSE, a global leader in
using the power of play retiring carbon credits and a platform for climate action, battling the
issue of emissions from big polluters
• Right To Play focus in five key areas: quality education, gender equality,
health & well being, child protection and peaceful communities • SCB has been certified as “Miljøfyrtårn” since 2009, meaning that
we are compliant with all requirements regarding health, environment
• The partnership with Right To Play for us means something more than
and safety, procurement, transportation, waste handling and energy
contributing financially. We actively participate involving employees and
consumption
partners contributing
• We educate employees on sustainability
Through its general business activity and its community work, SCB AS directly contributes to the achievement of UN SDG 3, 4, 7, 13
13Products
Auto & Leisure Unsecured Deposits Insurance
Loans and financial services Loans, credit cards and Saving products with high Insurance products related
provided to private sales finance services interest rates provided to to payment protection, auto,
customers, SMEs and car offered to private customers private customers health and travel, offered to
dealers private customers
14Gross outstanding loans and distribution by product
Total Auto and Unsecured
Credit Card
4%
Consumer
Loan
18%
Total
Unsecured
22%
Auto Private
Persons
Non Std. Auto
8%
Total Auto
78%
60%
Auto SME
10%
Source: SCB Group 2019 Annual Report and Management Figures
15Auto market share and products
Position and market share in the Nordics¹
#1
24% #1
market share
30%
market share
Auto Loans & Hire Auto Leasing Stock & Demo
Purchase Financing
Customers Customers Customers
#1 #4 Private Customers Private Customers Inventory financing for
dealers
Business Customers Business Customers
18% 9%
market share
market share
Distribution Distribution Distribution
Source: Based on internal calculations by SCB Online direct distribution Dealers direct New cars: Importer
Norway: Data from Finansieringsselskapenes Forening as per YTD Q4 2019 agreements
Indirect distribution with SME direct
Finland: Data from Finnish Transportation Safety Agency (Trafi) as per YTD Q4 2019
dealers and importers Used Cars: Direct to
Denmark: Data from Finans og Leasing as per YTD Q4 2019 dealers
Sweden: Data from Finansbolagens Förening as YTD Q4 2019 Cross sale
16Responding to mobility trends through digital strategy
SHFT All In-1 eCOMMERCE
A subscription marketplace for cars, Platorm to enable bundling of 3rd Quotation and checkout service
powered by Santander. Cars party services in one invoice to the connected to OEMs, dealerships and
provided by partner dealerships customer marketplaces
17Ford credit acquisition
During 2019, the Group continued to develop its commercial footprint in the Nordic region, through the acquisition of Forso Nordic AB (“Ford Credit”). The agreement will allow
SCB to offer financial services to Ford dealers and customers, and will secure and strengthen the Bank’s position as the market leader within auto financing in the Nordic region.
The acquisition is subject to regulatory approval and is expected to come into effect in Q1 2020.
Transaction highlights Forso Nordic summary
The transaction represents an exclusive long term strategic partnership Ford Credit is headquartered in Sweden, Gothenburg, with a subsidiary in Finland
agreement and presents SCB with new opportunities through extended service and branches in Norway and Denmark.
offering for our customers and provides a major growth opportunity for our The total outstanding portfolio, consisting of auto loans and leasing contracts, is
company across the region. approximately EUR 1,300 MM, which is 8% of the total balance of The Group.
By establishing a closer relationship to the manufacturers SCB aims to position The acquisition will be fully financed through an intra group loan from the parent
itself as a strategic partner going forward company of Santander Consumer Bank AS.
Source: SCB Group 2019 Annual Report and Management Figures
18Unsecured products and portfolio
Distribution of Unsecured portfolio¹
29%
10.3 Bn 10%
3.7 Bn
Direct loans Sales finance Credit cards
Distribution Distribution Distribution
Online
Agents
Online
Stores
Online
Stores
19% 42%
Cross sale Cross sale Cross sale 7.0 Bn 15.2 Bn
Portfolio Management
Source: SCB Group 2019 Annual Report
1) Gross outstanding loans
19Partnerships are a key success factor
+5,600 car dealers
5,060 merchants
37 brokers
22 brands
20Financials
022019 | Santander Group key figures
Santander Group Santander Consumer Finance Subgroup
Total assets 1.52 (€ trillion) Loans 116 (€ billion)
Profit After Tax 8,252 (€ million) Profit After Tax 1,470 (€ million)
Customers 145 (million) Customers 20 (million)
Headcount 196,419 Headcount 15,364
Branches globally 11,952 European countries 15
Source: Banco Santander and Santander Consumer Finance Q4 2019 Institutional Presentation
22Stable financial performance
Normalised KPI’s as a results of higher growth in the Auto portfolio
Return on Assets1 Net Interest Income Ratio2 Cost / Income Ratio3
Per cent Per cent Per cent
3.0 5.3 50
2.7 2.8 4.9
4.7 4.6 44 44
4.4 4.4 42
2.2 38 40
1.7 1.8
2014 2015 2016 2017 2018 2019 2014 2015 2016 2017 2018 2019 2014 2015 2016 2017 2018 2019
Source: SCB Annual Reports 2014 – 2019
1) ROA = PBT (annualized) / ANEA
2) NII Ratio = Net Interest Income (annualized) / ANEA
3) Cost/Income Ratio = OPEX / Gross Margin (OPEX: Total Operating Costs)
23Group Income Statement summary
NOK million 2019 2018 Δ 19/18
Interest income and similar income 8 596 8 158 438
Key changes year-on-year
Interest expenses and similar expenses -1 422 -1 239 -183 Net Interest Income: Increase in interest income as a result of
higher lending volumes, albeit slightly offset by higher cost of
Net interest income 7 174 6 919 255
funding due to higher market rates. Negative overall effect on net
Commissions and fees 366 429 -63 interest income from lower lending margins, as the product
portfolio mix is shifting more towards auto financing which carries
Other product and funding related income and cost 56 35 21
a lower yield
Gross margin 7 595 7 384 211
Commissions and fees: Decrease driven partly by lower
Salaries and personnel expenses -1 274 -1 538 264
insurance sales due to the introduction of IDD in Denmark, but
Administrative expenses -1 647 -1 545 -102 also a slowdown in new business for Auto in Norway
Depreciations and amortisation -257 -162 -95
Other income and costs: Decrease caused largely by reduced
Net operating income 4 418 4 139 279 loss allowance on off-balance exposures
Other incomes and costs 13 -189 202
Total losses: Lower recoveries on portfolio sale, resulting in
Total losses on loans, guarantees etc. -820 184 -1004 decrease compared to 2018. During Q2 portfolios of non-
performing and written-off loans were sold, resulting in a net gain
Profit before tax 3 611 4 134 -523
of approximately NOK 875 million
Income tax -742 -995 253
Profit after tax 2 869 3 139 -270
Source: SCB Group 2019 Annual Report
24Group Balance Sheet summary
NOK million 2019 2018 Δ 19/18
Key changes year-to-date
Deposits with external institutions 4 034 3 047 987
Deposits with external institutions: Increase in the reverse repo and
Loans to customers (net) 161 392 159 284 2 108 cash placement as a result of deposit growth
Other financial assets 11 604 10 453 1 151
Loans to customers: Sweden, Denmark and Finland showing growth
in local currency, but slightly offset consolidated due to stronger NOK
Other assets 3 911 3 324 587 compared to Q4 2018. Overall growth is driven by good market
conditions with sharper focus on financing as a tool to improve car
Total assets 180 941 176 108 4 833 sales and customer loyalty
Debt to credit institutions 30 174 40 253 -10 079 Other financial assets: Increased liquidity portfolio in preparation for
larger funding maturities during Q1 2020
Deposits from customers 65 484 54 645 10 839
Debt to credit institutions: Reduced levels of short-term intragroup
Debt established by issuing securities 53 403 52 929 474
funding owing to deposits balance growth, reflecting our self-funding
strategy
Other liabilities 4 368 3 213 1 155
Deposits from customers: Particularly strong growth in Norway and
Sweden following increased deposit interest rates
Subordinated loan capital 2 421 1 731 690
Debt established by issuing securities: Increased due to net
Total equity 25 090 23 336 1 754
issuance of securities, particularly the EUR 799.2 MM KIMI 8
Total liabilities and equity 180 941 176 108 4 833 transaction
Source: SCB Group 2019 Annual Report
25Credit Risk Performance
Risk Portfolio - Total (mNOK) 2016 2017 2018 2019
Current 118 837 92.7 % 136 821 92.2 % 150 284 92.5 % 152 639 91.8 % NPL ratio1
5-30 dpd 5 451 4.2 % 6 806 4.6 % 7 258 4.5 % 7 090 4.3 %
2.60
31-60 dpd 1 041 0.8 % 1 329 0.9 % 1 218 0.7 % 1 495 0.9 %
2.05 2.01 1.96 2.03
61-90 dpd 393 0.3 % 510 0.3 % 462 0.3 % 672 0.4 %
1.61 1.48
NPL 2 577 2.0 % 2 912 2.0 % 3 320 2.0 % 4 320 2.6 %
Total 128 299 100.0 % 148 378 100.0 % 162 541 100.0 % 166 217 100.0 %
Risk Portfolio - Secured (mNOK) 2016 2017 2018 2019
Current 91 510 94.3 % 106 859 93.9 % 119 752 93.9 % 121 727 93.6 % 2013 2014 2015 2016 2017 2018 2019
5-30 dpd 3 720 3.8 % 4 787 4.2 % 5 389 4.2 % 5 311 4.1 %
31-60 dpd 615 0.6 % 753 0.7 % 691 0.5 % 917 0.7 %
61-90 dpd 170 0.2 % 231 0.2 % 226 0.2 % 365 0.3 %
NPL 1 052 1.1 % 1 211 1.1 % 1 435 1.1 % 1 710 1.3 %
Coverage ratio2
Total 97 067 100.0 % 113 841 100.0 % 127 492 100.0 % 130 029 100.0 %
Risk Portfolio - Unsecured (mNOK) 2016 2017 20183 20193 126.9
107.7 113.6 109.7
98.6 96.9 93.5
Current 27 327 87.5 % 29 963 86.8 % 30 532 87.1 % 30 912 85.4 %
5-30 dpd 1 731 5.5 % 2 019 5.8 % 1 869 5.3 % 1 780 4.9 %
31-60 dpd 426 1.4 % 576 1.7 % 526 1.5 % 578 1.6 %
61-90 dpd 224 0.7 % 279 0.8 % 237 0.7 % 308 0.9 %
NPL 1 525 4.9 % 1 700 4.9 % 1 885 5.4 % 2 610 7.2 %
2013 2014 2015 2016 2017 2018 2019
Total 31 233 100.0 % 34 537 100.0 % 35 049 100.0 % 36 188 100.0 %
Source: SCB Group Risk Department
1) NPL ratio = Non-performing loans / Gross loans
2) Coverage Ratio = Loan Loss Reserves (Write Downs) / NPL
3) The increases in NPL ratio for unsecured is mainly due to the change in write-off policy in Sweden, Denmark and Finland during Oct 2018 and Norway in July 2019. The policy extends the time before contracts get written off from 180 to 720
days past due
26Capital and
Funding
03Strict capital requirements in Norway
Ensuring strong capitalization of the bank
Capital requirements in Norway
Group CET1-ratio requirement from Dec-2019
Strict requirements in Norway with higher Pillar 2
Pillar 2 Guidance 1% and countercyclical buffer requirements.
4.3%
Pillar 2 CET1-requirement Pillar 2 Requirement 3.3%
~4.3% Pillar 2 requirement for SCB Group was set to
3.3% by the Norwegian FSA. In addition, a Pillar 2
Guidance of 1.0% was introduced. Both are
Countercyclical buffer 1.6%
applicable from 31.12.2019.
Systemic risk buffer 3% During 2020, the Countercyclical buffer
~15.9% requirement for SCB Group will increase to
~ 1.84%. Denmark will increase with 100bps, from
~11.6%
Conservation buffer 2.5% ~11.6% 1% to 2%. Norway, Sweden and Finland will
Pillar 1 CET1-requirement
maintain their Countercyclical buffer at 2.5%, 2.5%
and 0%, respectively.
Minimum CET1 requirement 4.5%
Systemic risk buffer expected to reduce capital
requirements from Dec-2020 with ~1.48% as it will
enable banks to use the system risk buffer in the
jurisdiction where it operates.
Source: SCB Group 2019 Annual Report
28Strong Capital Position
CET1 ratio of 18.1%
Capital ratios evolution SCB Group (%) 2019 Capital developments
• SCB Group is using the transitional rules for
IFRS9 capital impact when calculating capital
22,0 ratios
20,0
19,1 19,0
18,7
18,1 • SCB Group had a CET1-ratio of 18.1% per
17,4 17,5 17,6
financial year-end using transitional rules for
15,5 15,7
15,1 IFRS9. The CET1-ratio is 219bps higher than
13,1 the regulatory requirement
11,5 12,0 12,0
• SCB Group improved its strong Leverage Ratio
to 13.1%
• In December 2019, SCB Group issued two new
Subordinated loans of SEK 750 million each
• No dividend payment to the parent in 2020 due
2016 2017 2018 2019 to capital planning for the Forso Nordic AB
CET 1 Tier 1 Tier 2 Leverage ratio acquisition
Source: SCB Group 2019 Annual Report
29Self-funding is a strategic focus
Three pillars approach provides funding flexibility
Funding Composition1 In Norway deposits are guaranteed up to NOK 2
million
NOK billion
37,5 Bn Deposits In EU countries the guarantee is up to EUR 100,000
25 % NOK 65.5 billion in total deposits across Norway,
Unsecured Bonds Sweden and Denmark
Deposits 65,5 Bn
Securitization 30,0 Bn 44 %
20 % NOK 8,091 billion outstanding in the bond market
Parent Funding
including NOK 750 million in Commercial Paper
15,9 Bn SEK 8,425 billion outstanding in the bond market
11 % including SEK 1,320 million in Commercial Paper
Unsecured Green bond framework published in Dec’19
DKK 1,250 million outstanding in the bond market
Self-funding ratio EUR 2,000 million outstanding from four benchmark
77% 73% 80% transactions
62% 70% 70%
50%
22% 28%
6 outstanding transactions across Nordics
Securitization
Represents a low-cost and stable funding source
2011 2012 2013 2014 2015 2016 2017 2018 2019
Source: SCB Group 2019 Annual Report
1) Outstanding amounts/transactions as per Q4 2019
30Deposits at a glance
Consolidated total balance: NOK 65.5 billion
Deposit balance development Distribution of Deposit portfolio and products
NOK billion
26.5
41%
22.1 of total balance
20.9
19.8
19.2 Savings account
18.6
17.2 N/A
14.9 14.4 15.4 15.4
14.3
11.9
10.5
8.0
29% 30%
of total balance of total balance
Savings account Savings account
2015 2016 2017 2018 2019 Notification product Notification product
Term deposits
Norway Sweden Denmark
Source: SCB Group 2019 Annual Report
Deposit guarantees: Norway NOK 2 million | Sweden EUR 100,000 | Denmark EUR 100,000 equivalent
31SCB AS Green Bond Framework
Defining an ambitious Framework, in line with best practices and standards
Rationale for issuing Green Bond SCB AS Green Bond Framework description
SCB AS intends to: Financing and / or refinancing of new and existing retail
Use of
Align its sustainability strategy to its funding strategy Proceeds
loan and lease contracts for electric passenger vehicles
Contribute to the development of a sustainable financial market, (EVs only)
while playing a role in the transition to a low carbon economy
Project
Contribute to the achievement of the UN SDGs In accordance with the Eligibility Criteria and carried out
Evaluation and
by the Green Bond Working Group (‘GBWG’)
Diversify the investor base targeting SRI and dark green Selection
investors, while fostering the relationship with existing investors
Management of Green Bonds net proceeds managed in a portfolio
proceeds approach
Following best practice and latest market developments
Allocation reporting annually until full allocation
SCB AS Green Bond Framework:
Reporting Pre-issuance impact reporting. Impact calculation by
Is in line with the ICMA Green Bond Principles 2018 expert consultant Multiconsult
Follows the recommendations of draft EU Taxonomy and of CBI
Low Carbon Transport Standards SPO by Sustainalytics and CBI Certification for the
External
Will be updated to reflect emerging good practices, such as the Review
upcoming transaction
EU Green Bond Standard Auditor limited assurance report on the allocation report
SCB AS Green Bond Framework is aligned with ICMA GBP 2018 and Eligibility Criteria comply with the recommendation of the draft Technical Expert
Group (TEG) report on the EU Taxonomy
32Unsecured Senior & Commercial Paper Funding
2019 summary
Senior Unsecured Commercial Paper
2019 NOK SEK EUR DKK NOK SEK
New Issuances Volume 2,300 million 2,355 million 1,000 million 750 million 1,150 million 3,962 million
New Issuances # 3 2 2 1 6 30
Taps # 1 4 - - - 4
Maturities 3,760 million 1,450 million 1,000 million - 1,300 million 3,517 million
Outstanding Volume¹ 7,341 million 7,105 million 2,000 million 1250 million 750 million 1,320 million
Outstanding bonds # 9 10 4 2 4 11
Format FRN FRN FXD FRN FXD/FRN FXD
Issued Tenor 3 – 5 year 3 – 5,5 year 3 – 5 year 3 year 4 – 6 months 3 – 6 months
Source: Bloomberg
1) Outstanding amounts as per Q4 2019
33Unsecured Funding
Maturity profile Q4 2019 – 2024 for Senior Unsecured and Commercial Paper
Total DKK million
TotalMaturity
Maturity DKK
500
750
(EUR million)
(EUR MM) EUR
SEK
2020 2021 2022 2023 2024 2025
100 NOK
EUR million
500 500 500 500
500
500 2020 2021 2022 2023 2024 2025
Commercial Paper Senior
SEK million 2 320 2 250
1 605
1 250 1000
222 67 154 500 500
2020 2021 2022 2023 2024 2025
215
Commercial Paper Senior
NOK million 2 900
294 2 541
258
1 350 1 300
137 120 132 96
2020 2021 2022 2023 2024 2025 2020 2021 2022 2023 2024 2025
Source: Bloomberg, Management Figures (outstanding amounts as per Q4 2019)
FX: EURNOK 9.8638 | EURSEK 10.4468 | EURDKK 7.4715
34Key takeaways
Anchored by a global banking
franchise
Sustained market leader in auto
and strengthening position
through acquisitions
Building out position in
unsecured space through new
digital offerings and strong
partnership
Robust financial results
Prudent credit risk
35Appendix Santander Group & Santander Consumer Finance
Santander Group
Section
divider

                  04
Santander, a leading financial group
Key Figures Dec’19
Total assets (trill. €) 1.52
Underlying Profit 2019 (mill. €) 8,252
Underlying Profit 2018 (mill. €) 8,064
Headcount 196,419
Customers (millions) 145
Shareholders (millions) 3.99
Branches (units) 11,952
38Well diversified between Europe and the Americas
(*) As a % of operating areas. Excluding Corporate Centre and Santander Global Platform.
NOTE: SCF excluding SCUK
39With leading positions in its core markets
North America Europe
United States3 Mexico
United Kingdom1 Poland2
Loans: 3% Loans: 13%
Deposits: 14% Loans: 10% Loans: 12%
Deposits: 3%
Deposits: 9% Deposits: 12%
Portugal Spain
South America Loans: 18% Loans: 17%
Deposits: 16% Deposits: 19%
Chile Argentina Brazil
Loans: 18% SCF5
Loans: 10% Loans: 10%
Deposits: 17% Deposits: 12% Deposits4: 11% Nº of countries: 15
Top 3
Data: Market-share as at Jun-19 and SCF and the US latest available. (1) Includes London Branch (2) Including SCF business in Poland (3) In all states where Santander Bank operates (4) Includes debenture, LCA
(agribusiness notes), LCI (real estate credit notes), financial bills (letras financieras) and COE (certificates of structured operations) (5) Countries in Europe, including the UK. Top 3 in retail car finance in its key markets
40Santander vision: The Santander Way
41Santander vision: building a responsible bank
Continuing to do business in a more responsible and sustainable way
Note: figures as of 2019 (not audited yet) and changes on a YoY basis (2019 vs. 2018)
1) Source: Mercer benchmark
2) Dow Jones Sustainability index 2019
3) Microentrepreneurs are already included in the people financially empowered metric
422019 Highlights
Delivering Growth, Profitability and Strength in a responsible way
1) Excluding RWA inflation coming from TRIM and other regulatory impacts, otherwise +2bps increase
2) Board intends to propose to the 2020 AGM that the total payment of the remuneration against 2019 results will be 0.23 euros per share split
in (1) a dividend in cash of 0.20 euros per share and (2) a scrip dividend that will entail the payment in cash, for those shareholders who so 43
choose, of 0.03 euros per share2019 Highlights. P&L
Profitable growth and solid organic capital generation
Note: Net capital gains and provisions amount to -€1,737mn in 2019 (in constant €)
44On track to deliver our medium-term goals
(1) Active customer who receive most of their financial services from the Group according to the commercial segment that they belong to
(2) Log ins to personal area of internet banking or mobile phone or both in the last 30 days
(3) The percentage of new business carried out through digital channels in the period
(4) 2019-22 underlying EPS CAGR
45Santander Consumer Finance
05Santander Consumer Finance, European leader in
the consumer finance industry
Key Figures Dec’19
Grupo Santander is the
Loans (bill. €) 116
main and unique
shareholder of SCF ... Deposits (bill. €) 40
… and at the same time, Underlying Att. Profit 2019 (mill. €) 1,470
SCF acts as a holding
for its subsidiaries Underlying Att. Profit 2018 (mill. €) 1,418
through a banking license
European countries 15
Operations are mainly
Market positions1 Top 3
done through points-of-
sale (dealers and
retailers) Customers (million) 20
PoS partners (thousand) >130
SCF: Management perimeter (i.e. including SCUK)
(1) In retail car finance in its key markets
NOTE: Underlying Attributable Profit 2018 restated in Q3-19 (digitalization expenses) 47Recurrent profits through the cycle
Underlying Attributable Profit
€ Million
1 470
1 418
CAGR: 1 373
+12% 1 238
1 093
895 908
825
744
555
472
2009 2010 2011 2012 2013 2014 2015 2016 2017 2018 2019
SCF: Management perimeter (i.e. including SCUK)
NOTE: Underlying Attributable Profit 2018 restated in Q3-19 (digitalization expenses)
48Significant contributor to Santander’s results,
representing 13% of the Group’s profit* in 2019
SCF, 13%
SCF excluding SCUK. Including SCUK, SCF represents 14% of SAN profit*
(*) As a % of operating areas. Excluding Corporate Centre and Santander Global Platform
49Well spread across Europe and well balanced
between car loans and consumer lending
SCF Portfolio: €116 bn
Dec’19
Well spread across 15 European
countries
Important foothold in the largest
economies
73% portfolio in AAA & AA countries
Car financing represents the biggest
share of the portfolio: 74%
Consumer lending (durables financing,
cash loans and credit cards): 18%
SCF: Management perimeter (i.e. including SCUK).
NOTE: SCF’s portfolio also includes mortgages (5%) and corporate loans & others (3%)
50Advanced car financing platform and strong foothold
in consumer lending
Advanced car financing platform Strong foothold in consumer lending
Presence in all main European markets TOP retail chain agreements
throughout Europe
TOP positions in its geographies,
including the 5 biggest European auto >55,000 POS partners
markets: Germany, France, UK, Italy
and Spain >5.7 MM consumer loans during last
year
>75,000 POS (captive and non-captive)
TOP positions in core geographies
The longest European captive
agreements base: more than 115 Digital direct business platforms
agreements with 15 manufacturers
Consumer Lending: Durable financing, Personal loans and Credit Cards
51Sound risk metrics
NPL Ratio (%) Risk KPIs better than sector average
6,3%
4,6% Strong capacity to balance adverse
economic cycles across geographies
2,1%
Low cost of risk, despite important
increase in SCF’s loan portfolio
Cost of Risk (LLPs over ANEAS %)
Adaptation of risk management for the
2,53%
1,73%
growing digital business while being
involved in the ecosystem platforms
0,47%
initiatives
2008 2009 2010 2011 2012 2013 2014 2015 2016 2017 2018 2019
SCF: Management perimeter (i.e. including SCUK)
52Funding diversification
SCF’s funding structure (%)
Dec’19 High diversification of funding
sources
Capacity to do issuances in all
countries
Diversification of deposits.
Different initiatives to develop
retail deposits
Increasing long-term finance vs
short term
SCF: Management perimeter (i.e. including SCUK)
53With clear strategic priorities
54Sharing with the Group the same way of doing things
55Thank You.
Our purpose is to help people
and business prosper.
Our culture is based on believing
that everything we do should be:
NordicsYou can also read