Frasers Centrepoint Trust - Investor Presentation for Citi Pan Asia Regional Investor Conference (Virtual Conference) 19-21 May 2020 - Frasers ...
←
→
Page content transcription
If your browser does not render page correctly, please read the page content below
Frasers Centrepoint Trust
Investor Presentation for
Citi Pan Asia Regional Investor Conference
(Virtual Conference)
19-21 May 2020

◆   Certain statements in this Presentation constitute “forward-looking statements”, including forward-looking financial information. Such forward-looking statement and financial information involve known
    and unknown risks, uncertainties and other factors which may cause the actual results, performance or achievements of FCT or the Manager, or industry results, to be materially different from any
    future results, performance or achievements expressed or implied by such forward-looking statements and financial information. Such forward-looking statements and financial information are based
    on numerous assumptions regarding the Manager’s present and future business strategies and the environment in which FCT or the Manager will operate in the future. Because these statements and
    financial information reflect the Manager’s current views concerning future events, these statements and financial information necessarily involve risks, uncertainties and assumptions. Actual future
    performance could differ materially from these forward-looking statements and financial information.
◆   The Manager expressly disclaims any obligation or undertaking to release publicly any updates or revisions to any forward-looking statement or financial information contained in this Presentation to
    reflect any change in the Manager’s expectations with regard thereto or any change in events, conditions or circumstances on which any such statement or information is based, subject to compliance
    with all applicable laws and regulations and/or the rules of the SGX-ST and/or any other regulatory or supervisory body or agency. The value of Units in FCT and the income derived from them may
    fall as well as rise. The Units in FCT are not obligations of, deposits in, or guaranteed by, the Manager or any of their affiliates. An investment in the Units in FCT is subject to investment risks,
    including the possible loss of the principal amount invested. Unitholders of FCT should note that they have no right to request the Manager to redeem their Units while the Units are listed. It is intended
    that Unitholders of FCT may only deal in their Units through trading on the SGX-ST. Listing of the Units on the SGX-ST does not guarantee a liquid market for the Units.
◆   This Presentation contains certain information with respect to the trade sectors of FCT’s tenants. The Manager has determined the trade sectors in which FCT’s tenants are primarily involved based
    on the Manager’s general understanding of the business activities conducted by such tenants. The Manager’s knowledge of the business activities of FCT’s tenants is necessarily limited and such
    tenants may conduct business activities that are in addition to, or different from, those shown herein.
◆   This Presentation is for information only and does not constitute an invitation or offer to acquire, purchase or subscribe for any securities of FCT. The past performance of FCT and the Manager is not
    necessarily indicative of the future performance of FCT and the Manager.
◆   This Presentation includes market and industry data and forecast that have been obtained from internal survey, reports and studies, where appropriate, as well as market research, publicly available
    information and industry publications. Industry publications, surveys and forecasts generally state that the information they contain has been obtained from sources believed to be reliable, but there
    can be no assurance as to the accuracy or completeness of such included information. While the Manager has taken reasonable steps to ensure that the information is extracted accurately and in its
    proper context, the Manager has not independently verified any of the data from third party sources or ascertained the underlying economic assumptions relied upon therein.
◆   This advertisement has not been reviewed by the Monetary Authority of Singapore.

                                                                                                                                                                                                               2
FCT Overview
Financial Results for the Second Quarter ended 31 March 2020
Outlook
Appendix

                                                               3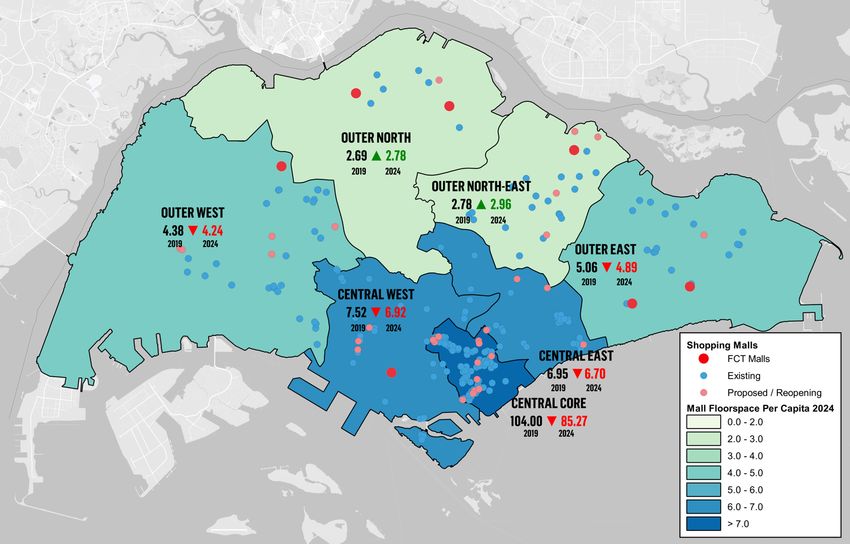
◆    SGX-listed REIT that owns and invests primarily in suburban retail
     properties in Singapore, focused on Singapore domestic necessity
     spending, F&B and services

◆    FCT’s property portfolio comprises 7 suburban retail properties in
     Singapore totalling 1.4 million sq ft of NLA. FCT also owns a 24.82%
     stake1 in PGIM ARF which owns, among others, 5 suburban retail
     properties in Singapore totalling 1.0 million sq ft of NLA, and 31.15%
     stake in Hektar REIT which owns a portfolio of suburban retail properties
     in Malaysia.

◆    Opportunities to acquire retail properties from Sponsor and 3rd parties to
     support growth

◆    Sponsored by Frasers Property Limited, a multi-national company that
     owns, develops, and manages a diverse and integrated property portfolio

    1.   FCT and FPL each owns approximately 24.8% and approximately 63.1% stake in PGIM ARF, respectively
                                                                                                             4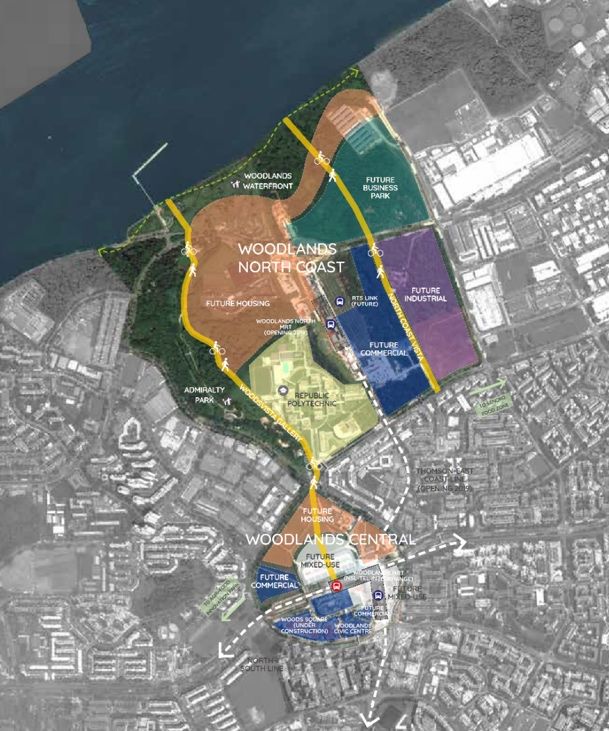
FCT Retail Portfolio (~1.4 million sq ft NLA)

                                                                                                                                                           ◆   Among the largest suburban retail
                                                                                                                                                               property owners in Singapore
   Anchorpoint       YewTee Point     Causeway Point          Northpoint City               Waterway Point1     Changi City Point        Bedok Point
                                                       North Wing (FCT), South Wing (FPL)
                                                                                                                                                           ◆   All properties are located in the
                                                                                                                                                               suburban regions, on or near
                                                                                                                                                               MRT stations and / or bus
                                                                                                                                                               interchanges

                                                                                                                                                           ◆   Steady and recurring shopper
                                                                                                                                                               footfall underpinned by local
                                                                                                                                                               residential catchment and
                                                                                                                   Coloured lines: MRT lines                   commuting traffic
                                                                                                                   Malls owned by FCT
PGIM ARF Retail Portfolio (~1.0 million sq ft NLA)                                                                 Malls owned by PGIM ARF

                                                                                                          1. FCT owns 40.0% of Sapphire Star Trust which
                                                                                                             holds Waterway Point

                                                                                                          2. FCT and FPL each owns approximately 24.8%
                                                                                                             and approximately 63.1% stake in PGIM ARF,
                                                                                                             respectively
Tiong Bahru Plaza   Hougang Mall    White Sands Mall   Century Square          Tampines 1
                                                                                                                                                                                                   5
Necessity & convenience shopping            Fun for the family

Everyday dining                  Essential services                        Social and family dining

                                                                                                      6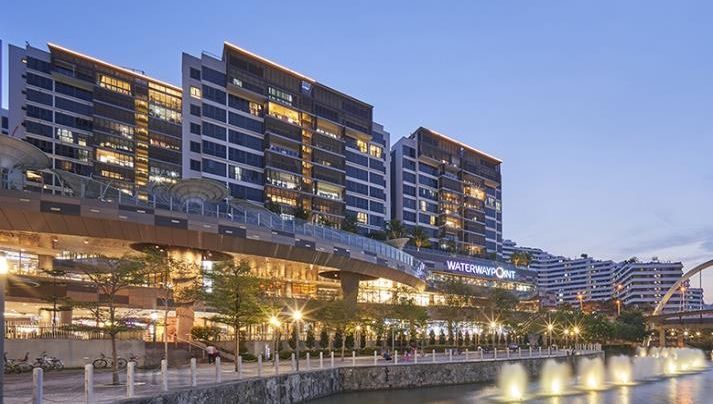
Yishun
Yew Tee Woodlands Northpoint City
YewTee Point Causeway Point North Wing (FCT) and South Wing (FPL)
◆ FCT’s key malls are
Punggol
located in north and
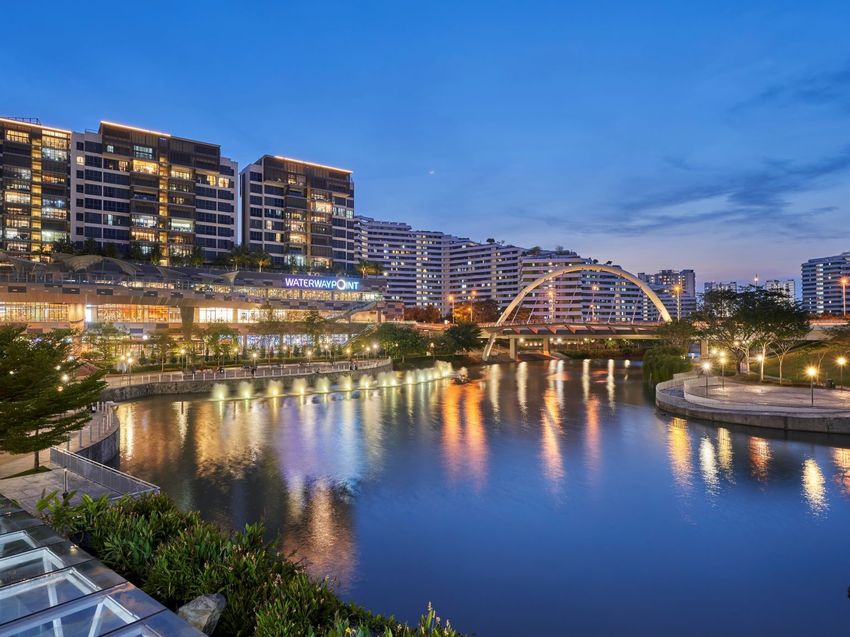
Waterway Point north-east regions that
Bedok
have low retail space per
Bedok Point capita of below 3, which
is below national average
Changi Business Park
Changi City Point ◆ Lower retail space per
capita implies more
opportunities to grow
footfall to the malls in that
region, which will help to
enhance FCT’s resilience
to headwinds in the retail
industry
Queenstown
Anchorpoint
Source: Cistri, August 2019
7
◆   The three largest malls in FCT’s portfolio are located in HDB towns with good growth potential
◆   Punggol currently has 10,632 (last year: 8,806) new flats under construction and is the fastest growing HDB town

                                                                                 HDB
                                            Resident                                             Current                          Growth
                                           Population
                                                               Current           units
                                                                                                 Units +
                                                                                                                      HDB
                                                                                                                                potential to                Healthy room for growth
 FCT Malls              HDB Town                              number of         Under                               Projected
                                             @ 31                                              Units under                       Projected
                                                              HDB units        construc-                            Ultimate
                                           March 2019                                          construction                      Ultimate
                                                                                 tion
                                                                                                                                                      Woodlands          71,947        30,053
                                                                                                                                                       (102,000)
 Causeway Point         Woodlands               242,800            69,900            2,047             71,947         102,000      42%

                        Yishun                  197,300            64,334            4,498             68,832          84,000      22%         Yishun+Sembawang          99,162             49,838
 Northpoint City                                                                                                                                    (149,000)

                        Sembawang                 73,800           27,351            2,979             30,330          65,000      114%
                                                                                                                                                          Punggol        60,541     35,459
                                                                                                                                                        (96,000)
 Waterway Point         Punggol                 138,700            49,909          10,632              60,541          96,000      58%

                                                                                                                                                                     0              100,000             200,000
Source: Key Statistics, Housing & Development Board (HDB) Annual Report 2018/19 and HDB website at www.hdb.gov.sg                                    Current Units       Growth potential to Projected Ultimate

                                                                                                                                                                                                                  8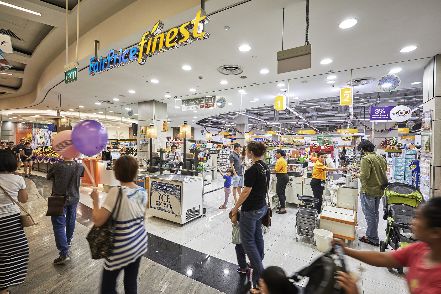
◆   Regional Centre                                                                     ◆   The Next Generation
    poised in Singapore’s                                                                   Smart & Integrated
    North region                                                                            District
◆   New business,                                                                       ◆   SIT's Punggol campus,
    industry, R&D and                                                                       Singapore's first
    learning & innovation                                                                   university in the north-
    institution to be                                                                       east, will be up by 2023;
    introduced                                                                              able to accommodate
                                  Causeway
                                                                                            12,000 students
◆   New Thomson-East
                                    Point
    Coast MRT Line with                                                                 ◆   JTC expects the
    Woodlands Station as                                                                    Punggol Digital District
    interchange to current                                                                  to generate up to 28,000
    North-South Line                                                                        digital economy jobs
                             Source: URA

                                             Source: Straits Times, 10 September 2019

                                                                                                                        9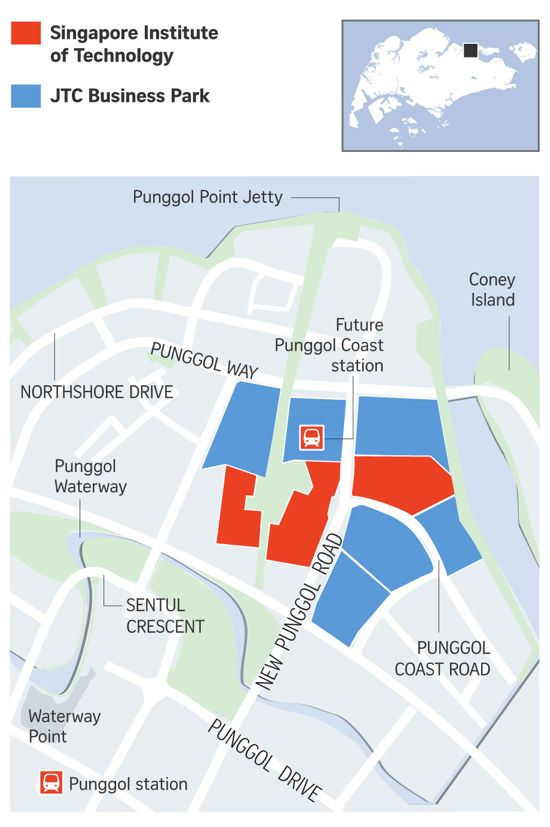
•   Frasers Experience app (FRx) is the digital platform to redefine how
                             we interact with our shoppers; to enhance shopper experiences at our
                             malls; to offer more benefits with less time needed and more
                             conveniences with less hassle

                             • Earn rewards points via QR code at more than 1300 retailers at the
                               14 Frasers Property malls
                             • Digital Gift Card and e-wallet for cashless payment which supports
                               ALIPAY, GrabPay and WeChat Pay1
                             • Features the exclusive “Makan Master”, a digital F&B concierge
                               service for pre-booking and reservations at participating F&B
                               outlets at Frasers Property malls

1.   From 9 March 2020
                                                                                                    10
Future
Northpoint 2 Bedok Changi City Yishun 10 Investment in Waterway Point Opportunities
YewTee Point Point Point Retail Podium PGIM ARF (40%-stake)
2010 2011 2014 2016 2019 2019 • Northpoint City South
Acquisition Wing
24.82% in
Growth PGIM ARF • Acquisition
opportunities of 3rd
party assets
Anchorpoint Northpoint Causeway Point
Causeway Point 2012 Northpoint City North
2008 2010 2019
Asset Wing
Underground Pedestrian Link
2017
Enhancement
Growth
Organic Growth
Rental Active lease Maintain high Grow footfall Environmental, social and
growth management occupancy governance (ESG)
initiatives
11® Investments in PGIM ARF and Waterway Point strengthened FCT’s position as a leading
suburban retail REIT in Singapore
Poised for growth ® Opportunity for growth through acquisitions
® AEI opportunities to optimise property performance
® Continue to focus on necessity spending, convenience, accessibility and F&B offering
which underpin the resilience of the suburban retail market
Quality assets with ® Continue to improve the physical and digital experience of our shoppers via Frasers
resilient Experience app platform and loyalty program
performance
® Strong presence in the northern and north-eastern precincts with good shopper catchment
growth
® Continue to focus on Singapore suburban retail sector and expand market share in
Singapore-centric, this sector
suburban- focused
REIT
12Financial Results for the Second Quarter ended 31 March 2020
23 April 2020
Waterway Point2Q20 Results Highlights
Financial highlights
• Gross revenue of S$50.2 million, up 0.9% y-o-y
• NPI of S$36.0 million, down 1.3% y-o-y
• DPU of 1.61 cents, down 48.7% y-o-y (2Q19: 3.137 cents)
• NAV and NTA per Unit of S$2.21 as at 31 March 2020
• Gearing level at 37.4%1 as at 31 March 2020
Operational update
• 96.1% portfolio occupancy as at 31 March 2020
• Year-to-date portfolio average rental reversion at 5.2%2
Waterway Point, Singapore
S$3.7 billion >1.4 million sq ft Key dates for 2Q20 DPU
Total Assets Portfolio Net Lettable Area
• Ex-Date: 30 April 2020
7 • Books Closure Date: 4 May 2020
Properties under management
• DPU payment: 29 May 2020
1.In accordance with the Property Funds Appendix, the gearing ratio included FCT’s 40% proportionate share of deposited property value and borrowing in SST. This gearing includes S$80
million of short-term borrowing drawn on 27 March 2020 to repay a S$90 million MTN which matured on 3 April 2020. Post the MTN repayment, the gearing is 33.3%
2.Includes Waterway Point
14• Revenue growth mainly from increase in gross rent from renewals and step-up rents from existing leases
• Retention of 50% of distributable income to preserve financial flexibility in current time of uncertainty
• DPU of 1.61 cents is 48.7% lower y-o-y, due to enlarged unit base and cash retained
• Proportion of management fee paid in new Units remains at 20%
Increase /
S$’000 2Q20 2Q19
(Decrease)
Gross Revenue 50,168 49,733 0.9%
Property Expenses (14,204) (13,289) 6.9%
NPI 35,964 36,444 (1.3%)
Income available for distribution before dividends 25,199 27,673 (8.9%)
Dividends from associates and joint ventures 10,8031 1,135 851.8%
Income available for distribution 36,002 28,808 25.0%
Distribution to Unitholders 18,000 29,158 (38.3%)
DPU 1.610 3.137 (48.7%)
1. Includes dividends from PGIM ARF: S$6.012 million and SST: S$3.779 million (this amount excludes interest income of S$0.683 million from SST) (2Q19: nil)
15• Increase in distributable income mainly from dividends from PGIM ARF and 40%-stake in SST (1H19: nil)
• 1H20 DPU of 4.67 cents is 24.2% lower y-o-y due mainly to larger unit base and cash retained in 2Q20
Increase /
S$’000 1H20 1H19
(Decrease)
Gross Revenue 99,920 99,014 0.9%
Property Expenses (27,637) (27,183) 1.7%
NPI 72,283 71,831 0.6%
Income available for distribution before dividends 51,547 54,339 (5.1%)
Dividends from associates and joint ventures 19,4761 2,161 n.m.
Income available for distribution 71,023 56,500 25.7%
Distribution to Unitholders 52,202 57,179 (8.7%)
DPU 4.670 6.157 (24.2%)
1. Includes dividends from PGIM ARF: S$10.133 million and SST: S$7.415 million (this amount excludes interest income of S$1.408 million from SST) (1H19: nil)
16◆ The portfolio revenue grew 0.9% on rental growth from all properties except Changi City Point and Anchorpoint.
◆ The growth was partially offset by lower turnover rent due to tenants’ sales, lower carpark income (complimentary
parking between 22 February 2020 and 31 March 2020) and no atrium rental income from February 2020.
Gross Revenue
S$ million Share of results of
2Q20 2Q19 Joint Venture2
Due to absence of
▲0.9% carpark income Based on FCT’s 40% share of
50.17 49.73 after expiry of car results in joint venture SST
Lower turnover park management Improved
rent due to which holds Waterway Point
contract on 30 Nov occupancy and
COVID-19 2019 average rental
rate
▲1.8%
22.27 21.87 ▲0.2%
13.56 13.53 ▼0.8%
6.99 ▲2.5% ▼6.6% ▲8.3% 7.67
6.93
3.69 3.60 2.03 2.18 1.69 1.56
FCT Portfolio Causeway Point Northpoint City Changi City Point YewTee Point Anchorpoint Bedok Point Waterway Point
North Wing1
Any discrepancy between individual amount and the aggregate is due to rounding.
1. Includes contribution from Yishun 10 retail podium
2. FCT acquired the stake in SST which holds Waterway Point in 3Q FY2019, hence there is no year-on-year comparison with FY2019
17Gross Revenue
S$ million
1H20 1H19
▲0.9% Share of results of
99.92 99.01 Due to absence of Joint Venture2
carpark income
after expiry of car Improved Based on FCT’s 40% share of
park management occupancy and results in joint venture SST
Due to contract on 30 Nov average rental which holds Waterway Point
higher 2019 rate
▲0.6%
occupancy
43.89 43.64
▲0.7%
27.24 27.04
▲0.7%
▲3.3% 15.53
13.91 13.81 ▼5.5% ▲11.4%
7.39 7.15 4.05 4.29 3.44 3.08
FCT Portfolio Causeway Point Northpoint City Changi City Point YewTee Point Anchorpoint Bedok Point Waterway Point
North Wing1
Any discrepancy between individual amount and the aggregate is due to rounding.
1. Includes contribution from Yishun 10 retail podium
2. FCT acquired the stake in SST which holds Waterway Point in 3Q FY2019, hence there is no year-on-year comparison with FY2019
18◆ Property expenses variances mainly due to absence of property tax writebacks at Causeway Point, Changi
City Point and YewTee Point which occurred in 2Q19
Property Expenses
S$ million Share of results of
Absence of
Joint Venture2
2Q20 2Q19 Absence of property Absence of Absence of carpark expense
tax writeback and property tax property tax due to expiry of Based on FCT’s 40% share of
higher AV provision writeback writeback results in joint venture SST which
car park
for this FY; and which which management holds Waterway Point
▲6.9%
higher security and occurred in occurred in contract on 30
14.20 cleaning costs 2Q19 2Q19 Nov 2019
13.29
▲16.0%
5.60 ▼5.4% ▲16.9%
4.82
3.26 3.44 ▲20.0% ▼16.7% ▼0.5%
2.35 2.01
1.08 0.90 0.92 1.11 1.00 1.00 1.62
FCT Portfolio Causeway Point Northpoint City Changi City Point YewTee Point Anchorpoint Bedok Point Waterway Point
North Wing1
Any discrepancy between individual amount and the aggregate is due to rounding.
1. Includes contribution from Yishun 10 retail podium
2. FCT acquired the stake in SST which holds Waterway Point in 3Q FY2019, hence there is no year-on-year comparison with FY2019
19Property Expenses
S$ million Share of results of
1H20 1H19 Absence of
Joint Venture2
carpark expense
Absence of Absence of one- due to expiry of Based on FCT’s 40% share of
▲1.7% results in joint venture SST which
property tax off marketing car park
27.64 writeback and expense relating Absence of property tax management Due to one-off holds Waterway Point
27.18
higher AV provision to official opening writeback which occurred in contract on 30 upgrade cost
for this FY of Northpoint City 2Q19 Nov 2019 of a chiller
▲10.5%
10.76 9.74 ▼8.7% ▲4.6%
6.35 6.95 ▲5.4% ▼14.9%
4.53 ▲3.6%
4.33 3.38
2.09 1.98 1.94 2.27 1.97 1.90
FCT Portfolio Causeway Point Northpoint City Changi City Point YewTee Point Anchorpoint Bedok Point Waterway Point
North Wing1
Any discrepancy between individual amount and the aggregate is due to rounding.
1. Includes contribution from Yishun 10 retail podium
2. FCT acquired the stake in SST which holds Waterway Point in 3Q FY2019, hence there is no year-on-year comparison with FY2019
20◆ NPI margin for 2Q20 at 71.7%, 1.6%-point lower than 73.3% in 2Q19
NPI
S$ million Share of results of
2Q20 2Q19 Joint Venture2
Based on FCT’s 40% share of
▼1.3% results in joint venture SST which
36.44 holds Waterway Point
35.96
▼2.2%
16.67 17.05 ▲2.1%
10.30 10.09 ▼8.0%
▼3.3%
▲3.8% ▲23.9% 6.06
4.58 4.97
2.61 2.70
1.11 1.07 0.69 0.56
FCT Portfolio Causeway Point Northpoint City Changi City Point YewTee Point Anchorpoint Bedok Point Waterway Point
North Wing1
Any discrepancy between individual amount and the aggregate is due to rounding.
1. Includes contribution from Yishun 10 retail podium
2. FCT acquired the stake in SST which holds Waterway Point in 3Q FY2019, hence there is no year-on-year comparison with FY2019
21NPI
S$ million Share of results of
1H20 1H19 Joint Venture2
▲0.6% Based on FCT’s 40% share of
72.28 71.83 results in joint venture SST which
holds Waterway Point
▼2.3%
33.13 33.89
▲ 4.0%
20.90 20.09
▼ 1.1%
▲ 2.5% 12.15
9.38 9.48 ▲ 5.0% ▲24.1%
5.30 5.17
2.12 2.02 1.47 1.18
FCT Portfolio Causeway Point Northpoint City Changi City Point YewTee Point Anchorpoint Bedok Point Waterway Point
North Wing1
Any discrepancy between individual amount and the aggregate is due to rounding.
1. Includes contribution from Yishun 10 retail podium
2. FCT acquired the stake in SST which holds Waterway Point in 3Q FY2019, hence there is no year-on-year comparison with FY2019
22Financial position
◆      Gearing at 33.3%1, cost of borrowings down to 2.44%
◆      25 March 2020: Moody’s downgraded FCT’s credit rating from Baa1 to Baa2 and its outlook from stable to negative
◆      13 April 2020: S&P downgraded FCT’s credit rating from BBB+ to BBB and placed on CreditWatch negative
                                                                           31 March 2020                          31 December 2019                          30 September 2019
     Gearing ratio2                                                              34.7%3                                    33.2%                                     32.9%

     Interest cover ratio for the quarter4                                     6.40 times                               5.93 times                                5.34 times

     Total borrowings                                                      S$1,146 million                           S$1,054 million                           S$1,042 million
     % of borrowing on fixed rates or hedged
                                                                                   50%                                      53%                                       50%
     via interest rate swaps

     Average cost of borrowings (all-in)                                         2.44%5                                    2.57%                                     2.63%

                                                                       S&P: BBB/CR(-ve)                                               S&P: BBB+/Stable
     Credit ratings
                                                                     Moody’s: Baa2/Negative                                          Moody’s: Baa1/Stable

1.    Gearing level after the repayment of the $90 million MTN which matured on 3 April 2020
2.    In accordance with the Property Funds Appendix, the gearing ratio included FCT’s 40% proportionate share of deposited property value and borrowing in SST
3.    Includes $80 million of short-term borrowing drawn on 27 March 2020 to repay a $90 million MTN which matured on 3 April 2020. Post the MTN repayment, the gearing is 33.3%
4.    Calculated as earnings before interest and tax (EBIT) divided by interest expense
5.    For the quarter ended 31 March 2020
                                                                                                                                                                                   24
Key Covenants (tested quarterly) Requirements As at 31 March 2020
Gearing ratio Less than 45% 37.4%1
Interest cover ratio for the quarter2 More than 1.5 times 6.40 times
Unitholders’ Fund More than S$1.2 billion S$2.48 billion
Coverage ratio of unencumbered assets
More than 250% 337%
to Unsecured debt
Changi City Point: Less than 65% Changi City Point: 56%:
Loan-to-Value ratio for secured
YewTee Point : Less than 85% YewTee Point: 72%
borrowings
Anchorpoint: Less than 85% Anchorpoint: 71%
1. Includes $80 million of short-term borrowing drawn on 27 March 2020 to repay a $90 million MTN which matured on 3 April 2020. Post the MTN repayment, the
gearing is 33.3%
2. Calculated as earnings before interest and tax (EBIT) divided by interest expense.
2531 Mar 2020 31 Dec 2019 30 Sep 2019
As at
S$’000 S$’000 S$’000
Non-current assets 3,605,086 Increase in cash 3,603,131 3,594,638
due to proceeds
Trade and other receivables 5,795 from drawdown of 3,351 3,142
short-term facilities
Cash and cash equivalents 105,143 13,225 13,103
Current assets 110,938 16,576 6,245
Total assets 3,716,024 3,619,707 3,610,883
Current liabilities (420,038) (243,270) (365,000)
Non-current liabilities (820,864) (896,914) (774,824)
Total liabilities (1,240,902) (1,140,184) (1,139,824)
Net assets 2,475,122 2,479,523 2,471,059
NAV and NTA per Unit S$2.211 S$2.222 S$2.21
1. The number of units used for computation of NAV and NTA per unit as at 31 March 2020 is 1,118,366,329. This comprises: (i) 1,117,722,136 units in issue as at 31 March 2020; (ii) 287,504 units issuable to
the Manager in April 2020, in satisfaction of 20% of the base fee component of the management fee payable to the Manager for the quarter ended 31 March 2020; and (iii) 356,975 units issuable after financial
year ending 30 September 2020, in satisfaction of 20% of the performance fee component of the management fee payable to the Manager for the six months ended 31 March 2020.
2. The number of units used for computation of NAV and NTA per unit as at 31 December 2019 is 1,117,875,956. This comprises: (i) 1,117,509,051 units in issue as at 31 December 2019; (ii) 213,085 units
issued to the Manager on 24 January 2020, in satisfaction of 20% of the base fee component of the management fee payable to the Manager for the quarter ended 31 December 2019; and (iii) 153,820 units
issuable after financial year ending 30 September 2020, in satisfaction of 20% of the performance fee component of the management fee payable to the Manager for the quarter ended 31 December 2019.
26pro forma based on position as at 31 March 2020
• FCT announced on 11 May 2020 it issued S$200 million 3.20% fixed rate Type of borrowings Aggregate amount
notes (Notes) due 2023 pursuant to the S$3 billion multicurrency debt ■Unsecured bank borrowings S$446.0 million (41.8%)
issuance programme ■Medium Term Notes S$350.0 million (32.8%)
• The Notes has been assigned an issue rating of "BBB" by S&P Global ■Secured bank borrowings1 S$270.0 million (25.4%)
Ratings
Total Borrowings S$1,066.0 million (100.0%)
• Net proceeds were used for the re-financing of existing borrowings and
general working capital and/or capital expenditure requirements of FCT
and its subsidiaries S$200 million Notes
issued on 11 May 2020
Repaid using net proceeds
Figures from Notes issue S$391m
indicated in (36.7% of total
the chart are
borrowing)
in S$ million
S$136m S$130m
(12.7% of total (12.2% of total
borrowing) borrowing) S$189m
S$150m 200 (17.7% of total
Repaid on 3 April 2020 90 50 (14.1% of total borrowing)
borrowing) S$70m
136* 80 70 (6.6% of total
30
190 216 191 borrowing)
120 119
56
70
FY2020 FY2021 FY2022 FY2023 FY2024 FY2025
Any discrepancy between individual amount and the aggregate is due to rounding.
* As at 31 March 3020, the unsecured borrowing for FY2020 was S$190 million. Post this date, FCT drew down additional S$10 million
and repaid S$64 million using the net proceeds from the issuance of the S$200 million Notes to arrive at S$136 million
1. Secured on Anchorpoint and Changi City Point.
27Operational performance
◆     31 March 2020 Portfolio occupancy: +0.1%-point y-o-y and -1.2%-point q-o-q
◆     Changi City Point’s q-o-q decline in occupancy was due to non-renewals of 2 tenants and pre-termination of 1
      tenant during the quarter. These units are currently being marketed.

     Mall Occupancy                      31 Mar 19      30 Jun 19       30 Sep 19       31 Dec 19      31 Mar 2020

     Causeway Point                       97.4%          97.5%           97.0%            97.8%           97.9%

     Northpoint City North Wing1          96.5%          97.1%           99.0%            99.2%           97.0%

     Waterway Point                          -              -            98.0%            97.3%           96.3%

     Changi City Point                    96.7%          96.4%           95.9%            95.8%           91.8%

     Bedok Point                          88.7%          95.0%           95.7%            95.7%           94.3%

     YewTee Point                         94.1%          96.5%           97.1%            98.6%           98.6%

     Anchorpoint                          95.0%          95.0%           79.0%            93.5%           93.1%

     FCT Portfolio                        96.0%          96.8%           96.5%            97.3%           96.1%

1.    Includes Yishun 10 Retail Podium
                                                                                                                     29
◆ WALE @ 31 March 2020 stands at 1.83 years by NLA (1Q20: 1.77 years) and 1.76 years by GRI (1Q20: 1.63 years)
◆ Renewed expiring leases of all anchor tenants due in FY2020
◆ Less than 12% of expiring leases (by NLA) remaining to be renewed in 2H20
Lease expiry profile as % of Total GRI
31.7% 30.6%
■ Expiries as at 31 March 2020 27.8% 26.8%
26.6%
■ Expiries as at 31 December 2019
20.3%
14.0% 13.8%
5.8%
1.9%
0.2% 0.1% 0.2% 0.2%
Lease expiry1 as at 31 Mar 2020 FY2020 FY2021 FY2022 FY2023 FY2024 FY2025 FY2028
Number of leases expiring 153 288 268 151 19 2 1
Leased area expiring (sq ft) 165,573 370,504 496,138 263,817 77,385 2,699 21,248
Expiries as % of total leased area 11.9% 26.5% 35.5% 18.9% 5.5% 0.2% 1.5%
Expiries as % of GRI 14.0% 27.8% 31.7% 20.3% 5.8% 0.2% 0.2%
1. Calculations exclude vacant floor area.
30Change compared
Leased area As % of
(1 Oct 2019 – 31 Mar 2020) No. of renewals with preceding rental
renewed (sq ft) property’s NLA
rates1
Causeway Point 28 85,469 20.3% 6.0%
Northpoint City North Wing2 30 38,752 16.9% 2.8%
Waterway Point 36 61,441 16.5% 6.0%
Changi City Point 24 41,851 20.4% 5.7%
Bedok Point 7 7,674 9.3% 1.6%
YewTee Point 8 14,189 19.3% 6.5%
Anchorpoint 9 19,908 28.0% 5.7%
FCT portfolio average 142 269,284 18.5% 5.2%
1. Based on the variance between the average rental rates between the new lease and the preceding lease, based on same retail space. Reconfigured or amalgamated retail
space is excluded from calculation of rental reversion. Average lease tenure is 3 years.
2. Includes Yishun 10 Retail Podium
31◆ Less than 12% of expiring leases (by NLA) remaining to be renewed in 2H20
Lease area
Lease Expiries in FY2020 Number of as % of leased as % of total GRI of
expiring
As at 31 March 2020 leases expiring area of property property
(sq ft)
Causeway Point 45 44,916 10.9% 17.6%
Northpoint City North Wing1 56 42,375 19.0% 23.9%
Waterway Point 14 19,839 5.6% 4.4%
Changi City Point 11 22,314 11.8% 10.5%
Bedok Point 6 19,189 24.6% 18.9%
YewTee Point 6 5,877 8.1% 8.0%
Anchorpoint 15 11,063 16.6% 20.1%
Total FCT 153 165,573 11.8%2 14.0%3
1. Includes Yishun 10 Retail Podium
2. as % of leased area of FCT Portfolio
3. as % of total GRI of FCT Portfolio
32Portfolio Shopper Traffic Portfolio Tenants’ Sales
◆ Portfolio shopper traffic turned from positive y-o-y ◆ Tenants’ sales psf for the period December 2019 to
change in January 2020 to mild negative in February February 2020 was 4.0% down y-o-y, mainly
2020 and a sharp 9.0% fall in March 2020 attributed to Causeway Point and Changi City Point
◆ Shopper traffic for all malls were significantly impacted ◆ Tenants’ sales psf for the period from September
after consecutive announcements of stricter safe 2019 to February 2020 was 2.5% down y-o-y
distancing measures announced by the Government ◆ COVID-19’s impact was felt across all malls in
◆ Larger malls Causeway Point and Waterway Point saw February 2020. Tenants’ sales at larger malls saw
double-digit fall in March 2020 while smaller malls between 2% and 10% y-o-y fall while smaller malls
YewTee Point and Anchorpoint saw mid-single digit fall saw mixed variances
◆ Overall 2Q20 traffic was 2.4% lower y-o-y ◆ Tenants’ sales for the next few months to be lower
◆ Year-to-date (Oct 19 - Mar 20) traffic was 3.1% higher than February 2020 due to further impact from
y-o-y COVID-19 and the “Circuit Breaker” measures which
commenced on 7 April 2020, and has now been
extended to 1 June 2020
33Update on COVID-19 situation
TSP announced for all 14 malls1 under Frasers Property Retail:

TSP announced on 26 February 2020                                                                                      Enhancements announced on 27 March 2020
•   Passing on the full 15% property tax rebate2 to all                                                                •   Passing on the full property tax rebate2 to all qualifying
    qualifying tenants                                                                                                     tenants

•   Flexibility to convert security deposits paid in cash to                                                           •   Tenants can utilize their cash security deposits to offset
    Banker’s Guarantees to ease tenant’s cashflow                                                                          one month’s rental
    challenges
                                                                                                                       •   Under the S$45m TSP enhancement, one month of rental
•   Flexibility for shorter operating hours                                                                                rebate will be provided to tenants in targeted manner,
                                                                                                                           prioritised by their needs and circumstances
•   Daily complimentary car parking between 12pm and
    2pm, and 6pm and 10pm daily                                                                                        •   One month rental waiver to all entertainment, education
                                                                                                                           and tuition centre tenants affected by the mandatory closure
•   Booking of atrium spaces at reduced atrium rental rates
                                                                                                                           orders from 26 March 2020 to 30 April 2020
•   Additional support and initiatives to be reviewed for
    progressive roll-out

1 The 14 malls in Frasers Property Retail’s portfolio include Anchorpoint, Bedok Point, Causeway Point, Changi City Point, Eastpoint Mall, Northpoint City, The Centrepoint, YewTee Point, Waterway Point, as well
  as five malls under AsiaMalls Management’s portfolio namely Century Square, Hougang Mall, Tiong Bahru Plaza, Tampines 1 and White Sands (Frasers Property Retail announced the acquisition of AsiaMalls
  Management Pte. Ltd. on 10 February 2020).
2 The government announced during the Budget 2020 on 18 February 2020 that it will grant qualifying commercial properties a one-time 15% rebate for property tax payable for the period 1 January 2020 to 31
  December 2020. During the announcement of the Resilience Package on 26 March 2020, the Government announced that the property tax rebate for qualifying commercial properties is increased to 100%.
                                                                                                                                                                                                                     35
4 Mar: Stay- 27 Mar: safe distancing measures implemented; closure
Home Notice of tuition centers, leisure & entertainment venues
for returning
residents and 7 Apr – 1 Jun1: Circuit Breaker Period
Long-term
7 Apr: COVID-19 (Temporary Measures) (Control
pass holders
Order) Regulations 2020 came into force
11 Mar:
WHO 16 April: New measures to help REITs navigate
7 Feb: declares operating challenges posed by COVID-19
DORSCON Covid-19 a
pandemic 22 Apr – 12 May2: Tightened list of essential
raised to
services - All standalone F&B, hairdressing and
Orange from
barber shop to close
Yellow
12 May: Certain trades allowed to trade
February March April May June →
½ month rental rebate
Passed on 15% One month rental for eligible tenants and Combination of remaining rebate Total amount of
property tax rebate3 to rebate for eligible ½ month rental rebate from property tax rebate and rebates:
all tenants tenants through property tax offsetting from security deposit 2.5 months
rebate
1. The Government announced on 21 April 2020 the Circuit Breaker will be extended for another month to 1 June 2020
2. The Government announced on 2 May 2020 that on 12 May, selected activities and services will be allowed to resume operations. These activities would include home-based businesses, food manufacturing and
selected food retail outlets, laundry services, barbers and pet supplies.
3. In the FY2020 Budget and the FY2020 Supplementary Budget announced on 18 February and 26 March 2020 respectively, the Government announced a property tax rebate of up to 100% for non-residential
properties, for the tax payable in 2020. For most properties, the 100% property tax rebate works out to more than one month of rent. 36Outlook
◆   On 26 March 2020, the Ministry of Trade and Industry (“MTI”) downgraded its growth forecast for Singapore
    GDP to “-4.0 to -1.0 per cent” from “-0.5 to 1.5 per cent”. Singapore Department of Statistics (DOS)
    reported retail sales index (excluding motor vehicles) for February 2020 has dropped 10.2%, compared with
    February 2019
◆   The Government has announced various safe distancing measures, the “Circuit Breaker” measures and the
    stay home advisory in March 2020 and April 2020 to protect the public. The COVID-19 outbreak has
    significant detrimental impact to retail and F&B businesses. Under the “Circuit Breaker” period from 7 April
    2020 to 4 May 2020 and which has now been extended till 1 June 2020, all “non-essential” trades are to be
    closed and certain F&B trades are permitted to accept only takeaway orders

                                                                                                                   38
◆ The “Covid-19 (Temporary Measures) (Temporary Relief for Inability to Perform Contracts)
Regulations 2020” (the “Regulations”) provides tenants with relief from their contractual obligations
for six months from the effective date of the Regulations, and this period may be extended to a
year. The rental payments of affected tenants during this period could potentially be deferred
◆ The combination of the detriment from COVID-19, the regulatory measures aforementioned and
the provision for rental rebates under the TSP will have significant impact on FCT’s revenue,
income available for distribution and cashflow for the remaining period of Financial Year 2020
◆ The Manager will continue to proactively manage the operating and financial performance of the
property portfolio in the best interests of FCT and its Unitholders, taking into consideration the
impact from the developing COVID-19 situation
39Q&A
Appendix
◆   2Q19: Second Quarter 2019 ended 31 March 2019                  ◆   NAV: Net asset value
◆   2Q20: Second Quarter 2020 ended 31 March 2020                  ◆   NLA: Net Lettable Area
◆   1H19: Six months ended 31 March 2019                           ◆   NPI: Net Property Income
◆   1H20: Six months ended 31 March 2020                           ◆   NTA: Net Tangible Value
◆   AEI: Asset Enhancement Initiative                              ◆   PGIM ARF: PGIM Real Estate AsiaRetail Fund Limited, an
◆   COVID-19: Coronavirus disease                                      associate of FCT
◆   DPU: Distribution per Unit                                     ◆   q-o-q: quarter-on-quarter, refers to the comparison with the
                                                                       previous quarter
◆   F&B: Food and Beverage
                                                                   ◆   REIT: Real Estate Investment Trust
◆   FCT: Frasers Centrepoint Trust
                                                                   ◆   RSI: Retail Sales Index, published by the Department of Statistics
◆   FCAM: Frasers Centrepoint Asset Management Ltd., the
    manager of FCT                                                 ◆   S&P: Standard and Poor’s (credit rating agency)
◆   FPL: Frasers Property Limited, the sponsor of FCT              ◆   sq ft: square feet
◆   GRI: Gross Rental Income                                       ◆   SST: Sapphire Star Trust, which holds Waterway Point; it is a joint
                                                                       venture of FCT
◆   Moody’s: Moody’s Investors Service (credit rating agency)
                                                                   ◆   UPL: refers to the Underground Pedestrian Link between the
◆   MTN: Medium Term Notes under FCT's $1 billion multi-currency
                                                                       basement of Causeway Point and Wood Square
    MTN program
                                                                   ◆   WALE: Weighted Average Lease Expiry
                                                                   ◆   y-o-y: year-on-year, refers to the comparison with the same period
                                                                       in the previous year
2Q20 y-o-y and q-o-q comparison
y-o-y comparison q-o-q comparison
Change Change
$’000 (unless otherwise indicated) 2Q20 2Q19 Inc / (Dec) 1Q20 Inc / (Dec)
Gross Revenue 50,168 49,733 0.9% 49,752 0.8%
Property Expenses (14,204) (13,289) 6.9% (13,433) 5.7%
NPI 35,964 36,444 (1.3%) 36,319 (1.0%)
Income available for distribution before dividends 25,199 27,673 (8.9%) 26,348 (4.4%)
Dividends from associates and joint ventures 10,803 1,135 851.8% 8,673 24.6%
Income available for distribution 36,002 28,808 25.0% 35,021 2.8%
Distribution to Unitholders 18,000 29,158 (38.3%) 34,202 (47.4%)
DPU 1.610¢ 3.137¢ (48.7%) 3.06¢ (47.4%)
43FCT - Portfolio FY 2020 FY 2021 FY 2022 FY 2023 FY 2024 FY 2025 FY 2028 Grand Total
No. of leases 153 288 268 151 19 2 1 882
NLA (sq ft) expiring 165,573 370,504 496,138 263,817 77,385 2,699 21,248 1,397,364
Expiries as % of total leased area 11.9% 26.5% 35.5% 18.9% 5.5% 0.2% 1.5% 100.0%
Expiries as % of total GRI 14.0% 27.8% 31.7% 20.3% 5.8% 0.2% 0.2% 100.0%
Causeway Point FY 2020 FY 2021 FY 2022 FY 2023 FY 2024 FY 2025 FY 2028 Total
No. of leases 45 63 61 45 2 1 0 217
NLA (sq ft) expiring 44,916 79,609 164,312 116,201 5,135 1,364 0 411,537
Expiries as % of total leased area 10.9% 19.3% 39.9% 28.2% 1.2% 0.3% 0.0% 100.0%
Expiries as % of total GRI 17.6% 23.4% 31.1% 27.1% 0.6% 0.3% 0.0% 100.0%
Northpoint City North Wing + Y10 FY 2020 FY 2021 FY 2022 FY 2023 FY 2024 FY 2025 FY 2028 Grand Total
No. of leases 56 52 34 30 4 0 1 177
NLA (sq ft) expiring 42,375 55,938 55,956 24,190 23,056 0 21,248 222,763
Expiries as % of total leased area 19.0% 25.1% 25.1% 10.9% 10.4% 0.0% 9.5% 100.0%
Expiries as % of total GRI 23.9% 25.8% 23.5% 16.6% 9.0% 0.0% 1.2% 100.0%
Waterway Point FY 2020 FY 2021 FY 2022 FY 2023 FY 2024 FY 2025 FY 2028 Total
No. of leases 14 49 93 33 11 0 0 200
NLA (sq ft) expiring 19,839 103,790 150,496 43,650 39,797 0 0 357,572
Expiries as % of total leased area 5.5% 29.0% 42.1% 12.2% 11.1% 0.0% 0.0% 100.0%
Expiries as % of total GRI 4.4% 28.9% 39.6% 15.4% 11.7% 0.0% 0.0% 100.0%
Changi City Point FY 2020 FY 2021 FY 2022 FY 2023 FY 2024 FY 2025 FY 2028 Total
No. of leases 11 58 35 22 1 0 0 127
NLA (sq ft) expiring 22,314 69,669 61,678 33,768 850 0 0 188,279
Expiries as % of total leased area 11.9% 37.0% 32.8% 17.9% 0.5% 0.0% 0.0% 100.0%
Expiries as % of total GRI 10.5% 38.3% 33.8% 17.2% 0.3% 0.0% 0.0% 100.0%
Bedok Point FY 2020 FY 2021 FY 2022 FY 2023 FY 2024 FY 2025 FY 2028 Total
No. of leases 6 16 15 2 0 0 0 39
NLA (sq ft) expiring 19,189 25,084 31,555 2,196 0 0 0 78,024
Expiries as % of total leased area 24.6% 32.1% 40.4% 2.8% 0.0% 0.0% 0.0% 100.0%
Expiries as % of total GRI 18.9% 38.4% 38.9% 3.8% 0.0% 0.0% 0.0% 100.0%
YewTee Point FY 2020 FY 2021 FY 2022 FY 2023 FY 2024 FY 2025 FY 2028 Total
No. of leases 6 35 16 11 1 0 0 69
NLA (sq ft) expiring $5,877 $21,828 $12,441 $23,920 $8,547 $0 $0 $72,613
Expiries as % of total leased area 8.1% 30.1% 17.1% 32.9% 11.8% 0.0% 0.0% 100.0%
Expiries as % of total GRI 8.0% 35.5% 19.6% 26.5% 10.4% 0.0% 0.0% 100.0%
Anchorpoint FY 2020 FY 2021 FY 2022 FY 2023 FY 2024 FY 2025 FY 2028 Total
No. of leases 15 15 14 8 0 1 0 53
NLA (sq ft) expiring 11,063 14,586 19,700 19,892 0 1,335 0 66,576
Expiries as % of total leased area 16.6% 21.9% 29.6% 29.9% 0.0% 2.0% 0.0% 100.0%
Expiries as % of total GRI 20.1% 22.7% 26.9% 28.8% 0.0% 1.4% 0.0% 100.0%
The above information can be downloaded in Microsoft Excel format from FCT’s website: https://fct.frasersproperty.com/financial_information.html
44Trade Classifications
As % of total NLA As % of total GRI
(In descending order of % of GRI)
F&B 30.9% 37.7%
Fashion 12.8% 13.5%
Beauty & Health 8.3% 11.8%
Services 4.8% 8.9%
Household 9.9% 7.5%
Supermarket & Hypermarket 7.3% 5.1%
Leisure/Entertainment 6.6% 3.0%
Sports Apparel & Equipment 3.2% 2.8%
Books, Music, Arts & Craft, Hobbies 3.7% 2.7%
Jewellery & Watches 0.8% 2.5%
Department Store 4.1% 2.5%
Education 3.8% 1.9%
Vacant 3.9% 0.0%
Grand Total 100.0% 100.0%
The above information can be downloaded in Microsoft Excel format from FCT’s website: https://fct.frasersproperty.com/financial_information.html
45Rank by
Tenants As % of total NLA As % of total GRI
GRI
1 NTUC Fairprice Co-operative1 4.7% 3.2%
2 Cold Storage Singapore (1983) Pte Ltd2 3.6% 3.0%
3 Copitiam Pte Ltd3 2.9% 2.6%
4 Metro (Private) Limited4 4.3% 2.6%
5 Courts (Singapore) Limited 2.5% 2.1%
6 Koufu Pte Ltd 2.3% 2.0%
7 Cotton On Singapore5 1.4% 1.7%
8 Hanbaobao Pte Limited6 0.9% 1.4%
9 Yum! Brands7 1.1% 1.4%
10 Uniqlo (Singapore) 2.4% 1.4%
Total for Top 10 26.2% 21.5%
1. NTUC: Include NTUC FairPrice, NTUC Healthcare (Unity) and NTUC Club
2. Includes leases for Cold Storage supermarkets, Guardian Pharmacy & 7-Eleven
3. Operator of Kopitiam food courts, includes Kopitiam, Bagus
4. Includes leases for Metro Department Store & Clinique Service Centre
5. Includes leases for Cotton On, TYPO, Rubi Shoes, Cotton On Body, Cotton On Kids
6. Operates McDonald’s outlets
7. Operates KFC and Pizza Hut outlets
The above information can be downloaded in Microsoft Excel format from FCT’s website: https://fct.frasersproperty.com/financial_information.html
46Portfolio Average Rental Reversions1
15.0%
14.0%
12.8%
12.1%
9.9%
8.6%
7.7%
7.2%
6.5% 6.3%
5.1% 4.8% 5.2%
3.2%
FY2007 FY2008 FY2009 FY2010 FY2011 FY2012 FY2013 FY2014 FY2015 FY2016 FY2017 FY2018 FY2019 1H20
1. Based on the variance between the average rental rates between the new lease and the preceding lease, based on same retail space.
Reconfigured or amalgamated retail space is excluded from calculation of rental reversion. Average lease tenure is 3 years.
47DPU (S cents)
11.9 12.015 12.07
11.608 11.764
11.187
10.93
10.01
8.2 8.32
7.29 7.51
6.55
6.03
FY2006 FY2007 FY2008 FY2009 FY2010 FY2011 FY2012 FY2013 FY2014 FY2015 FY2016 FY2017 FY2018 FY2019
(IPO)*
*Annualised DPU for the period 5 Jul 2006 (IPO) to 30 September 2006. 48NLA Valuation @ NLA Valuation @
Land Tenure Years Land Tenure Years
FCT Property 30/9/2019 Expiry PGIM ARF Retail Property 30/9/2019 Expiry
Sqm Sq ft Type remaining Sqm Sq ft Type remaining
(S$'000) (S$'000)
Causeway Point 39,027 420,082 1,298,000 Leasehold 2094 74 Tiong Bahru Plaza 19,947 214,710 626,000 Leasehold 2090 70
Northpoint City (North Wing) 20,380 219,365 771,500 Leasehold 2089 69 Century Square 19,621 211,200 550,000 Leasehold 2091 71
Yishun 10 retail podium 961 10,344 38,000 Leasehold 2089 69 Hougang Mall 15,455 166,358 410,000 Leasehold 2092 72
Waterway Point (40%) 34,485 371,200 *520,000 Leasehold 2110 90 White Sands Mall 13,965 150,319 407,000 Leasehold 2092 72
Changi City Point 19,048 205,028 342,000 Leasehold 2069 49 Tampines 1 24,912 268,153 719,800 Leasehold 2089 69
Bedok Point 7,684 82,713 94,000 Leasehold 2077 57 PGIM ARF Retail Portfolio 93,900 1,010,740 2,712,800
YewTee Point 6,844 73,669 189,000 Leasehold 2105 85 NLA Valuation @
Land Tenure Years
PGIM ARF Office Property 30/9/2019 Expiry
Sqm Sq ft Type remaining
Anchorpoint 6,595 70,988 113,500 Freehold NA NA (S$'000)
FCT Portfolio 135,023 1,453,389 2,846,520 Central Plaza 16,034 172,590 196,000 Leasehold 2091 71
* Valuation based on 100% as at 1 April 2019 was S$1,300,000,000. FCT owns 40% stake in SST which holds the The property information relating to PGIM ARF portfolio is disclosed in Frasers Property Limited Annual Report
interests in Waterway Point, and proportionate book value is 40%*$1,300,000,000 = $520,000,000 2019, page 350
49You can also read