Leading the Transformation - Dr. Herbert Diess, Chief Executive Officer Volkswagen AG - Volkswagen ...
←
→
Page content transcription
If your browser does not render page correctly, please read the page content below

Leading the Transformation.

Dr. Herbert Diess, Chief Executive Officer
Volkswagen AG
Unicredit Kepler Cheuvreux German Corporate Conference, 18 January 2020
Disclaimer

The following presentations contain forward-looking statements and information on the business development of the Volkswagen Group. These statements
may be spoken or written and can be recognized by terms such as “expects”, “anticipates”, “intends”, “plans”, “believes”, “seeks”, “estimates”, “will” or words
with similar meaning. These statements are based on assumptions, which we have made on the basis of the information available to us and which we consider
to be realistic at the time of going to press. These assumptions relate in particular to the development of the economies of individual countries and markets,
the regulatory framework and the development of the automotive industry. Therefore the estimates given involve a degree of risk, and the actual
developments may differ from those forecast. The Volkswagen Group currently faces additional risks and uncertainty related to pending claims and
investigations in a number of jurisdictions in connection with findings of irregularities relating to exhaust emissions from diesel engines in certain Volkswagen
Group vehicles. The degree to which the Volkswagen Group may be negatively affected by these ongoing claims and investigations remains uncertain.
The recent outbreak of COVID-19 (commonly referred to as coronavirus) has negatively impacted and may continue to impact economic and social conditions
in some of Volkswagen's primary markets, including China and Europe, as public, private, and government entities implement containment and quarantine
measures. The continued spread of COVID-19 may cause shortages of necessary materials and parts from suppliers directly or indirectly affected by the
outbreak and may cause operational disruptions and interruptions at Volkswagen's production facilities, leading to significant production downtimes
A negative development relating to ongoing claims or investigations, the continuation of COVID-19, an unexpected fall in demand or economic stagnation in
our key sales markets, such as in Western Europe (and especially Germany) or in the USA, Brazil or China, and trade disputes among major trading partners will
have a corresponding impact on the development of our business. The same applies in the event of a significant shift in current exchange rates in particular
relative to the US dollar, sterling, yen, Brazilian real, Chinese renminbi and Czech koruna.
If any of these or other risks occur, or if the assumptions underlying any of these statements prove incorrect, the actual results may significantly differ from
those expressed or implied by such statements.
We do not update forward-looking statements retrospectively. Such statements are valid on the date of publication and can be superseded.
This information does not constitute an offer to exchange or sell or an offer to exchange or buy any securities.

 2

Leading the Transformation.

Deliveries to Customers

Development World Car Market vs. Volkswagen Group Car Deliveries to Customers by Regions 1)
(Growth y-o-y, January to December 2020 vs. 2019)

 Car Market VW Group Car Market VW Group Car Market VW Group

 -15.9% -15.9% -13.9%
 -17.3%
 -21.5%
 -24.5%
 North America (incl. LCV) Western Europe Central & Eastern Europe

 Car Market VW Group Car Market VW Group Car Market VW Group

 -9.6% -8.9%
 -15.2% -14.7%
 -20.2%
 -28.1%
 South America (incl. LCV) World 2) Asia Pacific

1) Volkswagen Group Passenger Cars excl. Volkswagen Commercial Vehicles 2) incl. LCV in North America & South America

 4
Volkswagen Group – Deliveries to Customers by Brands 1)
(January to December 2020 vs. 2019)

[thsd. units]

 -15.2% January - December 2019 January - December 2020

 10,975 Volume Premium Sport & Luxury Truck & Bus
11,000
 -17.0 % -8.3 % -2.9 % -21.5 %
10,000
 9,305
 9,000

 8,000
 -15.1%
 7,000
 6,279
 6,000
 5,328
 5,000

 4,000
 -8.3%
 3,000
 -19.1%
 2,000 -25.6% -24.4% 1,846 1,693
 -3.1% -17.3% -27.5%
 1,243 -9.4% +1.8%
 1,005
 1,000 574 492
 427 372 281 272
 8 7 11 11 143 118 99 72
 0

 Commercial
 Vehicles
1) Volkswagen Group excl. Ducati

 5

Leading the Transformation.

Key Financials

Revised Dividend Proposal: Prudent Approach in light of circumstances

 6.50 6.56
 € 4.80 4.86 4.80 4.86
 20.4% 20.4% 24.5% 24.5% 18.1% 18.1%
Pay-out ratio

 Ords Prefs Ords Prefs Ords Prefs
 Dividend 2020 Dividend 2020
 Dividend 2019
 proposal as of February revised proposal as of July

 Carry over of remaining net retained profit of 855 million Euro to 2021
 Volkswagen AG still fully committed to the strategic target of a 30% payout ratio!

 7

Volkswagen Group – Analysis by Business Line 1)
 (January to September 2020)

 Vehicle sales Sales revenue Operating profit Operating margin
 thousand vehicles / € million / percentage 2020 2019 2020 2019 2020 2019 2020 2019
 Volkswagen Passenger Cars 1,896 2,754 47,184 65,447 –969 3,152 -2.1% 4.8%
 Audi 682 900 33,264 41,332 221 3,239 0.7% 7.8%
 ŠKODA 596 805 12,038 14,811 469 1,175 3.9% 7.9%
 SEAT 319 517 6,043 8,828 –290 248 -4.8% 2.8%
 Bentley 8 7 1,397 1,306 –52 65 -3.7% 5.0%
 Porsche Automotive 2) 181 205 17,482 18,666 1,884 3,200 10.8% 17.1%
 Volkswagen Commercial Vehicles 250 344 6,674 8,756 –362 497 -5.4% 5.7%
 Scania 3) 49 76 8,094 10,427 419 1,209 5.2% 11.6%
 MAN Commercial Vehicles 80 104 7,461 9,175 –461 297 -6.2% 3.2%
 Power Engineering – – 2,749 2,873 66 91 2.4% 3.2%
 VW China 4) 2,462 2,815 – – – – – –
 Other 5) –211 –543 –15.494 –22.949 –176 –411 – –
 Volkswagen Financial Services – – 28,595 27,946 1,632 2,035 – –
 Volkswagen Group before Special Items – – – – 2,380 14,795 1.5% 7.9%
 Special Items – – – – –687 –1.257
 Volkswagen Group 6,311 7,983 155,486 186,617 1,693 13,539 1.1% 7.3%
 Automotive Division 6) 6,311 7,983 125,301 157,031 –95 11,313 – –
 of which: Passenger Cars 6,182 7,803 107,132 134,666 185 10,103 – –
 of which: Commercial Vehicles 129 180 15,419 19,491 –180 1,307 – –
 of which: Power Engineering – – 2,749 2,873 –101 –98 – –
 Financial Services Division – – 30,185 29,587 1,789 2,226 – –

1) All
 figures shown are rounded, minor discrepancies may arise from addition of these amounts. 2) Porsche (Automotive and Financial Services): sales revenue € 19,406 (20,490) million, operating profit € 2,011 (3,346 ) million. 3) Scania (Automotive and
Financial Services): sales revenue € 8,414 (10,762) million, operating profit € 501 (1,314) million. 4) The sales revenue and operating profits of the joint venture companies in China are not included in the figures for the Group. These Chinese companies
are accounted for using the equity method and recorded a proportionate operating profit of € 2,632 (3,187) million. 5) In operating profit mainly intragroup items recognized in profit or loss, in particular from the elimination of intercompany profits; the
figure includes depreciation and amortization of identifiable assets as part of purchase price allocation for Scania, Porsche Holding Salzburg, MAN and Porsche. 6) Including allocation of consolidation adjustments between the Automotive and Financial
Services divisions. 8
Volkswagen Group – Analysis of Operating Profit 1)
(January to September 2020)

[€ billion]

16
14 13.5 1.3

12
10 -9.7
 8
 14.8
 6
 4 -2.3 -1.5
 2.1 0.0
 -0.6 -0.4
 2 -0.7
 2.4 1.7
 0
 Jan-Sept Special Items Jan-Sept Volume/ Exchange Product Costs Fixed Costs Commercial Power Financial Jan-Sept Special Items Jan-Sept
 2019 2019 Mix/ Prices Rates / Vehicles** Engineering** Services 2020 excl. 2020 incl.
 incl. Special excl. Special Derivatives Division Special Items Special Items
 Items Items

 Passenger Cars*/**

1) All figures shown are rounded, minor discrepancies may arise from addition of these amounts. *) without FS ** ) including PPA 9

Automotive Division – Net Cash Flow 1)
(January to September 2020)

[€ billion]

 6

 4 1.1

 2.0 4.5
 2

 1.4
 0

 2019 8.6 1.2 0.6 10.4
 Net Cash flow including Diesel outflow Aquisition and disposal Net Cash flow
 Diesel payments and of equity investments underlying business
 M&A

1) Including allocation of consolidation adjustments between Automotive and Financial Services divisions. 10
Automotive Division – Net Cash Flow Development 1)
(January to September 2020)

[€ billion]

 14
 12
 10 -6.4
 8
 6 13.2

 4 -4.5

 2 0.2 -1.1
 2.5 1.4
 0
 -2
 -4

 2019 20.9 -8.2 -3.7 0.2 9.2 -0.6 8.6
 Cash flow from Capex Capitalized Other Net cash flow before Acquisition Net Cash flow
 operating activities development equity and disposal
 costs investments of equity
 investments

1) All figures shown are rounded, minor discrepancies may arise from addition of these amounts. Including allocation of consolidation adjustments between Automotive and Financial Services divisions. 11
Automotive Division – Analysis of Net Liquidity 1)
(January to September 2020)

[€ billion]

 27.5
 25.0 -0.4
 3.0
 22.5 -0.5
 2.5
 20.0 -2.0
 -1.1 2.0
 17.5
 15.0
 12.5 24.8
 10.0 21.3 Net Cash flow (€ 1.4 bn)
 7.5
 Clean Net Cash flow before
 5.0 Diesel and M&A (€ 4.5 bn)
 2.5
 0.0
 19.4 -1.2 -0.6 1.4 9.0 -6.0 0.0 -2.2 19.8

 12/2019 Diesel Outflow M&A China Operating Leasing Payment / Hybrid Bond Other 09/2020
 Dividend Business Change in Liabilities

1) All figures shown are rounded, minor discrepancies may arise from addition of these amounts. 12
Leading the Transformation.

Outlook & Operative Excellence
Volkswagen Group – Outlook for 2020

 +1.3%
 Deliveries to customers 10.8 11.0 Significantly below prior year
 ('000 vehicles) 2020
 2018 2019

 +7.1% Significantly below prior year
 Sales revenue 235.8 252.6 with exception of Financial Services:
 (€ billion) on similar level as prior year

 2018 2019 2020

 Operating result (before and including Special

 1) 1) Items) severely below prior year
 Operating return on sales 7.3 7.6
 (%) However, positive
 2020
 2018 2019

1) Before Special Items. 14
Strategic Group KPI’s – Back to normalization in 2022/23 with upside potential Key financial targets 2017 2018 2019 2020 2022 2025 Actual Actual Actual Outlook Interim Strategic Strategic Targets Targets Operating return on sales 7.4% 7.3% 7.6% positive 6.0-7.0% 7-8% Before Special Items Return on investment 14.4% 13.1% 11.2% positive 10-12% >14% Automotive Division before Special Items Capex ratio 6.4% 6.6% 6.6% at previous 6.0-6.5% 6% Automotive Division year's level R&D cost ratio 6.7% 6.8% 6.7% will exceed 6.5-7.0% 6% Automotive Divison 2019 a) Net Cashflow1) € 10.3 bn € 5.6 bn €13.5 bn positive > € 10 bn > € 10 bn Cash Automotive at previous ~10% of Group Division b) Net Liquidity € 22.4bn € 19.4 bn € 21.3 bn > € 20 bn year's level turnover 1) ExcludingDiesel payments and M&A. Please note, Navistar not yet included. The transaction is targeted to close in mid 2021, and is subject to Navistar shareholder approval, customary closing conditions as well as regulatory approvals. 15
Proportion of “Future Technologies” rising within total investments

 ~ € 73 bn
 (~50%)

 ~ € 60 bn
 (~40%) ~ 27
 Digital technology
 (18%)
 ~ 14
 ~ € 44 bn (10%)
 (~30%)
 ~8 ~ 12 ~ 11 Hybrid
 (5%) (9%) (7%) powertrains
 ~4
 (3%)

 ~ 32 ~ 33 ~ 35
 Electrification
 (21%) (23%) (24%)

 PR 67 PR 68 PR 69

 16
Passenger Car Total Markets by Region – External Outlook
The recovery path after the COVID-19 pandemic varies across markets depending on their economic situation

 North America (incl. LCV) Western Europe Central and Eastern Europe
 22 Vol. in mn 20 Vol. in mn 5 Vol. in mn
 20.2
 19.7 14.4 3.7
 20 15 13.0 13.3 4
 18.8 12.3 3.3
 10.9 3.1 3.3
 17.8 2.8
 18 10 3
 16.6
 16 5 2

 14 0 1
 2019 2020 2021 2022 2025 2019 2020 2021 2022 2025 2019 2020 2021 2022 2025
 Growth Growth Growth
 YoY
 -1.5% -18.1% +7.1% +5.8% +4.7% YoY
 +0.6% -24.1% +12.2% +6.1% +1.8% YoY
 +2.3% -16.1% +12.7% +5.6% +12.9%

 South America 1) (incl. LCV) World China
 5 Vol. in mn Vol. in mn 32 Vol. in mn
 90
 3.9 82.3
 4 77.2 28
 3.5 80 75.2 25.4
 3.2
 3.0 71.1
 3 24
 2.5 70 64.9 22.0
 21.0 20.9
 2 60 20
 19.3

 50
 1 16
 2019 2020 2021 2022 2025
 2019 2020 2021 2022 2025 2019 2020 2021 2022 2025
 Growth Growth Growth
 -5.9% -28.9% +20.3% +9.1% +20.5% YoY
 -2.9% -15.9% +9.6% +5.7% +9.5% YoY
 -3.3% -8.2% +8.5% +5.4% +15.1%
 YoY

1) South America includes Brazil, Argentina, Chile and Venezuela.

Source: IHS Markit Automotive, MarketInsight New Registration data, 11/2020
 17
Our worldwide SUV mix is expected to increase strongly

 Volkswagen Group - SUV share
 (in % of regional Group Deliveries to Customers)
 VW Group

 Europa China NAR ≈ 50%

 VW Group
 VW Group 70%
 >35%
 >30%

 51%

 45%

 1) 1) 1) 1) 1)
 2019 2020 2021 2022 2023 2024 2025

1) Target 18
Leading the Transformation.

Strategy – Shaping e-mobility
“Go to zero” Transformation of portfolio underway

 Paris Implications and Transformations Path

 >10 years
 SO Fleet renewal
 Conventional platforms
 P EOP
 SO „Zero Emission“
 Conventional projects
 P in the existing fleet

 Broad product portfolio Transformation CO2 neutral cars

 CO2-Emissions

 New business model

 BEV

 2020 2050

 20
Significant increase in BEV deliveries will support our CO2 compliance
Volkswagen Group – BEV volume by regions 2019 - 2030 | (BEV share of total Group deliveries in %)
 BEV

 >30% 2)
 el-Born ID. CROZZ ID. BUZZ

 ≥ 20%
 Enyaq iV Q4 e-tron next generation next generation [Stretch target
 Audi B-SUV Macan up to 3 mn units]

 ≈ 6-8%
 ≈ 1% ≈ 3%

 2019 2020 1) 2021 1)
 2022 1) 2023 1)
 2024 1)
 2025 1) 2030 1)

1) Target 2) Green Deal need to be reflected. Europe China NAR RoW
 21
Fully on track towards electrification by entering the next phase of global ramp-up

 3

 2 Volume ramp-up and
 internationalization
 1 Start of Transformation
 electro mobility

 PREMIUM
 NAR CHN
 EU
 VOLUME

 Capital Marktes Day 2019

 • Development and tooling up of electrified • Scaling up MEB und PPE – Base for volume • Coverage of core markets and segments
 platforms MEB and PPE ramp up • Fully prepared for Green Deal
 • Closed cycled start of productions • Internationalization of BEVs starting with • Connected car fleet
 compact SUVs

 22
Complete from entry to B/C-Segment by ~2025

 Iconic ID.3
 as core Worldwide Scale into Worldwide
 of new ID.4 for max EU user iconic Worldwide long range Worldwide Entry ID.s
 Volkswagen CO2 impact chooser choice BUZZ volume concepts CO2 impact for everyone

 ID.3 ID. 4 B Crossover ID. BUZZ B/C room B/C range B SUV Entry BEVs 1&2
 concept concept

 2020 2021 2022 2023 2023 2025
 September Q4/2020

 The aim of the ID. Family is to provide the net-climate neutral mobility choice to all customers.
 The order of entry is based on maximum brand impact, maximum CO2 impact and maximum financial results.

 23
Starting in Zwickau – the MEB factories scale up world wide

 North America Europe China

 Chattanooga: Zwickau: Dresden: Anting:
 SOP 2022 SOP 2019 SOP 2020 SOP 2020

 Emden: Hannover: Foshan:
 SOP 2022 SOP 2022 SOP 2020

SOP = Start of Production
 24
In our MEB portfolio we enlarge our synergy approach “also group-wide…”

 Synergy in top hats

 Cupra el Born Skoda Enyaq Audi Q4 e-tron

Platform
synergy VW ID.3 VW ID.4

 MEB

 25
Reduced complexity offering of hardware to enable software lifetime business

 ID.3 10 click easy offer Fast Track Models Customer benefits
 • Easier to configure/ less mistakes
 Range Pre-configured models (derived
 Pure Pro Pro S • Package with price advantage
 (#3-4) from Customer Demand Spaces):
 • Stronger residual values
 Engine Standard Perform. • Faster delivery times
 (#2) • ID. Comfort • ID. Family
 • ID. Tech • ID. Style
 Packages P1 P2 P3 P4 P5
 • ID. Fun • ID. Tour
 (#5x2) P1+ P2+ P3+ P4+ P5+

 Seats +
 (#4) ID. Fun System benefits
 Exterior Pro Bi-Color • 99% reduced complexity to
 (#2) develop, build, maintain, train, sell
 • Scale effects
 Color
 (#6+1) • Restructuring supply chain
 • Enabler digital lifecycle
 Wheels management and lifetime business
 (#7)

 26
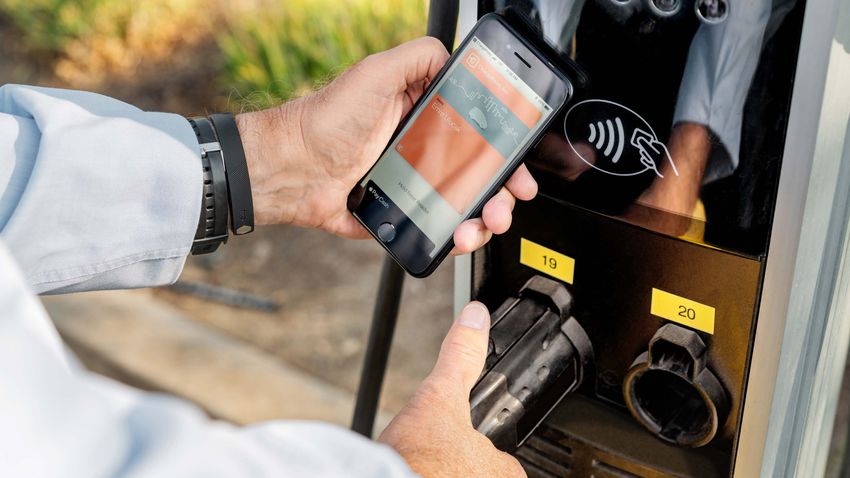
Holistic Battery-Strategy: Building competencies and further cooperations

 Supplier • The Group maintains strategic relations with several producers to secure its battery supplies in all world regions:
 − Europe: LG Chem, Samsung, SKI and CATL
 − China: CATL
 − US: SKI
 • In Europe and NAR, Volkswagen expects annual demand of over 150 gigawatt hours from 2025, with demand in Asia at a
 similar level

 Joint ventures • Joint venture with Northvolt established in 2019
 • Initial investment of some €450 mn for joint battery factory
 • Large-scale production of lithium-ion batteries in Salzgitter, Germany
 • Battery cell production is scheduled to commence in early 2024
 • Initial production capacity of 16 gigawatt hours
 • Northvolt will also deliver cells for Scania´s battery assembly plant in Södertälje, starting production in 2023

 • Volkswagen will acquire a 26% stake of Gotion High-Tech for around €1 bn
 • Secure future demand for batteries for Chinese e-models

 • Non-exclusive relationship with Volkswagen dates back to 2012
 • Volkswagen is committed of more than 300 million dollars in funding, and committed of additional dollars to help fund the
 manufacturing joint venture
 • Goal is industrial-level production of solid-state batteries, start of production is targeted in mid 2020’s
 • Volkswagen has two board seats, Jens Wiese and Dr. Frank Blome

 27
Principle of Closed Loop Battery Materials

 Primary raw Material
Secondary Material (chemistry part)
 9 10 Cathode-material
 (reusable for new cell
 production)

Hydrometal. Recycling 8 1 Cell-
(chemistry involved) production
 (cell modules)

Mechanical Recycling 7 We are striving for high recovery rates 2 Systemproduction
 • (battery system)
 of Raw Material
 (Nickel, Cobalt, Mangan, Lithium)
 • For this reason, a pilot plant for battery
Remanufac-turing/2nd Life 6 recycling is currently being set up at the
(in mobile power-banks) 3 1st Life
 Salzgitter factory, Germany.

classification of battery health 5 4 Return (of battery)
status
(to extend lifecycle in car use)

 28
With a strong product portfolio, new distribution concepts and a fast start to e-mobility, we
are well prepared to bear the challenges of this crisis!

 Fleet / MEB Agency Product Launches One.Shop

 29
ADAC confirms: ID.3 with best total cost of ownership (expected similar for ID.4)
https://www.adac.de/rund-ums-fahrzeug/autokatalog/marken-modelle/vw/vw-id-3/

The VW ID.3 in cost comparison

 VW ID.3 VW Golf VW Golf Tesla Model 3 Nissan Leaf Hyundai IONIQ
 Model 1stPro Performance 1.5 eTSI 2.0 TDI Standard Range Plus, (62 kWh) Elektro Style,
 (58 kWh), 150 kW Style DSG, 110 kW Style DSG, 110 kW 236 kW e+ Acenta, 160 kw 100 kW

 Base price (€) 38.987* 31.905 34.425 43.880* 37.237* 39.284*

 Depreciation1 295 353/296* 390/329** 337 320 337

 Fixed costs1 78 99 123 148 105 101

 Operation costs1 91 119 94 85 104 83

 Service and Tire costs1 56 61 66 86 63*** 56

 Total costs1 520 632/574** 673/611** 656 592 576

 Total costs1 (Cent/km) 41,6 50,5/46** 53,8/48,9** 52,5 47,4 46,1
Prices / costs in the table including 16% VAT - rounded (small rounding differences possible) 1) (€/month)

*Current incentive on electric vehicles is taken into account and deducted from the purchase price when calculating. ** Calculation with list price / with 10% discount
*** The workshop costs are based on empirical values, as we do not (yet) have the necessary manufacturer information
 30
Volkswagen and Ford: Alliance delivers significant strategic and economic benefits Collaboration Projects VEHICLE VW TO SUPPLY DEVELOPMENT & MEB PLATFORM PROJECTS IN PRODUCTION AUTONOMOUS PICKUP, CITY VAN, TO FORD ONE-TON VAN (MODULAR ELECTRIC DRIVING WITH TOOLKIT) Production of up to 8m units of the 600k MEB platforms and Collaboration with Argo AI aims three commercial vehicles starting associated components delivered for industry leading Self-Driving around 2022 by VW System platform Through the cooperation, existing facilities will be much better $10-20bn deal value utilized; e.g. City Van to be build in Poznan (VW plant) 31
Leading the Transformation.

Strategy – Software-enabled car company
Industrial Cloud: Transforms fragmented IT landscape to integrated platform architecture

 Covers 124 Group Plants
 Current state: fragmented IT/OT landscape Target state: integrated platform architecture

 Sys D Industrial Cloud Marketplace
 Sys B
 Sys A 11
 11 & App Store
 Sys C Sys E
 11
 11
 11

 IC
 Platform & Data Management

 IL CO PRS BS PAS AS OL

 Provider-specific platforms
 IL CO PRS BS PAS AS OL

 Development Development
 Complexity Operational Cost Complexity Operational Cost
 Expenses Expenses

 System Production System Production
 Consolidation Consolidation
 Flexibility Stability Flexibility Stability
IL: Inbound Logistics CO: Components PRS: Press Shop BS: Body Shop PAS: Paint Shop AS: Assembly
OL: Outbound Logistics

 33
Our vw.os and E/E architecture will be evolutionary
Driving forward Strategy: New collaborative approach

 35
Leading the Transformation.

Strong brands & global footprint
Volkswagen Financial Services 1): global, well diversified and successful

 Strong global presence Continuous portfolio expansion

 in ‘000 contracts
 10,297 10,392

 7,641 7,717
 7,218
 6,322 Total
 4,149
 4,616 4,656 portfolio
 2,518 2,760 3,921
 21,647
 5,833 6,155 5,672 5,935 6,585 6,599

 2015 2016 2017 * 2018 2019 ** 2020 Q3
 Financing Leasing Insurance / Services
 *) Reclassification Finance / Lease contracts **) contracts from international JVs included

 Rising penetration rates (without China) Diversified funding structure

 Equity, liabilities to Asset backed securitization
 52.7% affiliated companies,
 49.4% 49.1% other
 48.7%
 47.8% 18%
 46.9% 31%

 Bonds,
 14% 37% Commercial Paper,
 Customer deposits liabilities to financial
 institutions
 30.09.2020: € 223.9 bn

1) Excl. activities of Scania and Porsche Holding Salzburg; incl. Financial Services of Porsche AG and MAN Financial Services.
 37
Volkswagen Group – Main Ratings 1)

 Long Term / Short Term Long Term / Short Term

 Volkswagen AG A3 (N) / P-2 BBB+ (N) / A-2

 Volkswagen Financial Services AG A3 (N) / P-2 BBB+ (N) / A-2

 Volkswagen Bank GmbH 2) A1 (N) / P-1 A- (N) / A-2

1) As of June 30, 2020 2) Senior Unsecured Ratings Outlook: (P)ositive, (S)table, (N)egative, RfD = Ratings under review for Downgrade, RfU = Ratings under review for Upgrade 38
Volkswagen Brand – Turnaround in the US expected for 2021 Focus on efficient local production and logistics Product portfolio based on market demand - > 90% of US sales produced in North America - Significant reduction in incentive spend - Lower material costs and one-offs due to less complexity - Improved model mix to higher profitability SUVs that fit the - First local production on MEB platform from 2022 market Fix costs improvements Deliveries to US customers, ‘000 units / Market share in % 2020 New 2021 New 2022/2023 500 ID.4 Localized ID.4 Atlas Cross Sport New Golf GTI 250 Tiguan PA Atlas PA2 Jetta PA Atlas PA Taos (new Compact SUV) 0 Cross Sport PA 2012 2013 2014 2015 2016 2017 2018 2019 2020 3.0 2.6 2.2 2.0 1.8 2.0 2.1 2.1 2.2 39
Volkswagen Group China performance
 (January to December 2020)

 January – December 2019
 [thsd. units] Proportionate operating profit, January to September January – December 2020
 [units]
 -9.1%
 -17.4% -80.9%
 4,500 4,234 4,500

 3,849 € 3.2 bn € 2.6 bn 4,057
 4,000 4,000
 -9.9%
 3,500 3,163 +48.5% 3,500

 3,000 2,851 2,880 3,000
 1-9/2019 1-9/2020
 2,500 2,500

 2,000 1,940 2,000

 1,500
 -21.6% 1,500
 +5.4%
 -38.7% 1,000
 1,000
 690 727 770 774
 +2.6% 604
 500 282 173 500
 87 89
 0
 0
 1)

1) Incl. Hong Kong, excl. Ducati. Group numbers incl. Volkswagen Commercial Vehicles, Scania and MAN.
 40
Leading the Transformation.

Integrity & Compliance
Together4Integrity: Group-wide integrity and compliance program in full swing

 STRATEGY
 Ethics and compliance is central to
 business strategy

 RISK MANAGEMENT > % 1) CULTURE OF INTEGRITY
 1
 Ethics and compliance risks are 2 3 Leaders at all levels across the
 identified, owned, managed and organization build and sustain a
 mitigated 4 5 culture of integrity

 SPEAK-UP ENVIRONMENT RESOLUTE ACCOUNTABILITY
 The organization encourages, The organization takes action and
 protects and values the reporting of holds itself accountable when
 concerns and suspected wrongdoing wrongdoing occurs

1) Group entities covered; as of October 2020; Current coverage 71 countries, >55.000 employees reached through T4I dialogue formats

16.11.2020 42
Leading the Transformation.

Commitment
We are convinced that we have a strong Investment Proposition Shaping mobility – Strong brands with clear positioning and great products that inspire customers for generations A leading position in China with global footprint and value creating growth to come. Fully committed to "Go to Zero" and shaping e-mobility Transforming to one of the leading automotive software players Business portfolio optimisation and rigorous allocation of capital Taking complexity out and pushing for industry-leading economies of scale Delivering on demanding financial targets and committed to dividend pay out ratio Unleash value Integrity as the foundation of a successful business 44
Investor Relations Team
 We are pleased to answer your inquiries regarding Volkswagen shares and other capital market
 related questions.

 Helen Beckermann (Wolfsburg office)
 Head of Group Investor Relations
 E-Mail: Helen.Beckermann@volkswagen.de
 Telephone: +49 5361 9 49015

 Alexander Hunger (Wolfsburg office) Andreas Buchta (Wolfsburg office) Ulrich Hauswaldt (Wolfsburg office)
 Investor Relations Manager Investor Relations Manager Investor Relations Manager
 Equity & ESG Equity & Key Contact North America Equity & Debt
 E-Mail: Alexander.Hunger@volkswagen.de E-Mail: Andreas.Buchta@volkswagen.de E-Mail: Ulrich.Hauswaldt@volkswagen.de
 Telephone: +49 5361 9 47420 Telephone: + 49 5361 9 40765 Telephone: +49 5361 9 42224

 Andreas Kowalczyk (Wolfsburg office) Monika Kowalski (Wolfsburg office)
 Investor Relations Manager Investor Relations Manager
 Equity Equity
 E-Mail: Andreas.Kowalczyk@volkswagen.de E-Mail: Monika.Kowalski@volkswagen.de
 Telephone: +49 5361 9 23183 Telephone: +49 5361 9 31106

The official website of Volkswagen Group Investor Relations. Company topics, brandchannels, innovation and informations.
 45
Leading the Transformation.

Appendix
The Shareholder Structure, Supervisory and Management Board

 Shareholder Structure of Volkswagen AG Supervisory Board of Volkswagen AG Board of Management of Volkswagen AG1)

 Number of Outstanding Shares Chairman Hans Dieter Pötsch Chairman of the Board Dr. Herbert Diess
 of Management of
 Preferred shares Members Dr. Hussain Ali Al Abdulla Volkswagen AG
 206,205,445 Dr. Hessa Sultan Al Jaber
 41.1% Dr. Bernd Althusmann Brand Group Dr. Oliver Blume
 58.9% Dr. Hans-Peter Fischer ‚Sport & Luxury‘
 Marianne Heiß Brand Group Markus Duesmann
Ordinary shares Jörg Hofmann ‘Premium’
 295,089,818 Johan Järvklo
 Ulrike Jakob Functional Responsibility Gunnar Kilian
 Dr. Louise Kiesling ‘Human Resources’ and
 Current Voting Rights Distribution Peter Mosch Brand Group ‘Truck &
 Others Bertina Murkovic Bus‘
 Bernd Osterloh
 9.9% Functional Responsibility Hiltrud D. Werner
 Dr. jur. Hans Michel Piëch
Qatar Holding ‘Integrity and Legal
 17.0% Dr. jur. Ferdinand Oliver Porsche
 Affairs’
 53.1% Porsche SE, Dr. rer. comm. Wolfgang Porsche
 Stuttgart2) Conny Schönhardt Functional Responsibility Frank Witter
 20.0%
 Athanasios Stimoniaris ‘Finance and IT’
 State of Lower Stephan Weil
Saxony, Hanover Werner Weresch Functional Responsibility Frank Witter
 ‘Components and (temporarily until further notice)

 (as at December 31, 2019) Procurement’

1) EachBoard Member is responsible for one or more functions within the Volkswagen Group. The work of the Board of Management of Volkswagen AG is supported by the boards of the brands and regions as well as by the other group business
units and holdings. 2) On May 12 2020, Porsche SE announced increase in voting rights to 53.3% Exact figure not disclosed.
 47
Diesel issue: Special Items & payments

 € (bn) Diesel special items Payments

 Legal 7.0
 Other items 9.2
 2015
 -
 16.2

 2016
 Mainly legal risks 6.4 ~3.0

 Buyback/retrofit program 2.2
 2017 Legal 1.0
 3.2 ~16.1

 2018 Mainly legal risks 3.2 ~5.3

 2019 Mainly legal risks 2.3 ~1.9

 as of 9m 2020 Mainly legal risks 0.7 ~2.0

 Total 32.0 ~28.3

 48
You can also read