A Promising Candidate to Reliably Index Attentional Bias Toward Alcohol Cues-An Adapted Odd-One-Out Visual Search Task - Frontiers
←
→
Page content transcription
If your browser does not render page correctly, please read the page content below
ORIGINAL RESEARCH
                                                                                                                                        published: 10 February 2021
                                                                                                                                   doi: 10.3389/fpsyg.2021.630461

                                            A Promising Candidate to Reliably
                                            Index Attentional Bias Toward
                                            Alcohol Cues–An Adapted
                                            Odd-One-Out Visual Search Task
                                            Janika Heitmann 1,2* , Nienke C. Jonker 2 and Peter J. de Jong 2
                                            1
                                             Verslavingszorg Noord Nederland, Groningen, Netherlands, 2 Department of Clinical Psychology and Experimental
                                            Psychopathology, University of Groningen, Groningen, Netherlands

                                            Attentional bias (AB) has been suggested to contribute to the persistence of substance
                                            use behavior. However, the empirical evidence for its proposed role in addiction
                                            is inconsistent. This might be due to the inability of commonly used measures to
                                            differentiate between attentional engagement and attentional disengagement. Attesting
                                            to the importance of differentiating between both components of AB, a recent study
                                            using the odd-one-out task (OOOT) showed that substance use was differentially related
                                            to engagement and disengagement bias. However, the AB measures derived from
                                            the OOOT showed insufficient reliability to be used as a solid measure of individual
                           Edited by:       differences. Therefore, the current study aimed to improve the reliability of the AB
                          Eva Kemps,
          Flinders University, Australia
                                            measures derived from the OOOT by using more distinct contrast stimuli, adding
                       Reviewed by:
                                            practice trials, increasing the number of trials, and by having participants perform the
            Thomas Edward Gladwin,          task in an alcohol-relevant context. We contrasted the original OOOT with the adapted
             University of Chichester,      OOOT (i.e., OOOT-adapt) and assessed AB in low- and high-drinking individuals.
                     United Kingdom
                      Andrew Jones,         Participants were 245 undergraduate students who typically tend to drink either low
               University of Liverpool,     or high amounts of alcohol. In one condition, AB was measured with the original OOOT
                     United Kingdom
                                            in a typical laboratory context, whereas in the other condition, AB was measured with
                  *Correspondence:
                      Janika Heitmann
                                            the OOOT-adapt in a bar (i.e., alcohol-relevant) context. The OOOT-adapt showed
                    j.heitmann@vnn.nl       superior internal consistency, especially for the high-drinking group. Further, specifically
                                            the OOOT-adapt differentiated between low- and high-drinking participants showing
                   Specialty section:
         This article was submitted to
                                            that high drinkers engaged faster with alcohol cues than did low drinkers. Thus, the
                    Health Psychology,      OOOT-adapt was found to be a promising candidate to reliably index AB in the context
               a section of the journal
                                            of alcohol use. The OOOT-adapt further showed superior criterion validity as it could
               Frontiers in Psychology
                                            differentiate between low- and high-drinking individuals, thereby adding to the evidence
       Received: 17 November 2020
        Accepted: 11 January 2021           that AB might be involved in substance use behavior.
       Published: 10 February 2021
                                            Keywords: attentional bias, alcohol use, addiction, reliability, internal consistency, visual search
                            Citation:
          Heitmann J, Jonker NC and
      de Jong PJ (2021) A Promising
          Candidate to Reliably Index
                                            INTRODUCTION
     Attentional Bias Toward Alcohol
    Cues–An Adapted Odd-One-Out
                                            Dual process models of addiction attribute an important role to automatic processes when
                  Visual Search Task.       explaining the development and persistence of addiction (Wiers et al., 2007; Stacy and Wiers,
          Front. Psychol. 12:630461.        2010). One of these processes is biased selective attention, also referred to as attentional bias
    doi: 10.3389/fpsyg.2021.630461          (AB). AB can be expressed by a relatively strong tendency to direct attention to substance-relevant

Frontiers in Psychology | www.frontiersin.org                                    1                                       February 2021 | Volume 12 | Article 630461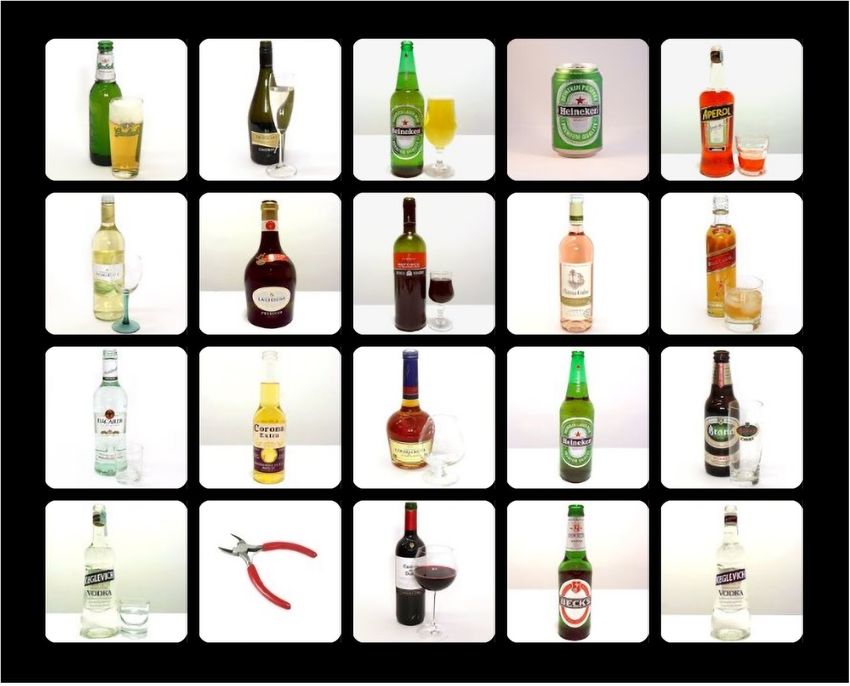
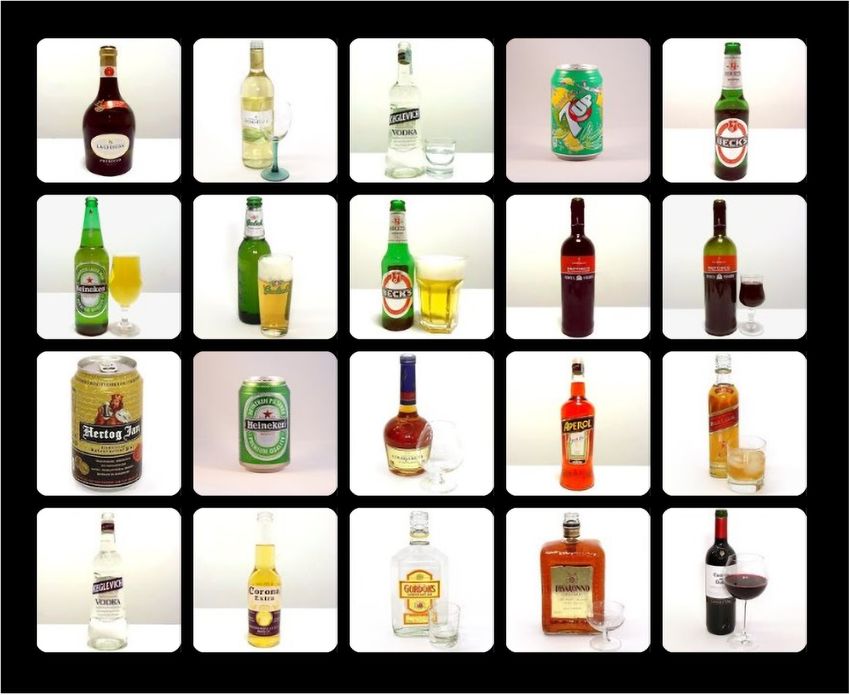
Heitmann et al.                                                                                                      Attentional Bias in Visual Search

cues in the environment (i.e., engagement bias) and/or by                image is presented among disorder-relevant distractors and the
a difficulty to redirect attention away from these cues (i.e.,           neutral trial type.
disengagement bias; Posner, 1980; Posner and Petersen, 1990).                First indication that the OOOT also seems useful in examining
Although, in general, the contributing role of AB to the                 engagement and disengagement bias in the context of alcohol
persistence of addictive behavior has been extensively studied           use comes from a previous study from our laboratory in which,
throughout the past 15 years, only little is known about the             in a student sample, it was found that the disengagement
specific role of engagement and disengagement bias. Directly             index of the OOOT, but not the engagement index, was
distinguishing between engagement and disengagement bias                 related to alcohol consumption, meaning that consuming
might not only help to improve the general understanding of              higher amounts of alcohol was related with more difficulty to
the disorder, but might also deliver knowledge that can be               disengage attention from alcohol cues (Heitmann et al., 2020).
used to improve treatment (see, for example, Rinck et al., 2005;         However, the robustness of these findings may be questioned
Hollitt et al., 2010).                                                   as the results indicated unacceptably low internal consistency
   One important reason for the limited knowledge about                  of the AB indices. Yet, especially when being used as a
the role of engagement and disengagement bias relates to                 measure of individual differences, it is critical that indices of
the fact that most measures of AB, such as the visual probe              AB show adequate reliability (e.g., McNally, 2019), and the
task (MacLeod et al., 1986), the addiction Stroop task (Cox              commonly found low reliability of popular AB measures has been
et al., 2006), the flicker-induced change blindness task (Jones          highlighted as a major threat for progress within this field of
et al., 2002), or more recently developed tasks (e.g., Pennington        research (Rodebaugh et al., 2016). Therefore, the current study
et al., 2020), are not configured to differentiate between these         was designed to take up the challenge to modify the OOOT in a
two underlying processes of attention (Field and Cox, 2008;              way to reach an acceptable level of reliability.
Grafton and MacLeod, 2014). That is, these assessment tasks                  There are several aspects that might explain the low internal
deliver one overall index for AB. There are studies using for            consistency of the AB indices as calculated from the original
example the visual probe task, which aimed to disentangle                OOOT in the previous study (Heitmann et al., 2020). That is
engagement and disengagement bias by the use of different                why we made several improvements to the design in the current
stimulus presentation durations (i.e., brief durations to index          study. First, the OOOT was improved by using more distinct
engagement bias and longer durations to index disengagement              contrast categories. That is, in the previous study, the neutral
bias; e.g., Bradley et al., 2003; Field et al., 2006; Noël et al.,       contrast categories (i.e., soft drinks and flowerpots) of the OOOT
2006). Although this approach provided relevant information              might have been insufficiently distinct from the target stimuli
about initial and maintained attention, it has been pointed out          (i.e., alcoholic drinks), as we found that participants tend to
that the use of different stimulus presentation intervals in the         make a substantial number of mistakes when following the task
visual probe task does not allow disentangling engagement and            instruction to indicate whether a trial included an odd-one-
disengagement processes (Grafton and MacLeod, 2014). One task            out. Other studies, using more distinct contrast categories that
that is configured to deliver separate indices for engagement            were visually as well as content-wise less similar to the target
bias and disengagement bias is the so-called odd-one-out task            category, have reported lower error rates and better internal
(OOOT; Hansen and Hansen, 1988; Rinck et al., 2005), which               consistency (e.g., Jonker et al., 2019). Second, the OOOT was
has been successfully used in previous research including studies        further improved by adding practice trials including feedback,
on anxiety (De Voogd et al., 2017), sexual pain disorders (Melles        as well as adding more trials of trial types that are crucial to
et al., 2016), and eating behavior (Jonker et al., 2019). In the         compute the AB indices (i.e., trial types including an odd-one-
OOOT, participants are presented with an array of multiple               out). This seemed relevant as, in the previous study, only a
stimuli identifying whether these stimuli are from the same              limited number of trials of the OOOT were available to compute
category of images or whether one stimulus is defiant from               the AB indices (i.e., due to its configuration and high error
the others (i.e., an odd-one-out). The task includes trials in           rate), and a sufficient number of trials are necessary to reliably
which (1) all images are either disorder-relevant or disorder-           measure AB (Ataya et al., 2012). Third, the current study assessed
irrelevant; (2) a disorder-relevant image is presented among             AB in an alcohol-relevant context, as it has been shown that
disorder-irrelevant distractors; (3) a disorder-irrelevant image         contextual factors might influence the stability of AB indices
is presented among disorder-relevant distractors; and (4) a              (Field et al., 2014; Christiansen et al., 2015). Fourth, AB was
disorder-irrelevant image is presented among disorder-irrelevant         assessed in two groups, namely, low-drinking participants (i.e.,
distractors. The last trial type allows calculating a baseline of        low-alcohol group; 1–7 standard units a week) and high-drinking
how long it generally takes to identify an odd-one-out among             participants (i.e., high alcohol group; at least 14 standard units
distractors allowing to calculate separate indices for engagement        of alcohol a week). Thereby, we could test whether AB measures
and disengagement bias by contrasting the reaction time of               are more stable when assessing individuals for which alcohol
this neutral trial type with the other two trial types including         cues are relatively salient/motivationally relevant—more likely
disorder-relevant images. That is, engagement bias is expressed          individuals who drink higher amounts of alcohol (Field and
by the difference between trials in which a disorder-relevant            Christiansen, 2012). Given that the previous study included a
image is presented among disorder-irrelevant distractors and             student sample in which the amount of used alcohol varied from
the neutral trial type, whereas disengagement bias is expressed          little to high, the task might not have measured the processes of
by the difference between trials in which a disorder-irrelevant          interest as, at least for the participants drinking little alcohol, the

Frontiers in Psychology | www.frontiersin.org                        2                                    February 2021 | Volume 12 | Article 630461
Heitmann et al.                                                                                                      Attentional Bias in Visual Search

alcohol cues might have been less motivationally relevant (i.e., no       Obsessive–Compulsive Drinking Scale (OCDS5) of the MATE-
AB for alcohol cues; Heitmann et al., 2020).                              Q. The OCDS5 consists of five items measuring the desire for
    To follow up on the previous study and to investigate whether         alcohol in the past 7 days, answered on a 5-point Likert scale.
the internal consistency could be improved by using more                  Alcohol craving was calculated by the sum of all items. Internal
distinct non-alcohol contrast stimulus categories, adding practice        consistency of the OCDS5 was poor (Cronbach α of 0.51). This
trials and increasing the number of trials, by having participants        seemed to be related to item 4 of this questionnaire (i.e., “How
perform the task in a relevant context, and by assessing AB in            much of an effort do you make to resist these thoughts or try to
low- and high-drinking individuals, we compared the internal              disregard or turn your attention away from these thoughts as they
consistency of this new and improved task, called the OOOT-               enter your mind?”). In line with our previous study (Heitmann
adapt, with the original OOOT. First, we hypothesized that                et al., 2020), this item was therefore excluded, resulting in an
the OOOT-adapt would show better internal consistency than                acceptable internal consistency of the sum score of the remaining
the OOOT, which would be especially evident in the high-                  four items (Cronbach α of 0.70).
alcohol group. Second, we expected students in the high-alcohol
group to show stronger AB to alcohol cues than students in the
                                                                          Alcohol Use Problems
low-alcohol group. And finally, we hypothesized that if indeed
                                                                          Alcohol use–related problems were indexed with the shorted
internal consistency of the OOOT-adapt is superior compared to
                                                                          version of the Rutgers Alcohol Problem Index (RAPI-18; White
the internal consistency of the OOOT, the difference between the
                                                                          and Labouvie, 1989). Participants had to indicate how often they
low- and high-alcohol group would be more pronounced when
                                                                          experienced the 18 described situations in the past, using a 5-
AB was measured with the OOOT-adapt.
                                                                          point Likert scale ranging from “never” (1) to “very often” (5). Per
                                                                          participant, a sum of scores was calculated. Internal consistency
                                                                          of the RAPI-18 was good (Cronbach α of 0.86).
MATERIALS AND METHODS
This study was preregistered with OSF and can be accessed via             Attentional Bias to Alcohol
the following link1 .                                                     Attentional bias to alcohol cues was measured with the original
                                                                          OOOT, as used in Heitmann et al. (2020), or the adapted
Participants                                                              version of the OOOT (OOOT-adapt). During the original OOOT,
Participants signed up for the study via an online participant            participants focused their attention on a red fixation cross in
platform. There were two advertisements on this platform, one             the center of the screen for 500 ms after which they had to
recruiting individuals who drink low amounts of alcohol (low-             indicate as quickly and correctly as possible whether there was
alcohol group; 1–7 units per week) and one recruiting individuals         an odd-one-out image within a 5 × 4 image matrix (500 × 500
who drink high amounts of alcohol (high-alcohol group; 14                 pixels) by pressing the “0” (no odd-one-out) or “1” (yes, odd-
units or more per week). Based on power analyses on the main              one-out present) button on the keyboard. The task consisted
analyses, a medium effect size of 0.6, power of 95%, and an α             of 54 trials with an odd-one-out and 18 trials without an odd-
level of 0.05, we aimed for a sample size of 122 participants in          one-out (72 trials in total). The task was divided into three
each group. This was in line with previous studies showing a              blocks of 24 trials. There were no practice trials in this task.
medium effect size when differentiating between groups using              The task consisted of three types of odd-one-out-present trials:
an AB task (e.g., Grafton and MacLeod, 2014). Eventually, 245             alcohol target trials, with an alcohol odd-one-out and neutral
undergraduate students (46% male, meanage = 20.3, SDage = 2.08)           (soft drinks or flower pots) distractors; alcohol distractors trial,
from the psychology bachelor program of the University of                 with alcohol distractors and a soft drink or flower pot odd-one-
Groningen participated in the study.                                      out; neutral target in neutral distractors trial, with a soft drink
                                                                          odd-one-out in flower pot distractors; or a flower pot odd-one-
                                                                          out in soft drinks distractors. The three trial types without an
Materials                                                                 odd-one-out consisted of either 20 alcohol images, 20 soft drink
Alcohol Use and Craving                                                   images, or 20 flower pot images. All trial types were randomly
The Measurements in Addiction for Triage and Evaluation                   presented, and odd-one-out images randomly appeared over
Questionnaire (MATE-Q; Schippers and Broekman, 2014) was                  the possible positions, with the exception of directly above or
used to assess the quantity and frequency of alcohol use in the           below the fixation cross. Attentional engagement and attentional
past 30 days, as well as craving for alcohol in the past 7 days.          disengagement were inferred from trials in which an odd-one-
Quantity of use was indexed by summing the amount of standard             out was present. Engagement bias was calculated by subtracting
glasses of alcohol consumed on a typical Monday, Tuesday, etc.            the mean response latency of alcohol target trials from the
This sum score was then multiplied by four to represent the               mean response latency of neutral target in neutral distractors
amount of alcohol consumed in a typical month. Frequency of               trials. More attentional engagement with alcohol cues is then
use was indexed by the question: “How often in the last 30 days           reflected in higher (more positive) scores. Disengagement bias
have you used alcohol?” Alcohol craving was indexed by the                was calculated by subtracting the mean response latency of
                                                                          neutral target in neutral distractors trials from the mean response
1
    https://osf.io/yfm25                                                  latency of alcohol distractors trials. More difficulty to disengage

Frontiers in Psychology | www.frontiersin.org                         3                                   February 2021 | Volume 12 | Article 630461
Heitmann et al. Attentional Bias in Visual Search
attention from alcohol cues is reflected in higher positive scores. task (i.e., two conditions). On top of the adaptations to the
See Figure 1 for an example of a trial from the OOOT. task (see materials), also the location in which the OOOT-adapt
The OOOT-adapt differed from the original OOOT in the was performed was different from the location in which the
following aspects: (1) the OOOT-adapt included at least 12 OOOT was performed. That is, the original version of the task
practice trials during which participants received feedback. If was performed in a laboratory where assessment took place
necessary, the number of practice trials was increased by one until throughout the whole day similar to the study of Heitmann et al.
a participant correctly responded to at least nine trials; (2) the (2020), whereas the adapted version of the task was performed in
OOOT-adapt consisted of 162 trials with 126 odd-one-out trials an alcohol-relevant context after 3 PM in the afternoon, i.e., a bar.
and 36 trials without an odd-one-out, divided into three blocks To ensure that the location would not reveal the two different
of 54 trials each; (3) the neutral distractors were images of office versions of the task, or bias the participants who would sign
supplies and flowers instead of soft drinks and flower pots (see up, information about the location was given only 12 h prior
Heitmann et al., 2020). See Figure 2 for an example of a trial to participants’ appointment. At that time, the online participant
of the OOOT-adapt. platform no longer accepted switching time slot.
The procedures of both versions of the study were similar.
Procedure On entry to the laboratory or bar, participants signed informed
This study was approved by the ethical committee of the consent. Then they indicated their gender and age. They also
psychology department of the University of Groningen (PSY- reported on their state alcohol craving by answering how much
1819-S-0081 and PSY-1819-S-0082). From the low-alcohol group they currently craved alcohol on a 7-point Likert scale ranging
and the high-alcohol group, half of the participants were assigned from “no craving” (1) to “a lot of craving” (7). Hereafter
to the original OOOT and half to the OOOT-adapt. Participants participants completed the OOOT or OOOT-adapt, followed
were not aware that there were two different versions of the by the MATE-Q and the RAPI-18. Given the difference in the
FIGURE 1 | Example trial of the OOOT—an alcohol distractors trial.
Frontiers in Psychology | www.frontiersin.org 4 February 2021 | Volume 12 | Article 630461Heitmann et al. Attentional Bias in Visual Search
FIGURE 2 | Example trial of the OOOT-adapt—an alcohol distractors trial.
number of trials between the OOOT and the OOOT-adapt, consistency of the OOOT and the OOOT-adapt was calculated,
participants completing the OOOT needed approximately 20 min per group (i.e., low- and high-alcohol groups), in two different
to complete the study, whereas participants completing the ways: (1) a split-half Spearman–Brown coefficient was calculated
OOOT-adapt needed approximately 30 min. All participants from the outcomes of the tasks based on the trials of the first
received course credits in return for their participation. For half and the second half of the tasks; and (2) a second method
the first 16 participants, the RAPI-18 was erroneously not in which Spearman–Brown coefficients were calculated from
included in the study. outcome measures based on half of the trials where we distributed
the trials alternately to one of two subsets. The first trial of one
Analyses Plan particular trial type was randomly allocated to either of the two
subsets. Internal consistency was calculated for the engagement
Data Reduction of OOOT and OOOT-Adapt
and disengagement indices of both tasks. The Fisher Z test was
Data reduction was performed separately for both conditions
used to statistically compare the internal consistency coefficients
(OOOT and OOOT-adapt) and both groups (low- and high-
of the engagement and disengagement indices as calculated from
alcohol groups). Participants who fell more than three SDs
the OOOT and the OOOT-adapt.
below the mean accuracy of their condition and group were
excluded. As a next step, trials with incorrect responses were
deleted. Further, trials in which participants respond faster than Hypothesis 2
200 ms (i.e., expected anticipation errors) or fall more than three To examine whether students of the high-alcohol group showed
SDs below or above their mean response latency of that trial a stronger AB to alcohol cues than students in the low-
type were excluded. alcohol group, we performed one-tailed independent t tests
comparing students drinking low amounts of alcohol, with
Hypothesis 1 students drinking high amounts of alcohol. We examined group
To examine whether the OOOT-adapt showed better internal differences for the OOOT and OOOT-adapt separately. Per
consistency than the original version of the OOOT, internal condition, two independent t tests were performed, one on
Frontiers in Psychology | www.frontiersin.org 5 February 2021 | Volume 12 | Article 630461Heitmann et al. Attentional Bias in Visual Search
attentional engagement and one on attentional disengagement. TABLE 1 | Use per week per group based on self-identification.
Given multiple comparisons per group (engagement and
Quantity Low (n = 157) High (n = 84)
disengagement bias), for the one-tailed independent t tests, we
used an adjusted α of 0.025, to reduce the likelihood of incorrectly 1–7 77 0
rejecting the null hypothesis (i.e., making a Type I error). 8–10 32 3
To increase confidence in our results delivered by the 11–13 14 6
t tests following the frequentist approach, we also reported ≥14 34 75
results following the Bayesian approach. Therefore, Bayesian Quantity, units of alcohol consumed in an average week in the past 30 days.
independent-samples t tests with Cauchy priors were calculated,
which are set at the recommended default r = 0.707. BF10 , which
quantifies the evidence for the alternative hypotheses over the excluded for this reason. These numbers were identical for the
null hypotheses, was reported. A Bayes factor of 1 is considered data reduction based on self-identified and reported alcohol use.
no evidence, between 1 and 3 anecdotal, between 3 and 10 Mean percentage of correct responses after exclusion per group is
moderate, between 10 and 30 strong, between 30 and 100 very reported in Table 3. Trials with incorrect responses were deleted.
strong, and more than 100 extreme evidence that the data are in Further, trials in which participants responded faster than 200 ms
line with the alternative hypothesis. Conversely, a Bayes factor (i.e., expected anticipation errors) or fell more than three SDs
between 1/3 and 1 will be considered anecdotal; between 1/3 and below or above the mean response latency of that trial type
1/10, moderate evidence; between 1/10 and 1/30 strong evidence; were excluded. For the OOOT, no too slow or too fast responses
between 1/30 and 1/100, very strong evidence; and less than were found. Also for the OOOT-adapt, there were no too slow
1/100, extremely strong evidence that the data are more likely responses, but there were too fast responses. In the self-identified
under the null hypothesis (Wagenmakers et al., 2017). low-alcohol group, one response was faster than 200 ms; in
the self-identified high-alcohol group, six; in the reported low-
Hypothesis 3 alcohol group, none; and in the reported high-alcohol group,
To examine if the difference between students in the low- seven responses were faster than 200 ms and therefore deleted.
alcohol group and high-alcohol group was more pronounced
when AB was measured with the OOOT-adapt, we compared
Hypothesis 1: Does the OOOT-Adapt
the confidence interval of the effect size comparing students
who drink low vs. high amounts of alcohol derived from the Have Better Internal Consistency Than
OOOT-adapt with the confidence interval of the effect size the Original Version of the OOOT?
derived from the OOOT. Internal consistency calculated with the split-half method and
the alternating method and the related confidence intervals are
reported in Table 4. The Fisher Z test was used to statistically
RESULTS compare the internal consistency coefficients of the OOOT and
the OOOT-adapt. Internal consistency as calculated via the split-
Descriptives half method showed that the internal consistency of the OOOT-
Of the 245 participants signing up for the study, four reported adapt was indeed higher than that of the OOOT. This was not
no alcohol consumption in the past month and were therefore consistently the case for the internal consistency as measured
excluded from the study. All four belonged to the low- with the alternating method.
drinking group. Of the remaining 241 participants, 157 identified
themselves as drinking low amounts of alcohol (1–7 units a Hypothesis 2: Do Student Who Drink
week), and 84 as drinking high amounts of alcohol (>14 units
a week). However, there seemed to be anomalies in these self- High Amounts of Alcohol Have a
identified groups and the quantity of alcohol use reported during Stronger AB to Alcohol Cues Than
the study (Table 1). We therefore decided to test our hypotheses Students Who Drink Low Amounts of
based on the self-identified groups, as well as on groups based Alcohol?
on the quantity of alcohol use reported during the study, that Mean AB scores and outcomes of the one-tailed independent t
is, a group of low drinkers (1–10 units a week) and a group of tests are reported in Table 5. Taking into account the adjusted
high drinkers (11 or more units a week). In the following, we α of 0.025, the results showed that only the OOOT-adapt was
will refer to these two approaches as self-identified groups and able to differentiate between the low- and high-alcohol group.
reported groups. The numbers of participants per group and per Specifically, individuals in the high-alcohol group have more
condition for both approaches as well as the group characteristics attentional engagement with alcohol cues than individuals in
are provided in Table 2. the low-alcohol group. This was the case when the groups were
assigned based on self-identified alcohol use, as well as the
Data Reduction of OOOT and reported amount of used alcohol. Bayes factors showed moderate
OOOT-Adapt to strong evidence that there are no differences between the
Participants who fell more than three SDs below the mean groups on engagement and disengagement bias as measured
accuracy were excluded. In the OOOT-adapt, five participants with the OOOT or on the disengagement bias as measured
(two in the low- and three in the high-alcohol group) were with the OOOT-adapt.
Frontiers in Psychology | www.frontiersin.org 6 February 2021 | Volume 12 | Article 630461Heitmann et al. Attentional Bias in Visual Search
TABLE 2 | Group characteristics.
Frequency Quantity State craving Craving Problems
Group Mean SD Mean SD Mean SD Mean SD Mean SD
OOOT Low Self-identified 5.88 3.39 43.29 54.69 1.83 1.12 5.64 1.37 29.54 8.82
(n = 96)
Reported 4.93 2.84 22.94 10.50 1.71 1.05 5.37 1.27 26.93 6.64
(n = 68)
High Self-identified 11.48 6.20 132.26 93.20 2.16 1.55 6.74 1.39 36.89 7.68
(n = 31)
Reported 9.93 5.33 113.49 89.43 2.15 1.40 6.53 1.41 36.38 8.94
(n = 59)
OOOT-adapt Low Self-identified 6.82 3.95 41.25 30.80 1.79 1.10 5.69 1.38 29.24 7.52
(n = 61)
Reported 5.55 2.77 25.00 8.68 1.73 1.00 5.50 1.44 27.54 6.80
(n = 44)
High Self-identified 12.04 5.44 117.66 57.23 2.94 1.63 7.13 1.96 37.69 9.08
(n = 53)
Reported 11.57 5.29 109.31 53.50 2.70 1.62 6.90 1.83 36.92 8.83
(n = 70)
TABLE 3 | Percentage correct per group. of the alcohol AB measure. The updated version of the task,
called the OOOT-adapt, was also able to differentiate between
OOOT OOOT-adapt
participants who drank low amounts of alcohol and those who
Group Mean SD Mean SD drank a high amount of alcohol.
In accordance with our first hypothesis, we found the internal
Low Self-identified 69.05 22.61 86.04 8.36
consistency of the AB indices to be higher when measured
Reported 69.98 21.83 86.90 8.14
with the OOOT-adapt than when measured with the original
High Self-identified 70.93 23.29 85.62 9.15
OOOT. This was especially true when the internal consistency
Reported 68.69 23.81 85.19 9.02
of the tasks was calculated using the split-half method. When
calculating the internal consistency with the alternating method,
the internal consistency of the OOOT-adapt was significantly
Hypothesis 3: Is the Difference Between higher for the disengagement bias compared with the OOOT.
the Low- and the High-Alcohol Group Although the same tendency was evident for the engagement
More Pronounced When AB Was bias, the difference between the OOOT-adapt and OOOT did
Measured With the OOOT-Adapt When not reach significance. Similar results in which the split-half
Compared With the OOOT? method revealed higher internal consistency were found in a
It was originally planned to compare the confidence intervals of previous study (Jonker et al., 2019). One explanation for this
the analyses of the OOOT and the OOOT-adapt. However, given apparently consistent difference between both ways of allocating
the findings, this became redundant. That is, these analyses were trials to one or the other half could be that the split-half method
planned on the premises that the tasks would provide relatively is less sensitive to variable carryover effects of individual trials
similar outcomes and group differences, yet one might be more and reflects therefore a more stable reflection of the process
pronounced than the other. However, the OOOT gives a negative of interest. In addition, the findings indicated that the internal
attentional engagement score, and the OOOT-adapt, a positive consistency of the OOOT-adapt was most favorable in the group
attentional engagement score. For the attentional disengagement of participants who drank high amounts of alcohol. This is
scores, this is reversed, but also here the tasks provide very in line with the idea that AB measures are more stable in
different outcomes. Furthermore, only the OOOT-adapt showed individuals where the salience/motivational relevance of the cues
a significant difference between the low- and high-alcohol group. is higher (Field and Christiansen, 2012), generally individuals
who drink more frequent and higher amounts. Based on the
current findings, one can expect the reliability of the OOOT-
DISCUSSION adapt to be even better when assessing AB in a clinical sample.
Therefore, the reliability of the OOOT-adapt might further be
The current study showed that using more distinct non-alcohol tested in future research including treatment-seeking individuals
contrast categories, adding practice trials and increasing the diagnosed with substance use disorder. Especially, as the current
number of trials, having participants perform the AB assessment sample was restricted to a homogenous sample of university
task in an alcohol-relevant context, and assessing AB in high- students, it seems important to test the generalizability of results
drinking individuals resulted in increased internal consistency in the clinical range.
Frontiers in Psychology | www.frontiersin.org 7 February 2021 | Volume 12 | Article 630461Heitmann et al. Attentional Bias in Visual Search
TABLE 4 | Internal consistency (Spearman–Brown).
Low High
OOOT OOOT-adapt Z P OOOT OOOT-adapt Z p
Self-identified Eng Split-half 0.07 0.40 2.113 0.017 −0.21 0.44 2.904 0.002
(−0.14; 0.28) (0.16; 0.60) (−0.54; 0.17) (0.18; 0.64)
Alternating 0.19 0.24 0.313 0.377 0.48 0.61 0.788 0.215
(−0.02; 0.38) (−0.02; 0.47) (0.14; 0.72) (0.40; 0.76)
Dis Split-half −0.15 0.26 2.494 0.006 0.19 0.66 2.544 0.005
(−0.35; 0.06) (0.00; 0.48) (−0.19; 0.52) (0.47; 0.79)
Alternating 0.01 0.47 2.989 0.001 0.53 0.74 1.866 0.031
(−0.20; 0.22) (0.24; 0.65) (0.20; 0.75) (0.58; 0.84)
Reported Eng Split-half 0.01 0.35 1.782 0.037 −0.06 0.47 3.149 0.001
(−0.24; 0.26) (0.05; 0.59) (−0.32; 0.20) (0.26; 0.64)
Alternating 0.16 0.22 0.312 0.377 0.48 0.57 0.688 0.246
(−0.09; 0.39) (−0.09; 0.49) (0.25; 0.66) (0.38; 0.71)
Dis Split-half −0.37 0.49 4.635Heitmann et al. Attentional Bias in Visual Search
TABLE 5 | Mean attentional bias scores and one-tailed independent t tests.
OOOT
Self-identified
Low (n = 88) High (n = 29) t p BF10 Cohen d
Engagement −391.70 (470.60) −373.75 (560.16) −0.170 0.433 0.255 −0.036
Disengagement 728.75 (624.34) 819.08 (658.80) −0.666 0.254 0.399 −0.143
Reported
Low (n = 63) High (n = 57) t p BF10 Cohen d
Engagement −389.11 (470.66) −507.46 (727.23) 1.068 0.856 0.102 0.195
Disengagement 688.41 (549.49) 934.39 (854.01) −1.894 0.030 1.871 −0.346
OOOT-adapt
Self-identified
Low (n = 59) High (n = 50) t p BF10 Cohen d
Engagement 133.73 (227.35) 257.26 (313.77) −2.377 0.010 2.463 −0.457
Disengagement −241.36 (212.45) −266.53 (350.95) 0.461 0.677 0.224 0.089
Reported
Low (n = 42) High (n = 67) t p BF10 Cohen d
Engagement 101.15 (199.92) 246.33 (301.82) −3.014 0.003 5.693 −0.542
Disengagement −227.19 (222.21) −269.02 (316.24) 0.749 0.772 0.267 0.147
explain its improvement regarding internal consistency. The redirect their attention to find the single neutral odd-one-out
number of trials from the OOOT-adapt was actually comparable stimulus. However, this difference in the number of alcohol
with other AB measures (e.g., Townshend and Duka, 2007; images on the screen between both types of trials might have
Pennington et al., 2020). Nevertheless, future research might differentially affected participants’ response times, for example,
want to disentangle which adaptations of the OOOT-adapt are by eliciting stronger craving or distraction from the task when
relevant regarding its reliability, for example, the influence of responding to alcohol distractors trials showing multiple alcohol
the number of trials and in particular the number of trials images. In addition, one could also speculate that the multitude
necessary to reliably measure the process of interest (i.e., AB). of alcohol images elicited multiple instances of engagement
Third, although the OOOT-adapt showed improved internal next to a difficulty to disengage. Future research might want
consistency, it did not reach a value that is considered as a to investigate to what extent slowed responding to alcohol
“good” reliability coefficient (≤0.8) based on commonly reported distractors trials indeed reflects disengagement bias, for example,
thresholds (Clark and Watson, 1995). This might relate to by using eye-tracking during task performance. Fifth, there
the fact that the task follows an unblocked task design in were discrepancies between individuals’ self-identified average
which trials are randomly presented, the use of divers images, amount of used alcohol and what was later reported during
and/or the fact that the task was assessed in a non-clinical the study about the past month. As indicated, we therefore
sample (see above; Ataya et al., 2012). Furthermore, it has completed all analyses based on self-identification prior to the
been argued that the commonly used thresholds as defined to study and based on the reported amount of consumed alcohol.
assess reliability of questionnaires might not hold for measuring Generally, results seem to point in the same direction, and we
processes such as AB based on reaction times (e.g., Elgersma therefore do not expect that group allocation influenced the
et al., 2019). Fourth, it might be important to consider that results in a relevant way.
there was a difference in the number of alcohol stimuli on the
screen between the alcohol distractors trials that are critical to
compute the disengagement bias and the alcohol target trials Conclusion
that are critical to calculate engagement bias (19 vs. 1). The Adapting the original OOOT by using more distinct contrast
presentation of multiple alcohol images in the alcohol distractors stimulus categories and adding practice trials and more relevant
trials was necessary to ensure that the initial attention would trials, as well as assessing this task in an alcohol-relevant context
be typically directed on an alcohol image, thereby allowing and in high-drinking individuals, indeed improved the internal
to test how much difficulty participants would experience to consistency of the AB measure. This improved task also showed
Frontiers in Psychology | www.frontiersin.org 9 February 2021 | Volume 12 | Article 630461Heitmann et al. Attentional Bias in Visual Search
superior criterion validity as the engagement bias index of the University of Groningen. The patients/participants provided
OOOT-adapt could differentiate between low- and high-drinking their written informed consent to participate in this study.
individuals, thereby adding to the evidence that AB might be
involved in substance use. To further test the utility of the
OOOT-adapt to index AB, a critical next step would be to AUTHOR CONTRIBUTIONS
evaluate whether the promising psychometric properties also
hold in the clinical range, and whether the AB measure not only JH and NJ were responsible for the data collection. NJ conducted
remains consistent within one assessment procedure but also the analysis. JH drafted this manuscript. All authors contributed
shows stability over time (test–retest reliability). If proven to be to the design of the study and further contributed to the writing
a reliable measure, the OOOT-adapt can enhance the field of process and approved this final manuscript.
research by serving as a task to further test the causal role of
AB in addiction.
FUNDING
This project was funded by ZonMw (Netherlands Organization
DATA AVAILABILITY STATEMENT for Health Research and Development; info@zonmw.nl; 80–
84,300–98-61,035).
The raw data supporting the conclusions of this article will be
made available by the authors, without undue reservation.
ACKNOWLEDGMENTS
ETHICS STATEMENT We would like to thank Lyanne Reitsma, Julia van Schaik, and
Anne Ridder for their contribution to the data collection. Further,
The studies involving human participants were reviewed and we also thank the owners of “De Bres” and “Bramble” for making
approved by Ethical Committee of Psychology (ECP) of the the bars available for conducting this study.
REFERENCES Field, M., Marhe, R., and Franken, I. H. (2014). The clinical relevance of
attentional bias in substance use disorders. CNS Spectr. 19, 225–230. doi: 10.
Ataya, A. F., Adams, S., Mullings, E., Cooper, R. M., Attwood, A. S., and Munafò, 1017/S1092852913000321
M. R. (2012). Internal reliability of measures of substance-related cognitive Grafton, B., and MacLeod, C. (2014). Enhanced probing of attentional bias: the
bias. Drug Alcohol. Depend. 121, 148–151. doi: 10.1016/j.drugalcdep.2011. independence of anxiety-linked selectivity in attentional engagement with and
08.023 disengagement from negative information. Cogn. Emot. 28, 1287–1302. doi:
Bradley, B. P., Mogg, K., Wright, T., and Field, M. (2003). Attentional bias in drug 10.1080/02699931.2014.881326
dependence: vigilance for cigarette-related cues in smokers. Psychol. Addict. Hansen, C. H., and Hansen, R. D. (1988). Finding the face in the crowd: an anger
Behav. 17, 66–72. doi: 10.1037/0893-164x.17.1.66 superiority effect. J. Pers. Soc. Psychol. 54, 917–924. doi: 10.1037/0022-3514.54.
Christiansen, P., Schoenmakers, T. M., and Field, M. (2015). Less than meets the 6.917
eye: reappraising the clinical relevance of attentional bias in addiction. Addict. Heitmann, J., Jonker, N. C., Ostafin, B. D., and de Jong, P. J. (2020). Attentional bias
Behav. 44, 44–50. doi: 10.1016/j.addbeh.2014.10.005 for alcohol cues in visual search – increased engagement, difficulty to disengage
Clark, L. A., and Watson, D. (1995). Constructing validity: basic issues in objective or both? PLoS One 15:e0228272. doi: 10.1371/journal.pone.0228272
scale development. Psychol. Assess. 7, 309–319. doi: 10.1037/1040-3590.7. Hollitt, S., Kemps, E., Tiggemann, M., Smeets, E., and Mills, J. S. (2010).
3.309 Components of attentional bias for food cues among restrained eaters. Appetite
Cox, W. M., Fadardi, J. S., and Pothos, E. M. (2006). The addiction-stroop test: 54, 309–313. doi: 10.1016/j.appet.2009.12.005
theoretical considerations and procedural recommendations. Psychol. Bull. 132, Jones, B. C., Jones, B. T., Blundell, L., and Brunce, G. (2002). Social users of alcohol
443–476. doi: 10.1037/0033-2909.132.3.443 and cannabis who detected substance-related changes in a change blindness
De Voogd, E. L., Wiers, R. W., and Salemink, E. (2017). Online visual search paradigm report higher levels of use than those detecting substance-neutral
attentional bias modification for adolescents with heightened anxiety and changes. Psychopharmacology 165, 93–96. doi: 10.1007/s00213-002-1264-2
depressive symptoms: a randomized controlled trial. Behav. Res. Ther. 92, Jonker, N. C., Heitmann, J., Ostafin, B. D., MacLeod, C., Glashouwer, K. A., and
57–67. doi: 10.1016/j.brat.2017.02.006 de Jong, P. J. (2019). A new approach to facilitating attentional disengagement
Elgersma, H. J., Koster, E. H. W., Vugteveen, J., Hoekzema, A., Penninx, from food cues in unsuccessful dieters: the bouncing image training task. Behav.
B. W. J. H., Bockting, C. L. H., et al. (2019). Predictive value of attentional Res. Ther. 120:103445. doi: 10.1016/j.brat.2019.103445
bias for the recurrence of depression: a 4-year prospective study in remitted MacLeod, C., Mathews, A., and Tata, P. (1986). Attentional bias in emotional
depressed individuals. Behav. Res. Ther. 114, 25–34. doi: 10.1016/j.brat.2019. disorders. J. Abnorm. Psychol. 95, 15–20. doi: 10.1037//0021-843X.95.1.15
01.001 McNally, R. J. (2019). Attentional bias for threat: crisis or opportunity? Clin.
Field, M., and Christiansen, P. (2012). Commentary on Ataya et al (2012), ‘Internal Psychol. Rev. 69, 4–13. doi: 10.1016/j.cpr.2018.05.005
reliability of measures of substance-related cognitive bias’. Drug Alcohol. Melles, R. J., Dewitte, M. D., Ter Kuile, M. M., Peters, M. M., and de Jong, P. J.
Depend. 124, 189–190. doi: 10.1016/j.drugalcdep.2012.02.009 (2016). Attentional bias for pain and sex, and automatic appraisals of sexual
Field, M., and Cox, W. M. (2008). Attentional bias in addictive behaviors: a review penetration: differential patterns in dyspareunia vs vaginismus? J. Sex Med. 13,
of its development, causes, and consequences. Drug Alcohol. Depend. 97, 1–20. 1255–1262. doi: 10.1016/j.jsxm.2016.05.008
doi: 10.1016/j.drugalcdep.2008.03.030 Noël, X., Colmant, M., Van Der Linden, M., Bechara, A., Bullens, Q., Hanak, C.,
Field, M., Eastwood, B., Bradley, B. P., and Mogg, K. (2006). Selective processing et al. (2006). Time course of attention for alcohol cues in abstinent alcoholic
of cannabis cues in regular cannabis users. Drug Alcohol. Depend. 85, 75–82. patients: the role of initial orienting. Alcohol. Clin. Exp. Res. 30, 1871–1877.
doi: 10.1016/j.drugalcdep.2006.03.018 doi: 10.1111/j.1530-0277.2006.00224.x
Frontiers in Psychology | www.frontiersin.org 10 February 2021 | Volume 12 | Article 630461Heitmann et al. Attentional Bias in Visual Search Pennington, C. R., Shaw, D. J., Adams, J., Kavanagh, P., Reed, H., Robinson, M., Townshend, J. M., and Duka, T. (2007). Avoidance of alcohol-related stimuli in et al. (2020). Where’s the wine? Heavy social drinkers show attentional bias alcohol-dependent inpatients. Alcohol. Clin. Exp. Res. 31, 1349–1357. doi: 10. towards alcohol in a visual conjunction search task. Addiction 115, 1650–1659. 1111/j.1530-0277.2007.00429.x doi: 10.1111/add.14997 Wagenmakers, E. J., Love, J., Marsman, M., Jamil, T., Ly, A., Verhagen, J., et al. Posner, M. I. (1980). Orienting of attention. Q. J. Exp. Psychol. 32, 3–25. doi: (2017). Bayesian inference for psychology. Part II: example applications with 10.1080/00335558008248231 JASP. Psycho. Bull. Rev. 25, 58–76. doi: 10.3758/s13423-017-1323-7 Posner, M. I., and Petersen, S. E. (1990). The attention system of the human brain. White, H. R., and Labouvie, E. W. (1989). Towards the assessment of adolescent Annu. Rev. Neurosci. 13, 25–42. doi: 10.1146/annurev.neuro.13.1.25 problem drinking. J. Stud. Alcohol. 50, 30–37. doi: 10.15288/jsa.1989.50.30 Rinck, M., Reinecke, A., Ellwart, T., Heuer, K., and Becker, E. S. (2005). Speeded Wiers, R. W., Bartholow, B. D., van den Wildenberg, E., Thush, C., Engels, detection and increased distraction in fear of spiders: evidence from eye R. C. M. E., Sher, K. J., et al. (2007). Automatic and controlled processes and movements. J. Abnorm. Psychol. 114, 235–248. doi: 10.1037/0021-843X.114.2. the development of addictive behaviors in adolescents: a review and a model. 235 Pharmacol. Biochem. Behav. 86, 263–283. doi: 10.1016/j.pbb.2006.09.021 Rodebaugh, T. L., Scullin, R. B., Langer, J. K., Dixon, D. J., Huppert, J. D., Bernstein, A., et al. (2016). Unreliability as a threat to understanding psychopathology: Conflict of Interest: The authors declare that the research was conducted in the the cautionary tale of attentional bias. J. Abnorm. Psychol. 125, 840–851. doi: absence of any commercial or financial relationships that could be construed as a 10.1037/abn0000184 potential conflict of interest. Schippers, G. M., and Broekman, T. G. (2014). MATE-Q 2.1. Nijmegen: Bêta Boeken. Copyright © 2021 Heitmann, Jonker and de Jong. This is an open-access article Stacy, A. W., and Wiers, R. W. (2010). Implicit cognition and addiction: a tool distributed under the terms of the Creative Commons Attribution License (CC BY). for explaining paradoxical behavior. Annu. Rev. Clin. Psychol. 6, 551–575. doi: The use, distribution or reproduction in other forums is permitted, provided the 10.1146/annurev.clinpsy.121208.131444 original author(s) and the copyright owner(s) are credited and that the original Tavakol, M., and Dennick, R. (2011). Making sense of Cronbach’s alpha. Int. J. Med. publication in this journal is cited, in accordance with accepted academic practice. No Educ. 27, 53–55. doi: 10.5116/ijme.4dfb.8dfd use, distribution or reproduction is permitted which does not comply with these terms. Frontiers in Psychology | www.frontiersin.org 11 February 2021 | Volume 12 | Article 630461
You can also read