A SARS COV 2 (COVID 19) - BIOLOGICAL NETWORK TO FIND TARGETS FOR DRUG REPURPOSING - NATURE
←
→
Page content transcription
If your browser does not render page correctly, please read the page content below
www.nature.com/scientificreports
OPEN A SARS‑CoV‑2 (COVID‑19)
biological network to find targets
for drug repurposing
Mahnaz Habibi1,2,5*, Golnaz Taheri3,5 & Rosa Aghdam4,5
The Coronavirus disease 2019 (COVID-19) caused by the SARS-CoV-2 virus needs a fast recognition
of effective drugs to save lives. In the COVID-19 situation, finding targets for drug repurposing
can be an effective way to present new fast treatments. We have designed a two-step solution to
address this approach. In the first step, we identify essential proteins from virus targets or their
associated modules in human cells as possible drug target candidates. For this purpose, we apply
two different algorithms to detect some candidate sets of proteins with a minimum size that drive
a significant disruption in the COVID-19 related biological networks. We evaluate the resulted
candidate proteins sets with three groups of drugs namely Covid-Drug, Clinical-Drug, and All-Drug.
The obtained candidate proteins sets approve 16 drugs out of 18 in the Covid-Drug, 273 drugs out
of 328 in the Clinical-Drug, and a large number of drugs in the All-Drug. In the second step, we study
COVID-19 associated proteins sets and recognize proteins that are essential to disease pathology.
This analysis is performed using DAVID to show and compare essential proteins that are contributed
between the COVID-19 comorbidities. Our results for shared proteins show significant enrichment for
cardiovascular-related, hypertension, diabetes type 2, kidney-related and lung-related diseases.
The global impact of the Coronavirus disease 2019 (COVID-19) pandemic has brought an urgent need for finding
treatments to reduce morbidity and mortality. Repurposing existing drugs is an effective and fast way to prepare
such treatments by finding a new use for drugs that already have safety and pharmacological p rofiles1. Drug
repurposing can be done using different drug development methods. In the COVID-19 situation, drug repur-
posing can be a fast and cost-effective approach to find novel treatments. Recent studies have increasingly used
computational methods to algorithmically predict new drug targets or drug repurposing candidates. Focusing
on drug targets that are already approved clinically and evaluating their therapeutic potential for COVID-19 can
be one of the fastest solutions. Fehr et al.2 revealed that SARS-CoV-2 infects human cells by hijacking the host’s
translation mechanism to produce 29 viral proteins. These 29 proteins bind to multiple human proteins to set
up the molecular processes that needed for viral duplication and additional host infection. Gorden et al.3 used
affinity purification mass spectrum method to find interactions between a map from human and SARS-CoV-2
proteins. This study released the 26 proteins from 29 proteins that the SARS-CoV-2 infects in the human body.
They also identified 332 human proteins involve in these viral proteins binds. Among these 332 proteins, 67
druggable human proteins with 69 existing drugs identified. The identification of dependencies between host
proteins and virus infection can provide significant insights into finding suitable drug targets for developing
antivirals medicine against SARS-CoV-2. Saha et al.4 described the probable molecular mechanism of Remdesivir
as one of the best drug candidates for COVID-19. They showed the effect of Remdesivir with abroad spectrum of
anti-viral activity against many viruses, to inhibit the RNA synthesis of SARS-CoV-2. Patel et al.5 constructed a
tripartite network-based for repurposing the approved drugs to treat COVID-19 patients. Their study showed that
the anti-viral properties of resveratrol against SARS-CoV-2 virus could be readily exploited to effectively control
the viral load at the early stages of COVID-19 infection. Saha et al.6 took a brief look at the development stages
of different vital drug candidates, that were being tested as potential vaccines or therapeutics against COVID-19.
Analysis of this large amount of data in the biological process helped us for a better understanding of cel-
lular mechanisms. This kind of data is usually represented in the form of a network. One of the most important
biological networks constructed from experimental data is the protein–protein interaction (PPI) n etwork7–9. The
1
Department of Mathematics, Qazvin Branch, Islamic Azad University, Qazvin, Iran. 2Science for Life Laboratory,
Stockholm, Sweden. 3Department of Electrical Engineering and Computer Science, KTH Royal Institute of
Technology, Stockholm, Sweden. 4School of Biological Sciences, Institute for Research in Fundamental Sciences
(IPM), Tehran, Iran. 5These authors contributed equally: Mahnaz Habibi, Golnaz Taheri and Rosa Aghdam. *email:
mhabibi@ipm.ir
Scientific Reports | (2021) 11:9378 | https://doi.org/10.1038/s41598-021-88427-w 1
Vol.:(0123456789)
www.nature.com/scientificreports/
graph-based analysis of PPI networks with respects to different human diseases has resulted in the identification
of appropriate drug target proteins10, 11. The previous studies demonstrated that the relationship between essential
proteins in the biological network along with some graph-based properties12, 13. Most of the essential proteins
have a high degree in a n etwork13. Another important graph-based property in the network is the betweenness
12
centrality value . The value of betweenness for each node in the network represents the total number of the
shortest pathways that pass through this node in the network.
Recent studies showed that removing the essential proteins disrupt the vital biological processes in the cell
and may be lethal to an organism14. Some computation methods designed informative networks from bio-
logical processes data to identify essential proteins with important biological properties. For this purpose two
algorithms15, 16 are applied. These algorithms detect the minimum number of proteins from biological networks
that lead to a major disruption in the network.
In the first part of this work, we construct a biological network as a weighted simple graph related to virus
targets or their associated biological processes. Then, we use two effective a lgorithms15, 16 to find the minimum
number of proteins from biological networks that lead to a major disruption in the network. The selection meth-
ods for essential nodes in the first and second algorithms are based on the betweenness value for each node in a
weighted graph and the spectral partitioning in the Laplacian graph, respectively. We evaluate our candidate sets
as essential proteins related to COVID-19 with three groups of drugs namely Covid-Drug, Clinical-Drug, and
All-Drug. We show that 16 drugs out of 18 in the Covid-Drug and 273 drugs out of 328 in the Clinical-Drug are
approved by our method. Also, our candidate sets approve a large number of drugs in All-Drug.
In the second part of this work, we identify proteins in our candidate sets that are associated with some under-
lying diseases related to COVID-19. At the end, we find 93 proteins as a final set of essential proteins related to
disease pathology. It can be concluded that our candidate proteins are targeted by a large number of COVID-19
drugs. We also show some significant signaling and disease pathways.
Results
To identify the best proteins set as a drug target, we propose a two-step method. In the first step, we try to detect
essential proteins from SARS-CoV-2 virus targets or their associated modules in human cells. Then, in the
second step, we try to find essential proteins that are related to comorbid disease pathologies. To construct our
sets, we consider 1374 Informative Biological Process (IBP) Gene Ontology (GO) terms related to 332 human
proteins identified in3 as high-confidence virus human protein interactions. In order to prioritize proteins that
can be essential proteins sets related to COVID-19, T, Cut1, Cut2, C1, C2, T1, T2 and Cut75, Level1, S1, S2, E1 and
E2, sets are defined as follows:
• T: The set of 332 proteins reported as possible targets of the SARS-CoV-2 v irus3.
• Cut1: The minimum cut set resulted from Algorithm 116.
• Cut2: The minimum cut set resulted from Algorithm 215.
• C1: The elements of Cut1 that physically interacted with the SARS-CoV-2 virus (intersection of Cut1 and T).
• C2: The elements of Cut2 that physically interacted with the SARS-CoV-2 virus (intersection of Cut2 and T).
• T1: Intersection of C1 and C2.
• T2: Union of C1 and C2.
• Cut75: From all of the proteins in the Cut1 or Cut2 that have the highest degree and the highest number of
disruption, 75 most important proteins are selected.
• Level1: The neighbors of T set.
• S1: Intersection of Cut1 and Cut2.
• S2: Union of Cut1 and Cut2.
• E1: Set of essential proteins associated with COVID-19 that are placed in Cut1.
• E2: Set of essential proteins associated with COVID-19 that are placed in Cut2.
The complete description of T, Cut1, Cut2 , C1, C2, T1, T2, Cut75, Level1, S1, S2, E1 and E2 sets is presented in
Table 1.
Evaluation of our proposed essential proteins subsets with respect to the number of disrup‑
tion. The Venn diagram for T1, T2, C1, C2 and T sets is illustrated in Fig. 1 (http://bioinformatics.psb.ugent.
be/webtools/Venn/). This figure shows that from 332 proteins in T set, only 71 proteins are selected with men-
tioned algorithms (T2). From these 71 proteins, 20 proteins are selected in both of mentioned algorithms (T1)
(see “Methods” section), 37 proteins are selected uniquely in Algorithm 1 (C1 \T1) and 14 proteins are selected
uniquely in Algorithm 2 ( C2 \T1). The results of mentioned sets are summarized in Table 2. The number of
proteins in T1, C1, C2, T2, Cut75, T, S1, Cut1, Cut2, S2 and Level1 sets are reported in the first row. The second row
shows the mean of degrees of the mentioned sets. The third row shows the number of 1374 IBP GO terms over-
lapped with our sets and their number of unique IBP GO terms are collected in the fourth row (see “Dataset” in
the “Methods” section)17. According to Table 2, for example, the number of unique IBP GO terms for T1 with a
size of 20 is equal to 400, and similarly for T2 with a size of 71 is equal to 821. The ratio of the number of unique
IBP GO terms to the total IBP GO terms indicates that the degree of uniqueness of the introduced proteins sets
are represented in the fifth row. The ratio of the number of unique IBP GO terms to the size of the selected set
represents on average, each protein causes how many unique disruption. T1 has the highest percentage of unique
IBP GO terms and also, the ratio of the number of disruption on average in comparison with other sets. The
ratio of the number of unique IBP GO terms to the size of the selected set is shown in the sixth row of the table.
Scientific Reports | (2021) 11:9378 | https://doi.org/10.1038/s41598-021-88427-w 2
Vol:.(1234567890)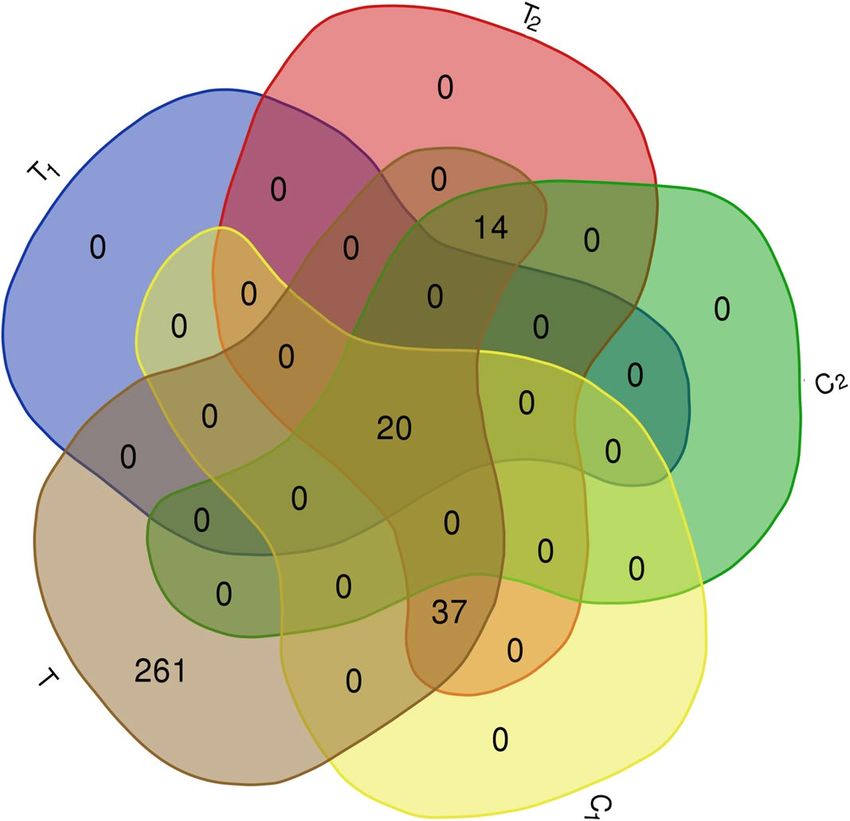
www.nature.com/scientificreports/
Set Description
T The set of 332 proteins reported as possible targets of the SARS-CoV-2 v irus3
Cut1 The minimum cut set resulted from Algorithm 116
Cut2 The minimum cut set resulted from Algorithm 215
C1 The elements of Cut1 that physically interacted with the SARS-CoV-2 virus (intersection of Cut1 and T)
C2 The elements of Cut2 that physically interacted with the SARS-CoV-2 virus (intersection of Cut2 and T)
T1 Intersection of C1 and C2
T2 Union of C1 and C2
From all of the proteins in the Cut1 or Cut2 that have the highest degree and the highest number of disruption, 75 most important
Cut75
proteins are selected
Level1 The neighbors of set T
S1 Intersection of Cut1 and Cut2
S2 Union of Cut1 and Cut2
E1 Set of essential proteins associated with COVID-19 that are placed in Cut1
E2 Set of essential proteins associated with COVID-19 that are placed in Cut2
Table 1. Description of the defined sets. Best results are indicated in bold.
Figure 1. The Venn diagram of T1, T2, C1, C2 and T sets. The complete description of sets is presented in Table 1.
T1 C1 C2 T2 Cut75 T S1 Cut1 Cut2 S2 Level1
No. proteins 20 57 34 71 75 332 1115 2017 2100 3002 7845
Mean of degrees 122.45 95.41 96.44 88.28 406.48 59.65 78.09 69.91 59.12 59.32 59.71
IBP GO terms 439 857 557 975 1384 1870 10,378 14,642 13,726 17,990 18,052
Unique IBP GO terms 400 737 493 821 643 1374 1120 1279 1197 1306 1364
Percentage of Unique IBP GO terms 0.91 0.85 0.88 0.84 0.46 0.73 0.11 0.08 0.08 0.07 0.07
Average Unique IBP GO terms 20 12.92 14.5 11.56 8.57 4.13 1.00 0.63 0.57 0.43 0.17
Table 2. The summary of statistics of the proposed sets. The first row shows the size of T1, C1, C2, T2, Cut75,
T, S1, Cut1, Cut2, S2, Level1 sets. The second row shows the mean of degrees of mentioned sets. The number of
1374 IBP GO terms overlapped with the subsets and their number of unique IBP GO terms are collected in the
third and fourth rows, respectively. The ratio of the unique IBP GO terms to total IBP GO terms and the ratio
of the number of unique IBP GO terms to the size of the selected set are represented in the fifth and sixth rows,
respectively. The complete description of sets is presented in Table 1. Best results are indicated in bold.
Scientific Reports | (2021) 11:9378 | https://doi.org/10.1038/s41598-021-88427-w 3
Vol.:(0123456789)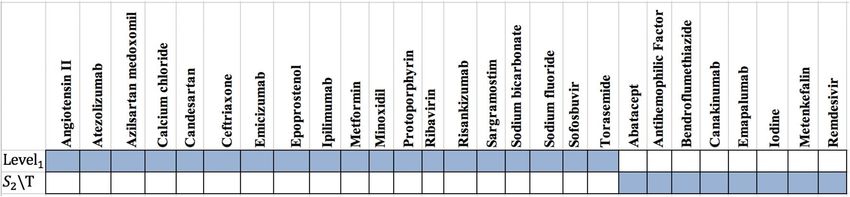
www.nature.com/scientificreports/
Figure 2. (a) Boxplot of the degrees in protein–protein interaction (PPI) network for T1, T2, C1, and C2 sets; (b)
Boxplot of the number of unique IBP GO terms resulted from each of the four sets. The complete description of
sets is presented in Table 1.
Figure 3. Boxplot of number of unique IBP GO terms resulted from 1000 randomly selected sets of sizes 20, 71,
57, and 34, respectively. Red small lines in the figure are the number of unique IBP GO terms for T1, T2, C1 and
C2 sets. The complete description of sets is presented in Table 1.
Compared to the Cut75 set, we can conclude that the proposed a lgorithms15, 16 are not just based on high degrees
and high disruption, also some valuable properties are used in them to select the important proteins.
Figure 2 shows the boxplots of the degrees in PPI network (part (a)) and the unique number of IBP GO
terms (part (b)) that are resulted from T1, T2, C1, and C2, respectively. As shown in Fig. 2, the degrees of selected
sets are similarly distributed, and the majority of the number of disruption is located between 0 and 40 with a
maximum value of 70. The median of the number of unique disruption related to T1 is bigger than the other sets.
In order to evaluate the performance of the mentioned algorithms, we compare our selected subsets from T
(T1, T2, C1 and C2) with randomly generated subsets. For each of the proposed sets (T1, T2, C1 and C2) of size n,
103 proteins sets are generated as possible targets of SARS-CoV-2 virus from T with size n. Suppose that Ni for
i = 1, . . . , 103 are the number of GO terms (from 1374) that disrupted with randomly generated set and N is the
number of unique IBP GO terms resulted from our sets. Let X = {i|Ni > N} for i = 1, . . . , 103 where X denotes
the number of random results that performed better than the output of the two mentioned algorithms. The null
hypothesis, H0, is that our selected proteins set of size n is not important. The alternative hypothesis, H1, is that
|X|
our selected proteins set of size n is indeed important. We use Exceeding Value as EV = , where |X| denotes
1000
the size of X18. If EV < α then, we reject H0 ( α is a threshold value that we consider to be 0.05). The values of EV
for all selected proteins sets are equal to zero (This value causes extremely significant results). We can conclude
that the results of mentioned algorithms show a better performance than all of these random selections. Figure 3
illustres the boxplots of the number of disruption resulted from 1000 randomly selected sets of sizes 20, 71, 57,
and 34, respectively. The small red lines above each boxplot in this figure shows the number of unique IBP GO
Scientific Reports | (2021) 11:9378 | https://doi.org/10.1038/s41598-021-88427-w 4
Vol:.(1234567890)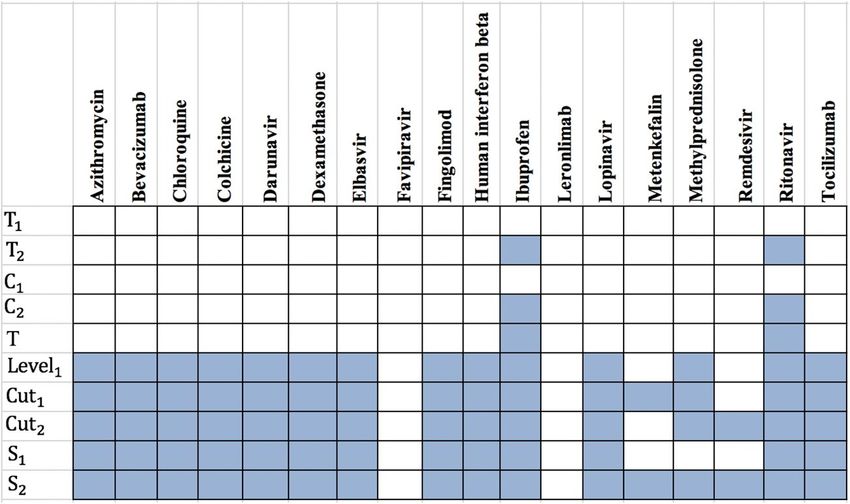
www.nature.com/scientificreports/
T1 C1 C2 T2 T S1 Cut1 Cut2 S2 Level1
No. proteins 20 57 34 71 332 1115 2017 2100 3002 7845
No. proteins targets 0 1 0 1 1 15 22 20 27 34
No. drugs 0 2 0 2 2 14 15 15 16 14
Ratio of the proteins targets 0 0.017 0 0.014 0.003 0.013 0.011 0.009 0.008 0.004
Ratio of drugs 0 0.035 0 0.028 0.006 0.0125 0.007 0.007 0.005 0.001
Table 3. The summary of drug targets and related drugs for Covid-Drug group. The first row shows the size of
T1, C1, C2, T2, T, S1, Cut1, Cut2, S2, Level1 sets. The number of proteins targets and related drugs in each set for
Covid-Drug group are reported in second and third rows, respectively. The fourth and fifth rows show the ratio
of the number of proteins that targeted and their related drugs in each set for Covid-Drug group to the size of
sets, respectively. The complete description of sets is presented in Table 1. Best results are indicated in bold.
Figure 4. The presence (blue color) or absence (white color) of the overlap of proteins targets of T1, T2, C1, C2 T,
Level1, Cut1, Cut2, S1 and S2 sets with the targets of Covid-Drug. The complete description of sets is presented in
Table 1.
terms related to T1, T2, C1, and C2 which are equal to 400, 821, 737, and 493, respectively (see Table 2). As shown
in this figure, the results of random selections are significantly less than our results. It means that there is no
random set that performs better than our selected set. It can be concluded that the results are significantly far
from random and by choosing the appropriate sets, a significant amount of disruption happens.
Evaluation of our proposed essential proteins subsets with respect to the related drugs. To
justify our proposed essential proteins, we evaluate 37 experimental unapproved drugs for COVID-19 that are
reported in DrugBank19. From these 37 drugs, 19 drugs have no targets information and only 18 drugs have the
drug target information from our PPI network that denoted as Covid-Drug. These 18 drugs have 78 proteins
targets in our PPI network. It is worth mentioning that just one of these proteins is from T set (P33527 protein).
We find that from these 18 drugs in Covid-Drug, only two of them have this target in 332 proteins including
Ritonavir and Ibuprofen. Both of these drug targets are approved with mentioned algorithms. In other words,
this target is determined with T2 to be one of the significant targets in mentioned algorithm. We also find that all
drugs in this group except Favipiravir and Leronlimab have targeted at least one proteins in our cut sets, while
the Level1 set with 7845 proteins are targeted with 14 drugs in Covid-Drug. The details of some statistical infor-
mation of our candidate essential proteins subsets for Covid-Drug group are reported in Table 3. In this table,
the first row indicates the size of T1, C1, C2, T2, T, S1, Cut1, Cut2, S2 and Level1 sets, respectively. The number of
proteins targets and related drugs for Covid-Drug group are reported in the second and third rows, respectively.
The fourth and fifth rows show the ratio of the number of proteins that are targeted and their related drugs for
Covid-Drug group to the size of sets, respectively. The results of presence (blue color) or absence (white color)
of overlaps in proteins targets of T1, T2, C1, C2, T, Level1, Cut1, Cut2, S1 and S2 sets with the targets of Covid-Drug
are shown in the Fig. 4. For a better evaluation of mentioned algorithms, the drug targets and related drugs in
Covid-Drug group are illustrated in Fig. 5 . In this figure, the green diamond nodes indicate the drugs and the
blue circle nodes show the targets associated with these drugs. The protein that is the target of a large number
of drugs is shown in red color. Figure 5 shows the distribution of drug targets in mentioned algorithm for three
separate subsets of S2. The first subset contains a protein that targeted by the virus (T2), the second subset con-
Scientific Reports | (2021) 11:9378 | https://doi.org/10.1038/s41598-021-88427-w 5
Vol.:(0123456789)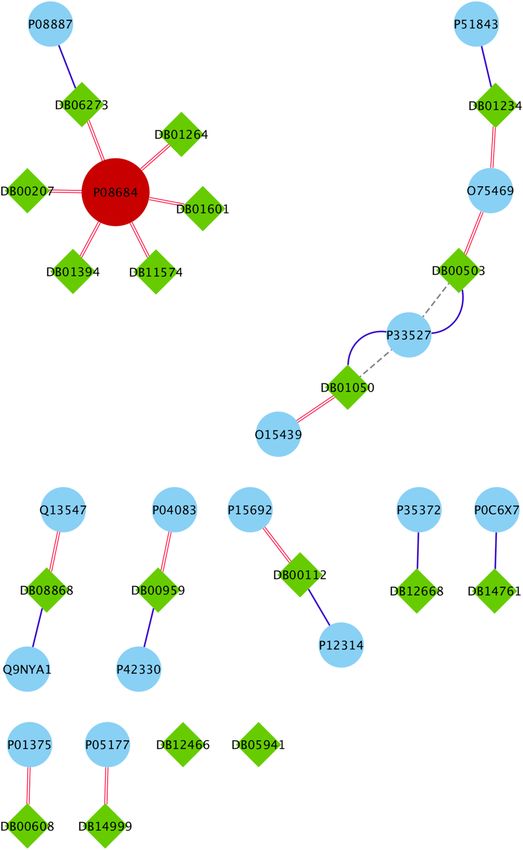
www.nature.com/scientificreports/

                                            Figure 5.  The drug targets in Covid-Drug group for T2, L (Level1 \T2), and C ( other proteins of S2 except S2 \L
                                            ) sets. The red color node indicates the protein that is the target of a large number of drugs. The red edges, blue
                                            edges and black dotted edges are related to L, C and T2 sets, respectively. The complete description of sets is
                                            presented in Table 1.

                                                                             T1     C1      C2      T2      T       S1      Cut1     Cut2    S2      Level1
                                             No. proteins                    20     57      34      71      332     1115    2017     2100    3002    7845
                                             No. proteins targets            1      4       2       5       15      154     218      217     281     398
                                             No. drugs                       2      17      4       19      30      225     246      260     273     284
                                             Ratio of the proteins targets   0.05   0.070   0.058   0.070   0.045   0.138   0.108    0.103   0.093   0.051
                                             Ratio of drugs                  0.1    0.298   0.117   0.267   0.090   0.201   0.1215   0.121   0.091   0.036

                                            Table 4.  The summary of drug targets and related drugs for Clinical-Drug group. The first row shows the size
                                            of T1, C1, C2, T2, T, S1, Cut1, Cut2, S2, Level1 sets. The number proteins targets and related drugs in each set for
                                            Clinical-Drug group are reported in second and third rows, respectively. The fourth and fifth rows show the
                                            ratio of the number of proteins that targeted and their related drugs in each set for Clinical-Drug group to the
                                            size of sets, respectively. The complete description of sets is presented in Table 1.

                                            tains some proteins that are located in Level1 \T2 (shown as L) and other proteins of S2 are located in the third
                                            subset (C). It is noticeable that the P08684 protein is shown in red color, is one of the targets for most drugs in
                                            the Covid-Drug group. The red, blue, and black dotted edges are related to L, C, and T2 sets, respectively.

          Scientific Reports |   (2021) 11:9378 |                      https://doi.org/10.1038/s41598-021-88427-w                                                  6

Vol:.(1234567890)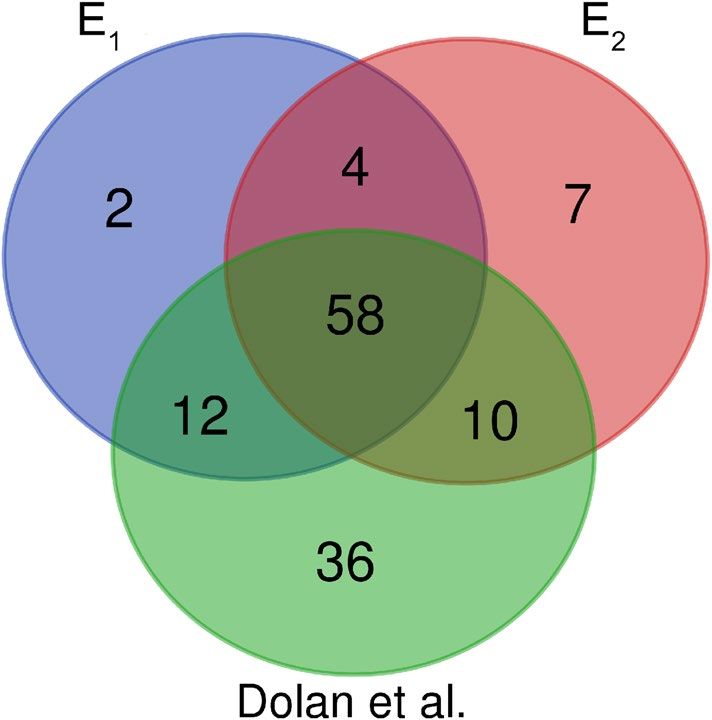
www.nature.com/scientificreports/

                                  Figure 6.  The presence (blue color) or absence (white color) of overlap of approved drugs in T and S2 sets that
                                  are not approved with any of the proteins in T2 set. The complete description of sets is presented in Table 1. Best
                                  results are indicated in bold

                                  Figure 7.  The presence (blue color) or absence (white color) of different approved drugs in Level1 and S2 \T sets
                                  that are not approved with any of the proteins in S2 set.The complete description of sets is presented in Table 1.

                                      The second group of drugs contains 449 drugs as clinical trials for COVID-19. From these 449 drugs, 328
                                  drugs have targets in the PPI network denoted as Clinical-Drug. These 328 drugs can target 888 proteins in a
                                  cell. From these 888 proteins, 281 proteins are approved with mentioned algorithms. The details of some statisti-
                                  cal information about Clinical-Drug are reported in Table 4. In this table, the first row indicates the size of T1,
                                  C1, C2, T2, T, S1, Cut1, Cut2, S2 and Level1 sets, respectively. The number of proteins targets and related drugs for
                                  Clincal-Drug group are reported in the second and third rows, respectively. The fourth and fifth rows show the
                                  ratio of the number of proteins that targeted and their related drugs for Clincal-Drug group to the size of sets,
                                  respectively. As seen in Table 4, from these 888 proteins, 15 of them are located in T set. From the 328 drugs
                                  in Clinical-Drug group, 30 drugs have these 15 targets. From these 15 proteins, five of them are approved with
                                  mentioned algorithms. On the other hand,19 drugs of this group are approved with the already-mentioned
                                  five proteins of T2. From above 30 drugs, 11 ( = 30 − 19) drugs can target proteins in T set, these drugs are not
                                  approved with the proposed sets, (T1, T2, C1 and C2), which are subsets of T. The size of our proposed sets is much
                                  smaller than T set, it is worth mentioning that despite the small size, they are able to determine important drug
                                  targets in the COVID-19. Our results show that 10 out of 11 drugs have been targeted with S2 set (see Fig. 6).
                                      We also find that from 7,845 proteins in Level1, 398 proteins are targeted by 284 drugs from Clinical-Drug
                                  group. It is noticeable that 273 drugs from these 328 drugs are approved with mentioned algorithms. Figure 7
                                  shows that from these 328 Clinical-Drugs, 19 drugs have targets in the Level1 set but are not approved with any
                                  of the proteins in S2 set. On the other hand, there are eight other drugs that can target proteins in S2 set but are
                                  not approved with any of the proteins in Level1 set. Despite the fact that the size of the recommended sets is
                                  much smaller than Level1 set, but the target of these drugs is neither belongs to T set nor Level1 set. From these
                                  eight drugs, two of them (Metenkefalin and Remdesivir) are related to a specific drug (Covid-Drug) that is
                                  widely used for COVID-19 (see Fig. 4). The drug targets and related drugs in Clinical-Drug group are illustrated
                                  in Fig. 8, 9 and 10 . In these figures, the green diamond nodes indicate that the drugs and the blue circle nodes
                                  show the targets associated with these drugs. Figure 8 shows the drug targets in Clinical-Drug group that are
                                  located in T2 set. The P33527 protein, shown in red color, is one of the targets of most drugs in the Clinical-Drug
                                  group. Figure 9 shows the drug targets in Clinical-Drug group that are located in L set. The P33527, P35348
                                  and Q16678 proteins shown in red color, are the targets of most drugs in the Clinical-Drug. The drug targets in
                                  Clinical-Drug group that are located in C set are reported in Fig. 10. The P08684, P05177, P04798, P07550, and
                                  Q15439 proteins shown in red color, are the targets of most drugs in the Clinical-Drug group.
                                      We also study the number of targets in all drugs reported in UniProt as human drugs that denoted as All-
                                  Drug. The summary of drug targets and related drugs are presented in Table 5. In this table, the first row indicates
                                  the size of T1, C1, C2 , T2 , T, S1, Cut1, Cut2 , S2 and Level1 sets, respectively. The number of proteins targets and
                                  related drugs for All-Drug group are reported in the second and third rows, respectively. The fourth and fifth
                                  rows show the ratio of the number of proteins that targeted and their related drugs for All-Drug group to the
                                  size of sets, respectively. It can be concluded that the proposed candidate proteins sets approve a large number
                                  of drugs in All-Drug.

                                  Evaluation of our candidate essential proteins associated with COVID‑19 pathology. The
                                  results of two previous subsections show that Cut1 and Cut2 sets are good candidates to find appropriate subsets
                                  that are related to COVID-19 pathology. In this subsection, two of these possible candidate subsets are evalu-

Scientific Reports |   (2021) 11:9378 |                https://doi.org/10.1038/s41598-021-88427-w                                                     7

                                                                                                                                                 Vol.:(0123456789)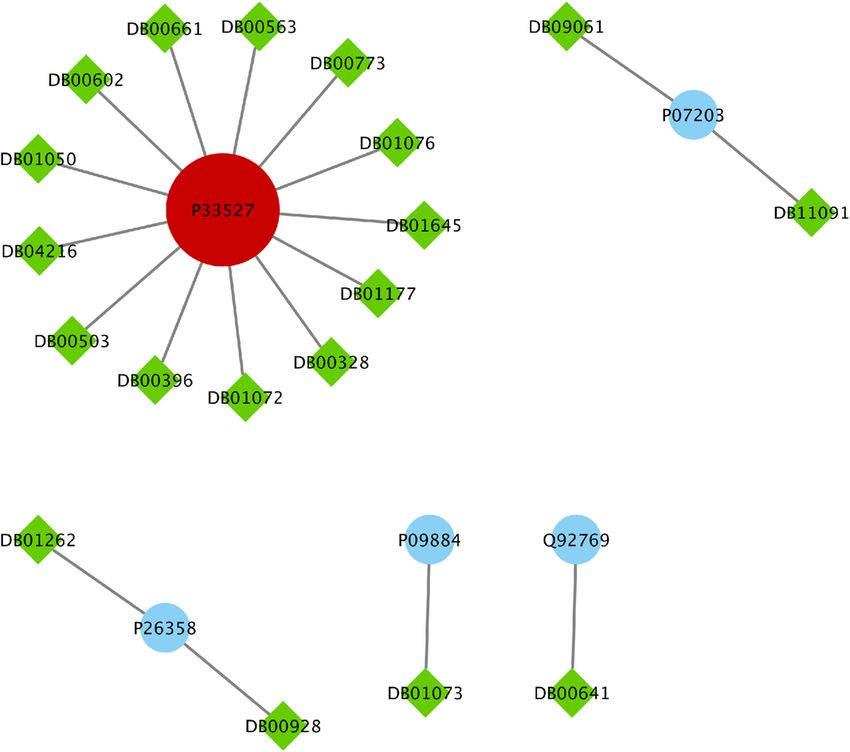
www.nature.com/scientificreports/

                                            Figure 8.  The drug targets in Clinical-Drug group that are located in T2 sets.

                                            ated. COVID-19 is a pandemic disease with a wide range of symptoms among different patients. What is clear
                                            is that the disease varies from asymptomatic to fatal in individuals. Recent studies show that the disease is
                                            more severe in people with underlying conditions such as Cardiovascular diseases, Diabetes, Hepatitis, Lung
                                            diseases, Kidney disease, and different types of cancers. Therefore, we expect that the underlying genetics of
                                            these diseases are associated with essential proteins that are associated with COVID-19. To find these essential
                                            proteins, we use gene-disease relation from Database for Annotation, Visualization, and Integrated Discovery
                                            (DAVID). Some proteins that are annotated to four out of five of these specific comorbid diseases in the Cut1 and
                                            Cut2 sets with significant p − value are chosen as a set of essential proteins associated with COVID-19 ( E1 and
                                            E2). Table 6 shows 76 and 79 essential proteins with the pathology of these comorbid diseases, respectively. In
                                            Fig. 11, we compare our candidate E1 and E2 sets with set of genes proposed by Dolan et al.20. This figure shows
                                            that 58 essential genes are approved by E1, E2 sets and also a set of genes proposed by Dolan et al. as essential
                                            proteins associated with COVID-19. We also evaluate the functional annotation by the performance of enrich-
                                            ment analysis on our candidate E1 and E2 sets. In Tables 7 and 8 the top significantly enrichment pathways for E1
                                            and E2 sets are identified by DAVID analysis are reported, respectively. Finally, 93 proteins contain E1 ∪ E2 are
                                            introduced as a final essential proteins set associated with COVID-19 disease pathology (See Table 6).

                                            Discussion and summary
                                            COVID-19 pandemic, which is caused by acute respiratory syndrome (SARS-CoV-2), is currently causing irrepa-
                                            rable harm to human life, so the world needs to quickly identify effective drugs to restrict the spread of the
                                            disease. One of the best ways to identify effective drugs in different diseases is to find proteins that are essential
                                            for the pathology of the diseases. The main idea of this paper is to find a set of proteins that are essential for the
                                            pathology of COVID-19 that can help us find some appropriate drugs. Therefore, in the first part of this work,
                                            we focused on finding the essential proteins of the virus targets or their associated modules in the human cells.
                                            For this purpose, we applied two algorithms to find the essential proteins associated with COVID-19 (Cut1 and
                                            Cut2). Both algorithms are based on finding the least number of proteins that are involved in the most biological
                                            processes associated with the virus and removing them causes the most disruption in the COVID-19 related
                                            biological networks. Then, we studied the set of proteins including the intersection and union of the results of
                                            these two algorithms and the intersection of each of these results with the targets of virus, as well as the set of
                                            virus targets and a set including the neighbors of the virus targets. Our results showed that out of 1373 biological
                                            processes related to COVID-19, 1306 biological processes have overlap with essential proteins in S2 (Table 2).
                                            On the other hand, according to the definition of the set of biological processes related to COVID-19, the targets
                                            set of virus (T) with 332 proteins has overlap with all 1374 biological processes. Then, we need a more detailed
                                            analysis for the candidate sets of essential proteins. We evaluated the number of drugs used as an unapproved
                                            drug in COVID-19 (Covid-Drug) and targeted at least one of the proteins in these candidate sets. The results of
                                            our study showed that of among 17 drugs in the Covid-Drug group, 16 drugs target at least one of the proteins
                                            in S2 set. From 17 drugs in this group, only Ritonavir and Ibuprofen target one of the proteins in T set which
                                            both of them are approved by S2 set. As a result, the T candidate set cannot be a good candidate as the essential
                                            proteins sets compared to our proposed S2 set. We also studied a group of drugs that are in the clinical trial
                                            phase (Clinical-Drug) and showed that 83% of them (273/328) target at least one protein of our candidate set.
                                            However, the T set confirms only 9% (30/328) of these drugs. Although the Level1 set approves 86% (284/328)
                                            of these drugs, the low ratio of drugs to the number of proteins of this set shows that the Level1 set cannot be a

          Scientific Reports |   (2021) 11:9378 |                https://doi.org/10.1038/s41598-021-88427-w                                                     8

Vol:.(1234567890)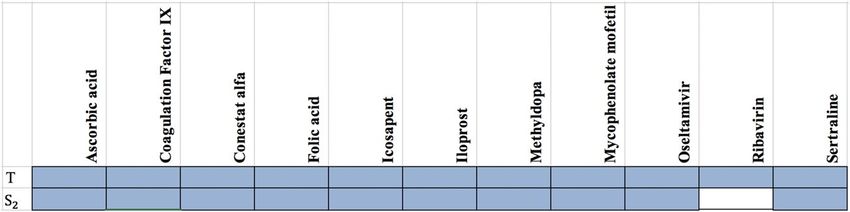
www.nature.com/scientificreports/

                                  Figure 9.  The drug targets in Clinical-Drug group that are located in L set.

                                  good candidate for essential proteins related to COVID-19 (Table 4). We also studied all of the drugs reported
                                  in UniProt that target at least one of the proteins in our PPI networks. The results of our study showed that our
                                  proposed S2, T1, C1, C2, T2 and S1 sets contain a significant percentage of drug targets (Table 5). The results of
                                  Tables 3, 4 and 5 show that out of 2,017 essential proteins obtained from Algorithm 1 (Cut1) 22 drug targets are
                                  from the Covid-Drug group, 218 drug targets are from the Clinical-Drug group and 581 drug targets are from
                                  all All-Drug group. Also, among 2100 essential proteins obtained from Algorithm 2 (Cut2), 20 drug targets are
                                  from the Covid-Drug group, 217 drug targets are from the Clinical-Drug group, and 539 drug targets are from
                                  the All-Drug group. In other words, the results of these two algorithms include a higher rate of target proteins
                                  than the Level1 and T sets, considering the size of the sets. As a result, the outcomes of both algorithms can be
                                  identified as suitable candidate sets for COVID-19 related essential proteins sets. But, it is noticeable that not
                                  every essential protein is an appropriate candidate as an essential protein, because some of the essential proteins
                                  are related to the cellular function of the cell, and selecting them may lead to disruption of cellular functions.
                                  Therefore, we try to select candidate proteins that are essentials in disease pathology.

Scientific Reports |   (2021) 11:9378 |                https://doi.org/10.1038/s41598-021-88427-w                                                  9

                                                                                                                                              Vol.:(0123456789)
www.nature.com/scientificreports/
Figure 10. The drug targets in Clinical-Drug group that are located in C set.
T1 C1 C2 T2 T S1 Cut1 Cut2 S2 Level1
No. proteins 20 57 34 71 332 1115 2017 2100 3002 7845
No. proteins targets 9 19 15 25 64 356 581 539 764 1393
No. drugs 76 166 87 177 274 2831 3345 3297 3754 4454
Ratio of the proteins targets 0.45 0.333 0.441 0.352 0.192 0.319 0.288 0.256 0.2545 0.177
Ratio of drugs 3.8 2.912 2.558 2.492 0.825 2.539 1.658 1.57 1.250 0.567
Table 5. The summary of drug targets and related drugs for All-Drug group. The first row shows the size of
T1, C1, C2, T2, T, S1, Cut1, Cut2, S2, Level1 sets. The number proteins targets and related drugs in each set for
All-drug group are reported in second and third rows, respectively. The fourth and fifth rows show the ratio of
the number of proteins that targeted and their related drugs in each set for All-drug group to the size of sets,
respectively. The complete description of sets is presented in Table 1.
Scientific Reports | (2021) 11:9378 | https://doi.org/10.1038/s41598-021-88427-w 10
Vol:.(1234567890)www.nature.com/scientificreports/
Proteins
O00206, O14543, O60603, P00533, P00734, P01019, P01130, P01133, P01137, P01344
P01374, P01375, P01579, P01584, P01889, P02647, P02649, P02751, P02778, P03372
P04114, P04637, P05019, P05089, P05112, P05164, P05231, P05362, P06858, P08571
P08684, P09211, P09601, P10145, P10415, P10635, P11021, P11473, P13498, P13500
E1
P13501, P14210, P14780, P15692, P16035, P17813, P19838, P21549, P28482, P29279
P29459, P29474, P31645, P31749, P35222, P35354, P38936, P40763, P40933, P41597
P42336, P42345, P42898, P48023, P48061, P60568, P78423, P78527, P81172, Q04721
Q14116, Q15848, Q16236, Q30201, Q99958, Q9NR96
O00206, O14543, O14763, O60603, P00533, P00734, P01019, P01033, P01130, P01133
P01137, P01344, P01375, P01579, P01583, P01584, P01889, P01891, P01892, P01911
P01912, P02647, P02649, P02778, P03372, P03989, P04114, P04229, P04439, P04637
P05019, P05089, P05106, P05112, P05164, P05231, P05362, P05534, P06858, P08253
E2
P08684, P09211, P09601, P10415, P10635, P11226, P13498, P13500, P13501, P14210
P14780, P15692, P16035, P17813, P19438, P19838, P25445, P29279, P29474, P31749
P35222, P35354, P38936, P40763, P42336, P42345, P48023, P48061, P60568, P78423
P78527, P81172, Q14116, Q15848, Q16236, Q30201, Q99958, Q9NR96, Q9Y2R2
Table 6. Essential proteins associated with COVID-19 pathology.
Figure 11. Essential proteins in E1, E2 sets and set of proteins proposed by Dolan et al.20 .
In the second part of this work, we focued on finding the essential proteins associated with COVID-19 pathol-
ogy. To detect this set of essential proteins, we studied proteins that are associated with some underlying diseases.
Since COVID-19 has more severe symptoms for patients with underlying diseases such as cardiovascular-related,
hypertension, diabetes type 2, kidney-related diseases, and lung-related diseases. Identifying the proteins asso-
ciated with these diseases that are in our essential proteins sets can be a suitable way to find essential proteins
that are fundamentally related to COVID-19 pathology. Therefore, we selected the proteins presented in each
of the candidate sets that are associated with at least four of the five underlying mentioned diseases. Our results
showed that 76 essential proteins from the Cut1 set and 79 essential proteins from the Cut2 set are related to the
mentioned diseases. These two sets are named E1 and E2 , respectively. Finally, 93 proteins are introduced as
essential proteins associated with COVID-19 disease pathology ( E1 ∪ E2). Our study showed that from these 93
proteins, only one protein, (P09601), was placed in the target set of virus (T) proteins and targeted by 15 drugs,
including NADH. It is noticeable that this drug was not in the two groups of Covid-Drug and Clinical-Drug, but
it has been approved in other studies r ecently21. Among these essential proteins, 7 proteins (P01375, P08684,
P10415, P10635, P15692, P35354, Q9NR96) have been targeted by Covid-Drug group drugs. Out of 18 drugs
in this group, 10 drugs including Azithromycin, Ritonavir, Ibuprofen, Colchicine and Dexamethasone were
approved through these essential proteins. Besides, we found that 35 proteins out of 93 essential proteins were
targeted by clinical drugs. We also found from 328 drugs in the Clinical-Drug group 185 drugs were approved
by these 35 essential proteins, including Baricitinib22 and Amlodipen. Finally, we studied that for 65 out of 93
essential proteins associated with COVID-19 pathology, 1689 drugs including Erythromycin and Letermorir
was introduced, which will be presented as future work. In addition, we analyzed the significant pathway enrich-
ment for each of the candidate essential proteins sets. The results showed some signaling pathways enrichment
Scientific Reports | (2021) 11:9378 | https://doi.org/10.1038/s41598-021-88427-w 11
Vol.:(0123456789)www.nature.com/scientificreports/
Term No. gene P-value FDR
Annotation cluster 1 (Enrichment score: 9.739)
hsa05142:Chagas disease (American trypanosomiasis) 18 1.15E−16 1.23E−14
hsa05144:Malaria 14 7.52E−16 2.68E−14
hsa05323:Rheumatoid arthritis 15 1.17E−13 2.09E−12
hsa05164:Influenza A 18 7.98E−13 1.22E−11
hsa05321:Inflammatory bowel disease (IBD) 13 1.00E−12 1.34E−11
hsa04620:Toll-like receptor signaling pathway 15 1.68E−12 1.99E−11
hsa05146:Amoebiasis 14 2.99E−11 2.28E−10
hsa05140:Leishmaniasis 12 8.49E−11 5.68E−10
hsa05152:Tuberculosis 16 1.67E−10 9.90E−10
hsa05134:Legionellosis 10 2.55E−09 1.30E−08
hsa05145:Toxoplasmosis 12 1.04E−08 4.82E−08
hsa04064:NF-kappa B signaling pathway 11 1.32E−08 5.89E−08
hsa04621:NOD-like receptor signaling pathway 9 7.35E−08 3.03E−07
hsa05133:Pertussis 9 7.49E−07 2.59E−06
hsa05132:Salmonella infection 9 1.64E−06 4.88E−06
h_nthiPathway:NFkB activation by Nontypeable Hemophilus influenzae 5 0.008042 0.129753
Annotation cluster 2 (Enrichment score: 4.639)
hsa04621:NOD-like receptor signaling pathway 9 7.35E−08 3.03E−07
hsa05020:Prion diseases 5 3.62E−04 6.06E−04
hsa04623:Cytosolic DNA-sensing pathway 6 4.52E−04 7.22E−04
Annotation cluster 3 (Enrichment score: 3.278)
hsa04060:Cytokine–cytokine receptor interaction 19 1.76E−11 1.57E−10
h_cytokinePathway:Cytokine Network 10 1.25E−08 2.12E−06
hsa04940:Type I diabetes mellitus 8 1.69E−07 6.47E−07
h_inflamPathway:Cytokines and Inflammatory response 10 2.09E−07 1.77E−05
hsa05332:Graft-versus-host disease 7 7.97E−07 2.66E−06
hsa05330:Allograft rejection 7 1.62E−06 4.88E−06
hsa04630:Jak-STAT signaling pathway 10 1.40E−05 3.55E−05
22.Cytokine-chemokine_CNS 7 3.54E−05 0.001257
hsa04672:Intestinal immune network for IgA production 6 1.04E−04 2.18E−04
Table 7. Some of the significantly enriched pathways that are related to COVID-19 essential proteins ( E1).
related to COVID-19 (hsa04621; hsa04064; hsa04620); that have been introduced in the previous study23. There
are also some significant disease-pathways (hsa05142; hsa05144; hsa05323; hsa05164; hsa05321) that have been
presented in previous s tudy24.
Methods
Dataset. In this work, we use five human high-throughput PPI network datasets. The first dataset, Huri,
contains 52,548 human binary protein interactions25. The second one is gathered from the Biological General
Repository for Interaction Datasets (BioGRID) and contains 296,046 interactions26. This dataset has several
interactions that are obtained from different techniques. We only use the interactions that are represented as
physical inactions and co-complexed proteins. The three other datasets are (Hippie27, Apid28, and Hint29) which
contain 57,428, 17,1448 and 64,399 experimentally interactions, respectively. These interactions are derived
from high-throughput yeast-two hybrid (Y2H) and mass spectrometry methods. All of the proteins from these
five datasets are mapped to their corresponding Uniprot ID. If a protein could not be mapped to a Uniprot ID, it
is removed. The final interactome that we used in this study contains 25,260 proteins and 30,4730 interactions.
For each of these proteins, we use biological process terms from GO17 to point out the biological modules in
human. We find that only 20,642 proteins from 25,260 or 81% of them are annotated. We use the IBP concept
to avoid biases in the annotations that would potentially lead to incorrect conclusions. We consider a biological
process annotation informative if it has the following two properties. First, it needs to have at least k proteins
annotated with it. Second, each of its descendants GO terms needs to have less than k proteins annotated with
them. In this study, we set three as a value of k. This yields to 1374 IBP GO terms related to 332 human proteins
which are also identified as high-confidence SARS-CoV-2 Human PPI detected by Gordon et al.3 We also use
all drugs and their targets reported in the UniProt website https://www.uniprot.org30 to evaluate our candidate
sets as drug targets. This dataset contains 3064 proteins targets in our network. In addition, we use two groups
of drugs related to COVID-19 reported in https://www.drugbank.ca website19.
Scientific Reports | (2021) 11:9378 | https://doi.org/10.1038/s41598-021-88427-w 12
Vol:.(1234567890)www.nature.com/scientificreports/
Term No. gene P-value FDR
Annotation cluster 1 (Enrichment score: 9.739)
hsa05142:Chagas disease (American trypanosomiasis) 18 1.15E−16 1.23E−14
hsa05144:Malaria 14 7.52E−16 2.68E−14
hsa05323:Rheumatoid arthritis 15 1.17E−13 2.09E−12
hsa05164:Influenza A 18 7.98E−13 1.22E−11
hsa05321:Inflammatory bowel disease (IBD) 13 1.00E−12 1.34E−11
hsa04620:Toll-like receptor signaling pathway 15 1.68E−12 1.99E−11
hsa05146:Amoebiasis 14 2.99E−11 2.28E−10
hsa05140:Leishmaniasis 12 8.49E−11 5.68E−10
hsa05152:Tuberculosis 16 1.67E−10 9.90E−10
hsa05134:Legionellosis 10 2.55E−09 1.30E−08
hsa05145:Toxoplasmosis 12 1.04E−08 4.82E−08
hsa04064:NF-kappa B signaling pathway 11 1.32E−08 5.89E−08
hsa04621:NOD-like receptor signaling pathway 9 7.35E−08 3.03E−07
hsa05133:Pertussis 9 7.49E−07 2.59E−06
hsa05132:Salmonella infection 9 1.64E−06 4.88E−06
h_nthiPathway:NFkB activation by Nontypeable hemophilus influenzae 5 0.008042 0.129753
Annotation cluster 2 (Enrichment score: 4.639)
hsa04621:NOD-like receptor signaling pathway 9 7.35E−08 3.03E−07
hsa05020:Prion diseases 5 3.62E−04 6.06E−04
hsa04623:Cytosolic DNA-sensing pathway 6 4.52E−04 7.22E−04
Annotation cluster 3 (Enrichment score: 3.278)
hsa04060:Cytokine–cytokine receptor interaction 19 1.76E−11 1.57E−10
h_cytokinePathway:Cytokine Network 10 1.25E−08 2.12E−06
hsa04940:Type I diabetes mellitus 8 1.69E−07 6.47E−07
h_inflamPathway:Cytokines and inflammatory response 10 2.09E−07 1.77E−05
hsa05332:Graft-versus-host disease 7 7.97E−07 2.66E−06
hsa05330:Allograft rejection 7 1.62E−06 4.88E−06
hsa04630:Jak-STAT signaling pathway 10 1.40E−05 3.55E−05
22.CytokinE−chemokine_CNS 7 3.54E−05 0.001257
hsa04672:Intestinal immune network for IgA production 6 1.04E−04 2.18E−04
Table 8. Some of the significantly enriched pathways that are related to COVID-19 essential proteins ( E2).
Algorithms for finding the essential proteins. Essential proteins perform a broad range of important
functions in the biological network. Therefore, removing the minimum number of these essential proteins can
have the highest impact on disrupting the biological activity of c ells31. We proposed two different algorithms
in previous works15, 16 for identifying the mentioned essential proteins. In this work, we modify the previous
algorithms to find the essential proteins in the network that was created from a set of virus targets (332 proteins
reported as possible targets of the SARS-CoV-2 virus3) and a set of processes associated with these proteins.
For this purpose, we use biological information to build our network. Previous studies show that SARS-CoV-2
infects the human cells by generating 29 viral proteins that bind to different human proteins. Gorden et al.3
reveal 26 proteins from these 29 proteins and used affinity purification with the help of mass spectrometry lead-
ing to the identification of 332 human proteins involved in these viral proteins binds.
In the following section, we describe the details of algorithms 1 and 2. We explain the different parts of each
algorithm in two separate sections. In both algorithms, the construction of the biological network is the same and
is as follows: a biological network is considered as a weighted undirected graph G = (V , E, ω), where each node
vi ∈ V represents a protein. Two proteins vi and vj are connected with an edge eij ∈ E if they participate in the
same biological process. The ω(eij ) represents the weight of eij which illustrates the number of biological processes
that two proteins vi and vj participate in it. The degree of node vi shows the number of edges incident to this node.
Algorithm 1: betweenness value. In this algorithm, we try to impose maximum disruption to the network by
selecting the least number of essential proteins with respect to the value called betweenness. For this purpose,
we define the path and betweenness in the following. A path between two nodes in the graph is a sequence of
edges that connect the number of distinct nodes through this path. In the weighted graph, the weight of the path
is obtained from the sum of the weight of edges in this path, and the shortest path between two nodes is defined
as a path with minimum weight. Having considered that, we can define the betweenness value for each node, vi
, in the following way:
Scientific Reports | (2021) 11:9378 | https://doi.org/10.1038/s41598-021-88427-w 13
Vol.:(0123456789)www.nature.com/scientificreports/
χejk vi
Bet w(vi ) = (1)
vj ,vk ∈V
χejk
where χejk is the total number of shortest paths from node vj to node vk and χejk vi is the number of shortest paths
that pass through vi . Algorithm 1 consists of three phases. In the first phase, the weighted graph is constructed as
mentioned earlier. Then, the betweenness value for each node in the network is calculated. In the second phase,
the input graph is partitioned into two disjointed parts. For this purpose, the node with minimum betweenness
value is chosen as a candidate to put into a partition. Then, from all of the neighbors of this node, the node
with the least betweenness value is selected and placed in the other partition, respectively. We continue this
procedure recursively until all nodes are put into two nearly equal size partitions. In the third phase, we should
select the minimum number of nodes for which their removal would destroy all crossing the edges between the
two partitions. For this purpose, we select the nodes that are connected as the endpoints of the crossing edges
between two parts with respect to their betweenness value. This phase is continued until the connected network
is broken apart into two disjointed partitions. The third phase is equivalent to the minimum bi-section problem,
which is a NP-complete problem32.
Algorithm 2: spectral partitioning. The Problem of partitioning a simple graph G into two balance or nearly
balance partitions while minimizing the number of edges between these two parts (cut edge) is known as the
NP-complete problem33 . Therefore, we approximate this balanced partitioning with the spectral bi-partition-
ing algorithm. This algorithm is based on eigenvectors of Laplace of the graph and divides the graph by two
with respect to eigenvectors of a Laplacian matrix. Spectral partitioning is one of the most successful heuristic
approaches in graph partition algorithms. Let A = [aij ] shows the adjacency matrix of G such that,
1 if (vi , vj ) ∈ E
aij =
0 otherwise
, (2)
We define a matrix D = diag(di ) as a diagonal degree matrix of G, in this matrix a d(vi ) shows the degree of
vi which is the number of edges incident to node vi . Now, we consider the Laplacian matrix of the graph G by
L = D\A and L(G) = [lij ] where,
1 if (vi , vj ) ∈ E
lij = d(vi ) if i = j . (3)
0 otherwise
The Laplacian matrix is a symmetric positive semi-definite matrix with some important properties. Let
u = (u1 , u2 , ..., un ) be the normalized eigenvectors of matrix L(G) and ( 1 , 2 , . . . , n ) be the corresponding
eigenvalues of these eigenvectors. Then, the u is that pairwise orthogonal. If the graph G is a connected one, then
= 1 is the only zero eigenvalue of L 33.
Here we compute the eigenvectors of Laplacian matrix L(G), according to the second smallest eigenvalue of
this matrix 2 and put them in vector X = (x1 , . . . , xn ). Next, we sort the elements of X and insert half of the
nodes according to these elements in partition G1 and the reminder of nodes in another partition G2. The edges
which cross these two partitions are the edge cut of our proposed graph G. The above procedure divides the nodes
of graph G into two partitions G1 and G2 with nearly equal sizes and a set of cut edges E(G1 , G2 ) which connects
these two partitions. We should disconnect these two partitions through these cut edges.
The remainder of the algorithm finding the vertex cut or a subset C from set V which has the following
properties: (1) the set C is as small as possible; (2) the removal of C partitions graph G into two partitions G1 \C
and G2 \C such that the ratio |G1 \C|/|G2 \C|, which shows the difference of the size of two subgraphs is as close
to 1 as possible; and (3) for each cut edge eij ∈ E(G1 \C, G2 \C), vi ∈ G1 \C and vj ∈ G2 \C . To find the vertex
cut set C, suppose M = {e1 = α1 β1 , . . . , em = αm βm } is the set of edges in cut edge E(G1 , G2 ) that found by the
above mentioned algorithm. We construct the bipartite graph H that containing two partitions G1 \C and G2 \C ,
with above procedure. Also, we consider each of the cut edges between two partitions G1 and G2 are having one
endpoint in each part. For example, suppose that the A = {α1 , . . . , αm } is placed in G1 and B = {β1 , . . . , βm } is
placed in G2, respectively. Then, we choose vertices from A and B with respect to their degrees repeatedly until
the all the edges in C are removed.
Code availability
Datasets and the codes of the algorithms are available in our github repository (https://g ithub.c om/r osaag hdam/
Drug-Target).
Received: 24 August 2020; Accepted: 12 April 2021
References
1. Pushpakom, S. et al. Drug repurposing: Progress, challenges and recommendations. Nat. Rev. Drug Discov. 18, 41–58 (2019).
2. Fehr, A. R. & Perlman, S. Coronaviruses: An overview of their replication and pathogenesis. Coronaviruses 1282, 1–23 (2015).
3. Gordon, D. E. et al. A sars-cov-2 protein interaction map reveals targets for drug repurposing. Nature 583, 459–468 (2020).
4. Saha, A. et al. Probable molecular mechanism of remdesivir for the treatment of covid-19: Need to know more. Arch. Med. Res.
51, 585–586 (2020).
Scientific Reports | (2021) 11:9378 | https://doi.org/10.1038/s41598-021-88427-w 14
Vol:.(1234567890)www.nature.com/scientificreports/
5. Patel, J. C. et al. Identification of pulmonary comorbid diseases network based repurposing effective drugs for covid-19. Sci. Rep.
(2020).
6. Saha, R. P. et al. Repurposing drugs, ongoing vaccine and new therapeutic development initiatives against covid-19. Front. Phar-
macol. 11, 1258 (2020).
7. Uetz, P. et al. A comprehensive analysis of protein–protein interactions in saccharomyces cerevisiae. Nature 403, 623–627 (2000).
8. Ho, Y. et al. Systematic identification of protein complexes in Saccharomyces cerevisiae by mass spectrometry. Nature 415, 180–183
(2002).
9. Gavin, A.-C. et al. Proteome survey reveals modularity of the yeast cell machinery. Nature 440, 631–636 (2006).
10. Melak, T. & Gakkhar, S. Comparative genome and network centrality analysis to identify drug targets of Mycobacterium tuberculosis
h37rv. BioMed. Res. Int. 2015, 1–10 (2015).
11. Barabási, A.-L., Gulbahce, N. & Loscalzo, J. Network medicine: A network-based approach to human disease. Nat. Rev. Genet. 12,
56–68 (2011).
12. Jeong, H., Mason, S. P., Barabási, A.-L. & Oltvai, Z. N. Lethality and centrality in protein networks. Nature 411, 41–42 (2001).
13. Hahn, M. W. & Kern, A. D. Comparative genomics of centrality and essentiality in three eukaryotic protein-interaction networks.
Mol. Biol. Evol. 22, 803–806 (2005).
14. Chen, Y., Jacquemin, T., Zhang, S. & Jiang, R. Prioritizing protein complexes implicated in human diseases by network optimiza-
tion. BMC Syst. Biol. 8, 1–10 (2014).
15. Taheri, G., Habibi, M., Wong, L. & Eslahchi, C. Disruption of protein complexes. J. Bioinform. Comput. Biol. 11, 1341008 (2013).
16. Habibi, M. & Khosravi, P. Disruption of the protein complexes from weighted complex networks. IEEE/ACM Trans. Comput. Biol.
Bioinform. 17, 102–109 (2018).
17. Ontology, G. The gene ontology resource: 20 years and still going strong. Nucleic Acids Res. 47, D330–D338 (2019).
18. Aghdam, R., Ganjali, M., Zhang, X. & Eslahchi, C. CN: A consensus algorithm for inferring gene regulatory networks using the
sorder algorithm and conditional mutual information test. Mol. BioSyst. 11, 942–949 (2015).
19. Wishart, D. S. et al. Drugbank 5.0: A major update to the drugbank database for 2018. Nucleic Acids Res. 46, D1074–D1082 (2018).
20. Dolan, M. E. et al. Investigation of covid-19 comorbidities reveals genes and pathways coincident with the sars-cov-2 viral disease.
Sci. Rep. 10, 1–11 (2020).
21. Martorana, A., Gentile, C. & Lauria, A. In silico insights into the sars cov-2 main protease suggest nadh endogenous defences in
the control of the pandemic coronavirus infection. Viruses 12, 805 (2020).
22. Kalil, A. C. et al. Baricitinib plus remdesivir for hospitalized adults with covid-19. New Engl. J. Med. 1, 795 (2020).
23. Oh, K. K., Adnan, M. & Cho, D. H. Sars-cov-2 intervened by nsaids: A network pharmacology approach to decipher signaling
pathway and interactive genes. Res. Sq. https://doi.org/10.21203/rs.3.rs-111615/v1 (2020).
24. Kim, M. & Kim, Y. B. In silico synergistic drug repurposing for combating novel coronavirus (covid-19) outbreaks. Res. Sq. 1–12
(2020).
25. Luck, K. et al. A reference map of the human binary protein interactome. Nature 580, 402–408 (2020).
26. Chatr-Aryamontri, A. et al. The biogrid interaction database: 2017 update. Nucleic Acids Res. 45, D369–D379 (2017).
27. Alanis-Lobato, G., Andrade-Navarro, M. A. & Schaefer, M. H. Hippie v2.0: Enhancing meaningfulness and reliability of protein-
protein interaction networks. Nucleic Acids Res. 45, D408–D414 (2016).
28. Alonso-López, D. et al. Apid database: Redefining protein–protein interaction experimental evidences and binary interactomes.
Database 2019, 1–10 (2019).
29. Das, J. & Yu, H. Hint: High-quality protein interactomes and their applications in understanding human disease. BMC Syst. Biol.
6, 92 (2012).
30. Consortium, U. Uniprot: A worldwide hub of protein knowledge. Nucleic Acids Res. 47, D506–D515 (2019).
31. Vanunu, O., Magger, O., Ruppin, E., Shlomi, T. & Sharan, R. Associating genes and protein complexes with disease via network
propagation. PLoS Comput. Biol. 6, e1000641 (2010).
32. Gawiejnowicz, S. mathcal np-complete problems. In Models and Algorithms of Time-Dependent Scheduling 35–44 (Springer, 2020).
33. Taheri, G., Khonsari, A., Entezari-Maleki, R. & Sousa, L. A hybrid algorithm for task scheduling on heterogeneous multiprocessor
embedded systems. Appl. Soft Comput. 91, 106202 (2020).
Author contributions
MH and G.T. developed the methods. M.H., G.T. and R.A. performed computational and statistical analysis.
M.H., G.T. and R.A. design and wrote the paper. G.T. and R.A. contributed in writing and editing the manuscript.
All authors read and approved the final manuscript. All authors contributed equally to this work.
Competing interests
The authors declare no competing interests.
Additional information
Correspondence and requests for materials should be addressed to M.H.
Reprints and permissions information is available at www.nature.com/reprints.
Publisher’s note Springer Nature remains neutral with regard to jurisdictional claims in published maps and
institutional affiliations.
Open Access This article is licensed under a Creative Commons Attribution 4.0 International
License, which permits use, sharing, adaptation, distribution and reproduction in any medium or
format, as long as you give appropriate credit to the original author(s) and the source, provide a link to the
Creative Commons licence, and indicate if changes were made. The images or other third party material in this
article are included in the article’s Creative Commons licence, unless indicated otherwise in a credit line to the
material. If material is not included in the article’s Creative Commons licence and your intended use is not
permitted by statutory regulation or exceeds the permitted use, you will need to obtain permission directly from
the copyright holder. To view a copy of this licence, visit http://creativecommons.org/licenses/by/4.0/.
© The Author(s) 2021
Scientific Reports | (2021) 11:9378 | https://doi.org/10.1038/s41598-021-88427-w 15
Vol.:(0123456789)You can also read