Modeling, Control, and Prediction of the Spread of COVID-19 Using Compartmental, Logistic, and Gauss Models: A Case Study in Iraq and Egypt - MDPI
←
→
Page content transcription
If your browser does not render page correctly, please read the page content below
processes
Article
Modeling, Control, and Prediction of the Spread of
COVID-19 Using Compartmental, Logistic, and Gauss
Models: A Case Study in Iraq and Egypt
Mahmoud A. Ibrahim 1,2, *,†            and Amenah Al-Najafi 1,†
 1    Bolyai Institute, University of Szeged, Aradi vértanúk tere 1., H-6720 Szeged, Hungary;
      amenah@math.u-szeged.hu
 2    Department of Mathematics, Faculty of Science, Mansoura University, Mansoura 35516, Egypt
 *    Correspondence: mibrahim@math.u-szeged.hu
 †    These authors contributed equally to this work.

 Received: 13 October 2020; Accepted: 30 October 2020; Published: 2 November 2020

 Abstract: In this paper, we study and investigate the spread of the coronavirus disease 2019
 (COVID-19) in Iraq and Egypt by using compartmental, logistic regression, and Gaussian models.
 We developed a generalized SEIR model for the spread of COVID-19, taking into account mildly and
 symptomatically infected individuals. The logistic and Gaussian models were utilized to forecast
 and predict the numbers of confirmed cases in both countries. We estimated the parameters that
 best fit the incidence data. The results provide discouraging forecasts for Iraq from 22 February
 to 8 October 2020 and for Egypt from 15 February to 8 October 2020. To provide a forecast of the
 spread of COVID-19 in Iraq, we present various simulation scenarios for the expected peak and its
 timing using Gaussian and logistic regression models, where the predicted cases showed a reasonable
 agreement with the officially reported cases. We apply our compartmental model with a time-periodic
 transmission rate to predict the possible start of the second wave of the COVID-19 epidemic in Egypt
 and the possible control measures. Our sensitivity analyses of the basic reproduction number allow us
 to conclude that the most effective way to prevent COVID-19 cases is by decreasing the transmission
 rate. The findings of this study could therefore assist Iraqi and Egyptian officials to intervene with
 the appropriate safety measures to cope with the increase of COVID-19 cases.

 Keywords: COVID-19; compartmental model; logistic growth model; Gaussian model; parameter
 estimation; second wave; sensitivity analysis; control measures

1. Introduction

1.1. Background
     The coronavirus disease 2019 (COVID-19) is an emerging public health problem affecting countries
around the world, including Iraq and Egypt, and is caused by the severe acute respiratory syndrome
Coronavirus 2 (SARS-CoV-2) [1,2]. The disease spreads from individual to individual, most often
when physically nearby, but also over long distances, notably indoors [3,4]. The most common
symptoms are fever, fatigue, loss of smell, loss of appetite, muscle pain, dry cough, shortness of
breath, and coughing up sputum [5,6]. COVID-19 was discovered in Iraq, and the first coronavirus
infection was confirmed in an Iranian student in the city of Najaf on 22 February 2020. A family who
had recently returned from Iran tested positive for COVID-19 in the city of Kirkuk near Baghdad
on 25 February 2020. The first death of a 70-year-old clergyman was confirmed on 4 March in
the city of Sulaimaniyah. The disease spread from 27 March onwards in all 19 Iraqi Governorates.
As the infections have been steadily increasing since mid-March 2020, the Iraqi government has taken

Processes 2020, 8, 1400; doi:10.3390/pr8111400                              www.mdpi.com/journal/processes
Processes 2020, 8, 1400 2 of 16
the following measures: a national complete or partial lockdown, curfew, and travel restrictions.
Schools, universities, and cinemas in Baghdad were closed, and other large public and religious
gatherings were banned in the cities. The Iraqi Ministry of Health announced a nationwide total
lockdown, which began on 30 July, except in the region of Kurdistan. The high number of reported
cases has led us to study the spread of COVID-19 in Iraq.
Egypt launched its prevention precautions for the fatal virus when it appeared in Wuhan, China.
All flights from China to Egypt were suspended on 26 January 2020. The first recorded case was
reported on 14 February 2020 in a Chinese man in Egypt. The patient was taken to a quarantine station.
The first death of an Egyptian person due to COVID-19 was registered on 20 March 2020, twenty days
after the first death was reported in Egypt (for a German man). The Egyptian government has
introduced various types of lockdowns to mitigate the effects of the disease. Both schools/universities
and places of worship were closed from 7 March and 21 March, respectively. The peak of COVID-19
occurred in Egypt on 19 June 2020, followed by a significant decrease of the number of cases.
Egypt reopened its tourism borders for seaside resorts from 1 July. From 1 September, travelers from
all countries traveling to any part of Egypt must have confirmation of a negative polymerase chain
reaction (PCR) test certificate for COVID-19 completed no more than 72 h before arrival.
1.2. Literature Review
A variety of studies have been published to evaluate the epidemiological features of COVID-19
and to mitigate its effects on public health. Tosepu et al. [7] studied the correlation between weather
and the COVID-19 pandemic in Jakarta, Indonesia. Batista [8] utilized the logistic growth model
to evaluate the final size and peak of the coronavirus epidemic in China, South Korea, and the rest
of the world. In [9], a computational tool was established to assess the risks of novel coronavirus
outbreaks outside China. Based on the confirmed data, Abdullah et al. [10] proposed a forecast of the
size of the COVID-19 epidemic in Kuwait; deterministic and stochastic modeling approaches were used.
A study to forecast the peak of the COVID-19 epidemic in Japan using the traditional SEIR model was
conducted by Kuniya [11]. Röst et al. [12] proposed an epidemiological and statistical study of the early
phase of the COVID-19 outbreak in Hungary and developed an age-structured compartmental model
to investigate alternate post-lockdown scenarios. In [13], the authors developed an exponentiated
M family of continuous distributions to provide new statistical models. Several researchers have
studied COVID-19 in Iraq (see, e.g., [14–16]). Using several regression models, Amar et al. [17] studied
the actual COVID-19 database for Egypt from 15 February to 15 June 2020 to predict the number
of COVID-19-infected patients and measured the final epidemic scale. Hasab et al. [18] studied the
epidemiological distribution and modeling of the novel coronavirus (COVID-19) epidemic in Egypt
using the epidemic SIR model. In [19], the SEIR compartmental model was used to identify the
situation of COVID-19 in Egypt and to forecast the expected time of the peak of this epidemic based
on the actual reported cases and deaths. The research proposed by El Desouky [20] to predict the time
of the possible peak and to model the changes induced by the social behavior of Egyptians during
Ramadan (Holy Month) used SIR and SEIR compartment models. Several researchers have studied
COVID-19 in Egypt (see, e.g., [21–24]).
1.3. Summary
In this work, we study the prevalence of the COVID-19 outbreak in Iraq and Egypt using
a compartmental mathematical model, a logistic regression model, and a simple Gaussian model.
To better understand the spread of the virus, we estimate the parameters that provide the best fit
to the incidence data from both countries. The parameters with the best fit can be used to calculate
the basic reproduction rate. In order to forecast the spread of COVID-19 in Iraq, we show different
simulation scenarios for the possible peak and its timing using Gaussian and logistic regression models.
Using a generalized SEIR model (our compartmental model) with a time-periodic transmission rate,
we predict the possible start of the second wave of COVID-19 in Egypt and the possible control measures.Processes 2020, 8, 1400 3 of 16
We derive a formula for the basic reproduction number, which can be used to obtain the contour plots
and sensitivity analysis to show the possible measures for controlling the disease. The article is
organized as follows. Section 2 describes the materials and methods. The results are given in Section 3.
Section 4 presents the discussion.
2. Materials and Methods
2.1. COVID-19 Data from Iraq and Egypt
The data were collected from Worldometer website [25,26]. We focus on the data from 22 February
to 8 October 2020 in Iraq and from 15 February to 8 October 2020 in Egypt.
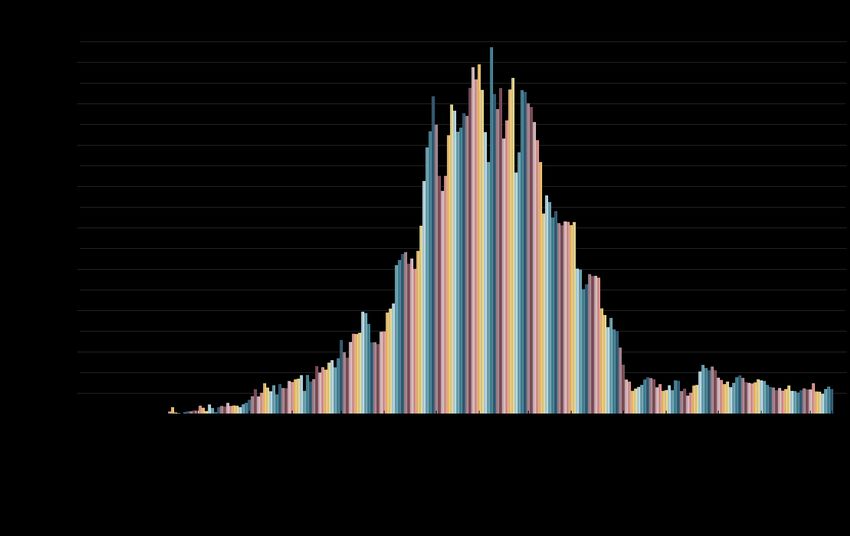
Figure 1 shows the daily confirmed cases in Iraq and Egypt since the beginning of the pandemic
in Iraq and Egypt, respectively, until 8 October 2020. The statistics of the data are shown in Table 1.
(a) Iraq
(b) Egypt
Figure 1. The daily number of confirmed cases in (a) Iraq from 22 February to 8 October 2020 and in
(b) Egypt from 15 February to 8 Octobe,r 2020.Processes 2020, 8, 1400 4 of 16
Table 1. Statistics for the coronavirus disease 2019 (COVID-19) data from Iraq and Egypt.
Iraq Egypt
Total Sample Size = 231 Total Sample Size = 238
Descriptive Statistics 22 February 2020 15 February 2020
Cumulative Cases Cumulative Cases
Min 1 1
Max 394,566 104,156
Median 22,008 41, 303
Mean 92,023 48,004
Standard error 119,256.6 42,988.4
2.2. Compartmental Model for COVID-19 Transmission
We spilt the human population into seven compartments: susceptible S(t), exposed E(t),
symptomatically infected Is (t), mildly infected Im (t), treated H (t), and recovered individuals R(t);
and D (t) indicates the individuals who lost their lives due to COVID-19. The total size of the population
at any time t is given by
N (t) = S(t) + E(t) + Im (t) + Is (t) + H (t) + R(t) + D (t).
We do not add separate compartments for the quarantined individuals to keep our model simple.
Susceptible people (S) are those who can be infected by COVID-19. Once having contracted the
disease, an individual progresses to the exposed class (E); these individuals do not yet have symptoms.
After the incubation period, exposed individuals move to either the symptomatically infected class (Is )
or the mildly infected class (Im ), depending on whether the individual shows symptoms or not.
Mildly infected individuals progress to the recovered class (R) or the symptomatically infected class (Is ).
Symptomatically infected individuals move to the treated compartment (H), which includes those
who have reported hospitalization. After the infection period, treated persons change to the recovered
class (R).
The transmission dynamics are shown in the flow diagram (see Figure 2), and our model takes
the form:
β e E(t) + β m Im (t) + Is (t) + β h H (t)
S0 (t) = − β S ( t ),
N (t) − D (t)
β e E(t) + β m Im (t) + Is (t) + β h H (t)
E0 (t) = β S(t) − νE(t),
N (t) − D (t)
0
Im (t) = θνE(t) − σm Im (t) − σIm (t), (1)
Is0 (t) = (1 − θ )νE(t) + σIm (t) − σs Is (t) − δs Is (t),
H 0 (t) = σs Is (t) − σh H (t) − δh H (t),
R0 (t) = σm Im (t) + σh H (t),
D 0 (t) = δs Is (t) + δh H (t).
The description of the model parameters is summarized in Table 2. Particularly, β stands for the
transmission rate from symptomatically infected to susceptible persons, while the transmission rates
from exposed, mildly infected, and treated to susceptible are obtained by multiplying β by β e , β m ,
and β h , respectively. The parameter θ is the fraction of asymptomatically infected persons among all
infected people. The length of the latent period for humans is 1/ν. 1/σm and 1/σh denote the length of
the infection period for mildly and symptomatically infected people, respectively; 1/σ is the length of
the period during which patients progress from mildly to severely infected.Processes 2020, 8, 1400 5 of 16
Im
S E Is H R
D
Figure 2. Diagram of COVID-19 transmission. Blue arrows indicate transition from one compartment to
another. Light- and dark-colored nodes depict the non-infected and infected compartments, respectively.
Table 2. Description of the parameters of model (1).
Parameters Description
β Transmission rate from infectious classes to susceptible
βe , βm , βh The relative transmissibility of E, Im , and H, respectively
θ Proportion of asymptomatic infections
σ Progression rate from Im to Is
σs Progression rate from Is to H
σm , σh Recovery rates
δs , δh Disease-induced death rates
ν Incubation rate
2.3. Logistic Growth Model
The logistic growth model in mathematical epidemiology is a regression model frequently used
to estimate the growth of a population as exponential, and is then followed by a reduction in growth,
with a bound provided by a carrying capacity. Logistic population growth occurs when the rate of
population growth decreases as the number of individuals increases. The logistic model introduced
in [8,27] takes the form:
C
C 0 = rC 1 − , (2)
K
where C denotes the accumulated number of cases, r > 0 is the rate of infection, and K > 0 is the final
epidemic size. The number of infected cases is defined as the solution of (2) and is given by
K
C= , (3)
1 + be−rt
K −C0
where b = C0 and C0 is the initial population. The parameters r and K can be estimated from the
ln(b)
data of the epidemic. The maximum growth rate peaks can be estimated at the time t p = r , and the
number of cases at this time is C p = K2 . Thus, the growth rate at the maximum peak is given by
dC rK
= .
dt p 4
2.4. Gaussian Model
To model the time-dependent daily change of infections, we employ a simple Gaussian model.
Let I (t) denote the time-dependent Gaussian function [28,29] and take the following form:
t−µ
2
−
I (t) = I0 e σ , (4)
where I0 denotes the maximum value at time µ and σ controls the width. The model is characterized
by three independent parameters: a variance, a maximum height, and a time of maximum height
(peak date). Despite its simplicity, the Gaussian model has significant predictive power. We use it
to predict the peak number of infected people and the peak date. In addition, a numerical studyProcesses 2020, 8, 1400 6 of 16
has explained that the Gaussian model is a special version of the SEIR model. The introduction of
gradual social distancing leads to a linear decrease in the infection rate [30]. In the Gaussian model,
epidemics are initially exponential; later, as the population approaches carrying capacity, they approach
zero, resulting in bell-shaped daily quantities. This starts at zero, approaches a maximum somewhere,
and finally drops back to zero.
The assumption behind the logistical growth is that people have an equal chance of infection.
Initially, growth is exponential, but the rate of growth decreases and becomes very low with the
maximum infectious population. Some may contend that the growth rate should decrease with
increasing time; the behavior of Gaussian model and the logistic model have, therefore, very similar
2
results: The Gaussian function converges quickly to zero, like the function e− x , while the logistic
function is simply the exponential in this aspect e x , and the logistic growth model is often used to
determine the future total epidemic size of the variable.
2.5. Parameter Estimation and Sensitivity
To estimate the parameters of the logistic growth model (2) and the Gaussian model (4), which give
the best fit to the epidemic data, we employ the nonlinear least-square curve, which we fit to the
incidence curve given by the equations of C 0 (t) and I (t), respectively. As in the first observation,
the initial number of C0 cases was determined. The parameters of the model (1) that gives the best
fit to the data can be estimated by using Latin Hypercube Sampling. This is a sampling method that
measures the variation of several parameter values simultaneously (see [31] for details). The core idea
of the method is to create a representative sample from the ranges for all parameters listed in Table 3.
The solutions of the model (1) are calculated (numerically) for each element of this sample set. Finally,
we apply the least-squares method to find the parameters that provide the best fit.
To identify the parameters with respect to their effects on the basic reproduction number, we will
apply partial rank correlation coefficient analysis (PRCC; see, e.g., [32]) to perform sensitivity analysis.
The PRCC-based sensitivity analysis measures the effects of the parameters on the basic reproduction
number while we change the parameters in the given ranges.
2.6. Reproduction Numbers
The basic reproduction number R0 is an important threshold parameter for estimating the effort
required to eliminate the contagious diseases, and it is perceived as the expected number of secondary
infections produced by an infected individual in a population where all individuals are susceptible
to infection.
By using the next generation method introduced in [33], we derive a formula for the basic
reproduction number of (1). Then, taking into account the infection states E, Im , Is , and H in (1) and
by substituting the values in the disease-free equilibrium ( N, 0, 0, 0, 0, 0, 0), the matrices F and V are
calculated for the new infection terms and the remaining transfer terms. The Jacobian F and V are
given by
ββ e ββ m β ββ h ν 0 0 0
−θν σm + σ
0 0 0 0 0 0
F= and V = .
0 0 0 0 −(1 − θ )ν 0 σs + δs − σ 0
0 0 0 0 0 0 −σs σh + δh
As per [33], the basic reproduction number is the largest absolute eigenvalue of FV −1 ; thus,
it is given by
ββ e θββ m β(σ + (1 − θ )σm ) ββ h σs (σ + (1 − θ )σm )
R0 = ρ( FV −1 ) = + + + . (5)
ν (σ + σm ) (σ + σm )(σs + δs ) (σ + σm )(σs + δs )(σh + δh )Processes 2020, 8, 1400 7 of 16
In addition to calculating the basic reproduction number R0 of the model (1), the time-dependent
reproduction number can be calculated from incidence data (see, e.g., [34] for details).
3. Results
3.1. Parameter Estimation for Iraq and Egypt
Using the method described in Section 2.5, we fitted our model to symptomatically infected cases
in Iraq and Egypt.
Figure 3 shows the model (1) fitted to the daily number of confirmed cases in Iraq from 22 February
to 8 October 2020 (left panel), and in Egypt, from 5 March to 8 October 2020 (right panel). Our model
yields a reasonably good fit for both countries by predicting the peak in Iraq and showing the peak in
Egypt. The fitting parameter results are listed in Table 3.
22/02/2020 15/06/2020 15/10/2020 15/02/2020 15/06/2020 01/04/2020 01/07/2020 01/10/2020
5000
Daily cases Daily cases
Number of confirmed cases in Egypt
Number of confirmed cases in Iraq
Model fitting result
1500 Model fitting result
4000
3000
1000
2000
500
1000
0
0
01/03/2020 01/07/2020 01/11/2020 01/03/2021 05/03/2020 01/06/2020 01/09/2020 01/12/2020
Iraq Egypt
Figure 3. The model (1) fitted to the daily confirmed cases in (left panel) Iraq and in (right panel)
Egypt with the parameters given in Table 3.
Table 3. Parameters and fitted values of model (1) in the cases of Iraq and Egypt.
Value for Iraq Value for Egypt
Parameters Source
R0 = 1.323 R0 = 1.11
β 0.753 0.56 Fitted
βe 0.082 0.053 Fitted
βm 0.475 0.587 Fitted
βh 0.2057 0.443 Fitted
θ 0.778 0.875 Fitted
σ 0.307 0.104 Fitted
σs 0.3247 0.213 Fitted
σm 0.239 0.661 Fitted
σh 0.446 0.508 Fitted
δs 0.127 0.131 Fitted
δh 0.298 0.268 Fitted
ν 0.54 0.266 Fitted
3.2. Forecast of the Spread of COVID-19 in Iraq and Egypt
To fit the confirmed cumulative cases in both countries from the beginning of the outbreak on
22 February and 15 February, 2020, respectively, until 8 October, 2020, we applied the logistic model (2),
which was used to predict the short-term forecast.
Figure 4 shows the logistic growth model (2) fitted to the cumulative number of infected cases
in Iraq (left panel) and the cumulative number of infected cases in Egypt (right panel) with the
parameters given in Table 4. We note that the logistic model fit the incidence data with a root mean
square error (RMSE) of 5229.7 and R2 of 0.9981 for the Iraqi data and with an RMSE of 1, 924.4 and R2Processes 2020, 8, 1400 8 of 16
of 0.9980 for the Egyptian data, as shown in Table 4. The logistic model gives a reasonably good fit for
both countries.
#105 #104
Cumulative confirmed cases in Egypt
Cumulative confirmed cases in Iraq
5
10
4
8
3
6
2 4
Data Data
Fitting results Fitting results
1 2
95% C.I 95% C.I
0 0
22/02/2020 22/06/2020 22/10/2020 22/02/2020 22/06/2021 15/02/2020 15/05/2020 15/08/2020 15/11/2020 15/02/2021
Iraq Egypt
Figure 4. The logistic model (2) fitted to the cumulative number of infected cases in Iraq (left panel)
and in Egypt (right panel).
Table 4. Estimated parameter results of the logistic model (2) for Iraq and Egypt.
Iraq Egypt
Parameters
R0 = 1.0659 C.I R0 = 1.0318 C.I
Estimated epidemic size (cumulative cases) 490, 900 (478, 300, 503, 500) 105, 000 (104, 500, 105, 900)
Estimated start of ending phase date 05/05/2021 04/11/2020
Goodness of fit (R2 ) 0.9981 0.9980
Root Mean Square Error (RMSE) 5229.7 1924.4
The Gaussian model was fitted to data from Iraq and Egypt with reproduction numbers 1.0659
and 1.0318, respectively. Figure 5 shows the Gaussian model fitted to the daily number of confirmed
cases from Iraq (left panel) and to the daily number of confirmed cases from Egypt (right panel) with
the parameters given in Table 5. The model fits the actual data well with a root mean square error
(RMSE) of 335.607 and R2 of 0.9614 for the Iraqi data and with an RMSE of 110.33 and R2 of 0.9528 for
the Egyptian data, as listed in Table 5.
2000
Number of confirmed cases in Egypt
5000
Number of confirmed cases in Iraq
Daily cases Daily cases
Fitting results Fitting results
4000 1500
95% C.I 95% C.I
3000
1000
2000
500
1000
0 0
22/02/2020 22/05/2020 22/08/2020 22/11/2020 22/02/2021 15/02/2020 15/04/2020 15/06/2020 15/08/2020 15/10/2021
Iraq Egypt
Figure 5. The Gaussian model fitted to the daily confirmed cases in Iraq (left panel) and in Egypt
(right panel).Processes 2020, 8, 1400 9 of 16
Table 5. Estimated parameter results of the Gaussian model for Iraq and Egypt.
Iraq Egypt
Parameters
R0 = 1.0659 C.I R0 = 1.0318 C.I
Estimated peak day cases 4254 (4161, 4347) 1534 (1493, 1574)
Estimated peak date 14/09/2020 16/06/2020
Goodness of fit (R2 ) 0.9614 0.9528
Root Mean Square Error (RMSE) 335.607 110.33
The peak of COVID-19 in Egypt occurred on 16 June 2020 with 1534 daily cases. Afterward,
the number of daily confirmed cases gradually decreased, and the estimated epidemic size was 105,000
on 4 November 2020. In the coming days in Iraq, the forecast curve shows a significant increase in
the estimated size of the epidemic to 490,900. It also shows that the scale of the epidemic is increasing
rapidly, indicating that the number of infections continues to rise steadily.
3.3. Prediction of the Spread of the COVID-19 Epidemic in Iraq
It is expected that the daily confirmed cases through Ziarat, the holy shrines in Iraq from different
countries, will increase significantly. To predict the spread of COVID-19 in Iraq, we apply the Gaussian
model (4) to estimate the value and timing of the expected peak. The logistic model was used to
estimate the growth rate at each point in time of the expected peak.
Figure 6 shows the three different scenarios of COVID-19 in Iraq, as well as the daily and
commutatively confirmed cases, with three expected maximum values at the peak times. The results
illustrate that the highest predicted number cumulative cases is estimated at 650,000 with 6500 daily
cases, and this would occur on 17 November 2020, while the peak times of scenario one and scenario
two are expected to occur on 10 October 2020 and 5 November 2020, respectively. The parameters
used to obtain each scenario are listed in Tables 6 and 7.
A short-term forecast of confirmed cases and cumulative predicted cases from Iraq is presented in
Table 8. The errors by day are probably greater than the cumulative errors, as can be seen from Table 8.
Minimizing cumulative error is almost certainly the more important goal. This is indeed one of the
traditional strengths of the logistic model.
5
#10
7000 7
Cumulative confirmed cases in Iraq
Daily cases
Number of confirmed cases in Iraq
Fitting results
6000 6
I 0 =5000
I 0 =6000
5000 5
I 0 =6500
4000 4
3000 3
Data
2000 2 Fitting results
K=550000
1000 1 K=600000
K=650000
0 0
22/02/2020 22/06/2020 22/10/2020 22/02/2020 22/06/2021 22/02/2020 22/06/2020 22/10/2020 22/02/2020 22/06/2021
Iraq Iraq
Figure 6. Three different scenarios for the daily confirmed cases (left panel) and the cumulative
number of infected cases (right panel) in Iraq, 2020–2021.Processes 2020, 8, 1400 10 of 16
Table 6. Estimated parameter results for the three scenarios of the logistic model in Iraq.
Iraq
Logistic Model
Parameters
Scenario One Scenario Two Scenario Three
Estimated epidemic size (cumulative cases) 550,000 600,000 650,000
Estimated start of ending phase date 17/06/2021 07/07/2021 05/08/2021
Goodness of fit (R2 ) 0.9976 0.9967 0.9958
Root Mean Square Error (RMSE) 5883.5 6840.5 7775.5
Table 7. Estimated parameter results for the three scenarios of the Gaussian model in Iraq.
Iraq
Gaussian Model
Parameters
Scenario One Scenario Two Scenario Three
Estimated peak day cases 5000 6000 6500
Estimated peak date 10/10/2020 05/11/2020 17/11/2020
Goodness of fit (R2 ) 0.9515 0.9413 0.9378
Root Mean Square Error (RMSE) 360.6507 396.8004 408.4278
Table 8. Prediction and confirmed cases in Iraq.
Daily Cases Cumulative Cases
Date
Predicted Confirmed Error (%) Predicted Confirmed Error (%)
5-Oct-20 4011.94 3808 5.36 376,351.09 382,949 1.72
6-Oct-20 3987.28 4172 4.43 379,430.15 387,121 1.99
7-Oct-20 3961.56 3923 0.98 382,450.32 391,044 2.20
8-Oct-20 3934.80 3522 11.72 385,411.44 394,566 2.32
9-Oct-20 3907.02 - - 388,313.42 - -
10-Oct-20 3878.25 - - 391,156.25 - -
11-Oct-20 3848.52 - - 393,940.00 - -
12-Oct-20 3817.84 - - 396,664.80 - -
13-Oct-20 3786.24 - - 399,330.85 - -
14-Oct-20 3753.76 - - 401,938.42 - -
15-Oct-20 3720.42 - - 404,487.83 - -
16-Oct-20 3686.24 - - 406,979.47 - -
17-Oct-20 3651.26 - - 409,413.76 - -
18-Oct-20 3615.50 - - 411,791.19 - -
19-Oct-20 3579.00 - - 414,112.30 - -
20-Oct-20 3541.77 - - 416,377.66 - -
21-Oct-20 3503.87 - - 418,587.89 - -
22-Oct-20 3465.30 - - 420,743.64 - -
23-Oct-20 3426.12 - - 422,845.60 - -
3.4. Prediction of the Second Wave of the COVID-19 Epidemic in Egypt
The second wave of the COVID-19 pandemic has been reported in a few countries around the
world, such as France, Italy, Spain, Germany, and Hungary. When the second wave will start in
Egypt is an interesting question. To predict the second wave of the COVID-19 pandemic in Egypt,
we assume that β ≡ β(t) is a continuous, time-periodic transmission rate with one year as the
2π
period and, following, e.g., [35–37], it is assumed to be of the form β(t) = β 0 · sin 366 t + b) + a ,
where a, b are free adjustment parameters and β 0 is the (constant) baseline value of β(t). This function
was used to model the periodic recurrence of infectious diseases such as malaria, Zika virus, and
Lassa virus. In our simulation, the adjustment parameters a and b were set to 1.15 and 52.5, respectively.
To obtain the second peak time, we have performed a simulation with a time-dependent transmission
rate to see what kinds of changes in some parameters could increase the number of infected cases.
Our simulation started with the fitted parameters given in Table 3. We have increased the transmission
rates (β 0 , β e , β m , β h ) and the progression rate (σ) from mildly to severely infected; we got a newProcesses 2020, 8, 1400 11 of 16
parameter set that can be used to obtain one scenario. By repeating the previous step, we got three
different scenarios. We also note that slight changes have been made to the other parameters. We have
found that the most effective parameter is the transmission rate.
Figure 7 shows the three different scenarios for the daily confirmed cases in Egypt with their
corresponding basic reproduction numbers. The start of the second wave is estimated to occur on
7 November 2020 with R0 = 2.54, on 20 November 2020 with R0 = 2.31, and on 10 December
2020 with R0 = 1.92. Therefore, the expected start time of the second round of COVID-19 in Egypt is
estimated to be in the time period between 7 November and 10 December 2020.
19/03/2020 25/06/2020 25/09/2020 25/12/2020 25/03/2021 17/06/2021
Number of symptomatically infected cases in Egypt
R0 = 2.54
R0 = 2.31
3000
R0 = 1.92
2000
1000
0
0 100 200 300 400
Time(in days)
Figure 7. Three different scenarios for the daily confirmed cases in Egypt, 2020–2021.
Based on our simulation, the probability of occurrence of the second wave of COVID-19 in Egypt is
high, and it depends on the behavior of individuals and their adherence to the precautionary measures
and the government’s instructions for reducing the COVID-19 transmission rate.
We have listed the results obtained in Sections 3.1–3.4 in Table 9 to summarize our findings for
Iraq and Egypt, which we obtained by using a compartmental mathematical model (1), logistic growth
model (2), and Gaussian model (4). Table 9 shows a comparison between the estimated parameters
obtained by the three different models, the predicted results of the COVID-19 epidemic in Iraq, and the
estimated start dates of the second wave of COVID-19 in Egypt.
3.5. Sensitivity Analysis and Possible Control Measures
To estimate how easily the virus spreads, the reproduction number R0 is estimated from the
cumulative number of COVID-19 cases using the exponential growth (EG) method and maximum
likelihood method (ML; see, e.g., [34] for details). The results are shown in Table 10. The reproduction
number is greater than one in both countries and the disease persists.
In addition to calculating the reproduction number from the incidence data, we derive a formula
for the reproduction number from our compartmental model (1). Formula (5) provides us with the
basic reproduction number at any given time by substituting the parameter values into it. To assess the
dependence of the basic reproduction number on the parameters that can be used to control the spread
of the virus, the contour plot of the basic reproduction number in terms of the transmission rate (β),
progression rate from mildly infected to symptomatically infected individuals (σ), and progression
rate from symptomatically infected to hospitalized individuals (σs ) for Iraq and Egypt are shown
in Figure 8a,b, respectively. Reducing the transmission rate (β) can reduce the number of severely
infected persons and, thus, the number of infected individuals who need to be treated and intensively
cared for in hospitals.Processes 2020, 8, 1400 12 of 16
Table 9. Summary of the results obtained for Iraq and Egypt in Sections 3.1–3.4.
Iraq Egypt
Models/Parameters
Value (C.I) Value (C.I)
Compartmental model
R0 1.323 1.11
β 0.753 0.56
βe 0.082 0.053
βm 0.475 0.587
βh 0.2057 0.443
θ 0.778 0.875
σ 0.307 0.104
σs 0.3247 0.213
σm 0.239 0.661
σh 0.446 0.508
δs 0.127 0.131
δh 0.298 0.268
ν 0.54 0.266
Logistic Growth Model
R0 1.0659 1.0318
Estimated epidemic size 490,900 (478,300, 503,500) 105,000 (104,500, 105,900)
Estimated start of ending phase date 05/05/2021 04/11/2020
Gaussian model
R0 1.0659 1.0318
Estimated peak day cases 4254 (4161, 4347) 1534 (1493, 1574)
Estimated peak date 14/09/2020 16/06/2020
Prediction of the spread of COVID-19 epidemic in Iraq
Scenario one Scenario two Scenario three
Estimated peak day cases 5000 6000 6500
Estimated peak date 10/10/2020 05/11/2020 17/11/2020
Estimated epidemic size 550,000 600,000 650,000
Estimated start of ending phase date 17/06/2021 07/07/2021 05/08/2021
Prediction of the second wave of COVID-19 epidemic in Egypt
Scenario one Scenario two Scenario three
Estimated start of the second wave 07/11/2020 20/11/2020 10/12/2020
R0 2.54 2.31 1.92
3
4
2 3
2
1
1
0 0
a) b)
(a) Iraq
2.5 2.5
2.0 2.0
1.5 1.5
1.0 1.0
0.5 0.5
0 0
a) b)
(b) Egypt
Figure 8. The contour plots of the basic reproduction number for Iraq and Egypt as a function of (β)
and for (a) progression rate from Im to Is (σ) or for (b) progression rate from Is to H (σs ), respectively.Processes 2020, 8, 1400 13 of 16
Table 10. Calculation of the reproduction number R0 using cumulative cases.
Iraq Egypt
Methods
R0 C.I R0 C.I
EG 1.1017 (1.10166, 1.101768) 1.0604 (1.060386, 1.060481)
ML 1.0659 (1.065207, 1.066639) 1.0318 (1.030841, 1.032637)
Figure 9 shows a comparison of the PRCC values obtained for the parameters in the basic
reproduction number R0 for Iraq and Egypt. The results of the sensitivity analysis show that
any positive change in the parameters (β, β e , β m , β h , θ, ν, σ, σh ) gives a corresponding ratio for the
riskiness of the disease, while R0 can be decreased by increasing the values of the parameters (σm , σs )
in both countries. The parameters δs andδh can not be used as a control measure because they are
death rates.
We noticed from the PRCC that the most influential parameter is β, which can be used to control
the spread of COVID-19. Decreasing the transmission rate can decrease the number of infected and
even turn the disease toward complete extinction. In addition to decreasing the transmission rate from
severely infected to susceptible (β), decreasing the parameters β e , β m , andβ h would also decrease the
basic reproduction number, but this control is not sufficient to drive R0 below one. These parameters
can be lowered by quarantining any person who tested positive for COVID-19 and has no or mild
symptoms for a sufficient period of time (10–14 days). Our model also has its limitations, as we cannot
estimate the impact of a quarantine on the spread of the virus. It has also been observed that by
reducing the rate of progression from mildly to severely infected (σ), the number of severely infected
individuals is also reduced, but just this measure is unable to drive the disease to extinction.
Figure 9. The partial rank correlation coefficient (PRCC) plot of the parameters of R0 for Iraq
(left panel) and for Egypt (right panel).
4. Discussion
In this work, we have studied the spread of the COVID-19 pandemic in Iraq and Egypt
using a Gaussian model, logistic growth model, and compartmental (generalized SEIR) model.
The parameters were estimated using our compartmental model, which was used to understand
the spread of COVID-19 in both countries. Our model provides a reasonably good fit to the
incidence data. We fitted the logistic model to the cumulative number of confirmed COVID-19
cases in Iraq and Egypt. The simulation results can be used to reduce the at-risk and susceptible
population through control measures, such as social distancing and lockdowns, and/or changing
the population’s behavior. The Gaussian model was used to obtain statistical predictions for the
COVID-19 pandemic in Iraq and Egypt; we fitted the Gaussian model to the daily confirmed
COVID-19 cases in both countries. A large rise in the predicted epidemic size in Iraq is
shown by the forecast curve, and for the Egyptian data, the model gives a reasonably good fit.
The Gaussian model indicates that the peak value is 4254 in Iraq and 1534 in Egypt, while the
logistic model shows that the peak value is 490, 900 and 105, 000 in Iraq and Egypt, respectively.
It is important to note that the lockdown was imposed by the Iraqi government on 30 July 2020.Processes 2020, 8, 1400 14 of 16
The basic reproduction number over a period of time is greater than one, suggesting an exponential
growth in cumulative confirmed cases in Iraq, which could indicate that the lockdown regulations
are not being properly implemented, which might contribute to a rise in the size and spread of
the epidemic. Therefore, in order to lift the restriction, the Iraqi health authorities aim to keep the
reproduction rate below one.
Various scenarios for the outbreak of COVID-19 in Iraq were examined in order to provide officials
with perspectives for effective intervention measures. Throughout the study, Gaussian and logistic
models were used to predict the peaks of daily confirmed cases, the cumulative numbers of infected
cases, and the predicted start and end dates of the pandemic. The results of the third scenario illustrate
that the highest predicted cumulative cases are estimated at 650, 000, with daily cases estimated at
6500 and occurring on 17 November 2020, while the peaks of scenario one and scenario two are
expected on 10 October 2020 and 5 November 2020, respectively. Our simulation results indicate that
the possible peak time for the COVID-19 outbreak in Iraq is expected to be between 8 October and
15 November 2020. Several lockdown scenarios and appropriate measures were implemented by the
Egyptian government. Consequently, the number of confirmed cases was suppressed after the peak
time on 19 June 2020. Nowadays, Egypt has reopened its tourism borders to visitors from all over
the world; it has opened places of worship, shopping malls, and markets, and also plans to open
schools and universities on 17 October 2020. For this reason, the occurrence of the second wave of the
COVID-19 epidemic in Egypt is possible; we ran our simulation using a compartmental model with
a time-periodic transmission rate to predict the possible timing of the second wave. Three different
scenarios with basic reproduction rates between 1.92 and 2.54 indicate that the expected beginning of
the second COVID-19 outbreak in Egypt is estimated to be between 7 November and 10 December 2020.
These results, which are based on our assumptions and the corresponding parameter sets, were used.
The reproduction number was estimated based on the cumulative confirmed cases by using
the exponential growth (EG) method and maximum likelihood method (ML), and was found to be
1.0659–1.1017 and 1.0318–1.0604 for Iraq and Egypt, respectively. Using our compartmental model,
a formula for the basic reproduction number was obtained, which allowed us to calculate the value
of R0 . Using the estimated parameter set resulting from fitting our model to the incidence data in
both countries, we found that R0 = 1.323 and R0 = 1.11 for Iraq and Egypt, respectively. The basic
reproduction number is greater than one, indicating that the virus still persists in both countries.
The sensitivity analysis and the contour plots of the basic reproduction number (see Figures 8 and 9)
suggest that to control the spread of the COVID-19 outbreak, both countries should work to decrease
the transmission rate enough by educating the population on how to keep away from contracting
the disease, raising the population’s awareness of fighting the virus, making wearing a face mask
necessary in public places, and making more restrictions on travel between cities that have large
numbers of infected people.
The Iraqi government and health authorities need to impose more restrictions on people gathering
at places of worship and on religious occasions, particularly in October 2020. In addition, the PCR
test is mandatory for every person entering the country. Egypt has stipulated that everyone must
have a negative PCR test certificate in order to enter the country, but at the same time, wedding
celebrations and all shops, markets, and places of worship were reopened after the number of infected
people dropped. To prevent a major outbreak of the COVID-19 disease in Egypt, health authorities
should continue to raise people’s awareness, educate them on how to protect themselves from the fatal
virus, and encourage them to follow the precautions.
Author Contributions: Conceptualization, M.A.I. and A.A.-N.; Data curation, M.A.I. and A.A.-N.;
Formal analysis, M.A.I. and A.A.-N.; Investigation, M.A.I and A.A.-N.; Methodology, M.A.I. and A.A.-N.;
Resources, M.A.I. and A.A.-N.; Supervision, M.A.I. and A.A.-N.; Validation, M.A.I. and A.A.-N.; Visualization,
M.A.I. and A.A.-N.; Writing—original draft, M.A.I. and A.A.-N.; Writing—review and editing, M.A.I. and A.A.-N.
All authors have read and agreed to the published version of the manuscript.Processes 2020, 8, 1400 15 of 16
Funding: M. A. Ibrahim was supported by the ÚNKP-20-3—New National Excellence Program of the Ministry
for Innovation and Technology from the source of the National Research, Development, and Innovation Fund,
by the Stipendium Hungaricum scholarship with application no. 173177, and by a fellowship from the Egyptian
government in the long-term mission system. A. Al-Najafi was supported by Stipendium Hungaricum scholarship
no. 104471 and by a fellowship from the Iraqi government in the fellowship system.
Conflicts of Interest: The authors declare that they have no competing interests.
References
1. Wu, Z.; McGoogan, J.M. Characteristics of and important lessons from the coronavirus disease 2019
(COVID–19) outbreak in China: Summary of a report of 72,314 cases from the Chinese center for disease
control and prevention. J. Am. Med. Assoc. 2020, 323, 1239.e42. [CrossRef] [PubMed]
2. Gorbalenya, A.E.; Baker, S.C.; Baric, R.S.; de Groot Raoul, J.; Drosten, C.; Gulyaeva, A.A.; Haagmans, B.L.;
Lauber, C.; Leontovich, A.M.; Neuman, B.W. The species Severe acute respiratory syndrome-related
coronavirus: Classifying 2019-nCoV and naming it SARS-CoV-2. Nat. Microbiol. 2020, 5, 536–544.
3. Centers for Disease Control and Prevention (CDC). How COVID–19 Spreads. Available online:
https://www.cdc.gov/coronavirus/2019-ncov/prevent-getting-sick/how-covid-spreads.html
(accessed on 8 October 2020).
4. European Centre for Disease Prevention and Control. Transmission of COVID–19. Available online:
https://www.ecdc.europa.eu/en/COVID--19/latest-evidence/transmission (accessed on 8 October 2020).
5. World Health Organization (WHO). Coronavirus. Available online: https://www.who.int/health-topics/
coronavirus#tab=tab_1 (accessed on 8 October 2020).
6. Centers for Disease Control and Prevention (CDC). Symptoms of Coronavirus. Available online:
https://www.cdc.gov/coronavirus/2019-ncov/symptoms-testing/symptoms.html (accessed on 8 October
2020).
7. Tosepu, R.; Gunawan, J.; Effendy, D.S.; Lestari, H.; Bahar, H.; Asfian, P. Correlation between weather and
Covid–19 pandemic in Jakarta, Indonesia. Sci. Total Environ. 2020, 725, 138436. [CrossRef] [PubMed]
8. Batista, M. Estimation of the final size of the second phase of coronavirus epidemic by the logistic model.
MedRxiv 2020. [CrossRef]
9. Boldog, P.; Tekeli, T.; Vizi, Z.; Dénes, A.; Bartha, F.A.; Röst, G. Risk Assessment of Novel Coronavirus
COVID–19 Outbreaks Outside China. J. Clin. Med. 2020, 9, 571. [CrossRef]
10. Almeshal, A.M.; Almazrouee, A.I.; Alenizi, M.R.; Alhajeri, S.N. Forecasting the Spread of COVID–19 in
Kuwait Using Compartmental and Logistic Regression Models. Appl. Sci. 2020, 10, 3402. [CrossRef]
11. Kuniya, T. Prediction of the epidemic peak of coronavirus disease in Japan. J. Clin. Med. 2020, 9, 789.
[CrossRef] [PubMed]
12. Röst, G.; Bartha, F.A.; Bogya, N.; Boldog, P.; Dénes, A.; Ferenci, T.; Horváth, K.J.; Juhász, A.; Nagy, C.;
Tekeli, T.; et al. Early Phase of the COVID–19 Outbreak in Hungary and Post-lock-down Scenarios. Viruses
2020, 12, 708. [CrossRef]
13. Bantan, R.A.R.; Chesneau, C.; Jamal, F.; Elgarhy, M. On the Analysis of New COVID–19 Cases in Pakistan
Using an Exponentiated Version of the M Family of Distributions. Mathematics 2020, 8, 953. [CrossRef]
14. Sarhan, A.R.; Flaih, M.H.; Hussein, T.A.; Hussein, K.R. Novel coronavirus (COVID–19) Outbreak in Iraq:
The First Wave and Future Scenario. medRxiv 2020. [CrossRef]
15. Jebril, N. Distinguishing epidemiological curve of novel coronavirus disease (COVID–19) cases in Iraq: How
it does not follow the epidemic curve of China. SSRN 2020, 3571889. http://dx.doi.org/10.2139/ssrn.3571889.
[CrossRef]
16. Al-Hussein, A.B.A.; Tahir, F.R. Epidemiological characteristics of COVID–19 ongoing epidemic in Iraq.
Bull. World Health Organ. E-Pub 2020, 6. doi: http://dx.doi.org/10.2471/BLT.20.257907. [CrossRef]
17. Amar, L.A.; Taha, A.A.; Mohamed, M.Y. Prediction of the final size for COVID–19 epidemic using machine
learning: A case study of Egypt. Infect. Dis. Model. 2020, 5, 622–634. [CrossRef]
18. Hasab, A.A.; El-Ghitany, E.M.; Ahmed, N.N. Situational Analysis and Epidemic Modeling of COVID–19
in Egypt. J. High Inst. Public Health 2020, 50, 46–51. [CrossRef]
19. Anwar, W.A.; AbdelHafez, A.M. Forecasting the peak of novel coronavirus disease in Egypt using current
confirmed cases and deaths. medRxiv 2020. [CrossRef]
20. El Desouky, E.D. Prediction of the Epidemic Peak of Covid19 in Egypt. medRxiv 2020. [CrossRef]Processes 2020, 8, 1400 16 of 16
21. Asamoah, J.; Jin, Z.; Seidu, B.; Odoro, F.T.; Sun, G.Q.; Alzahrani, F. Mathematical Modelling and Sensitivity
Assessment of COVID–19 Outbreak for Ghana and Egypt. SSRN 2020, 3612877. http://dx.doi.org/10.2139/
ssrn.3612877. [CrossRef]
22. Fahmy, A.E.; Eldesouky, M.M.; Mohamed, A.S. Epidemic Analysis of COVID–19 in Egypt, Qatar and Saudi
Arabia using the Generalized SEIR Model. medRxiv 2020. [CrossRef]
23. Saba, A.I.; Elsheikh, A.H. Forecasting the prevalence of COVID–19 outbreak in Egypt using nonlinear
autoregressive artificial neural networks. Process Saf. Environ. Prot. 2020, 141, 1–8. [CrossRef] [PubMed]
24. Zhao, Z.; Li, X.; Liu, F.; Zhu, G.; Ma, C.; Wang, L. Prediction of the COVID–19 spread in African countries
and implications for prevention and controls: A case study in South Africa, Egypt, Algeria, Nigeria, Senegal
and Kenya. Sci. Total Environ. 2020, 729, 138959. [CrossRef]
25. Worldometer. Available online: https://www.worldometers.info/coronavirus/country/iraq/
(accessed on 8 October 2020).
26. Worldometer. Available online: https://www.worldometers.info/coronavirus/country/egypt/
(accessed on 8 October 2020).
27. Bacaër, N. Verhulst and the logistic equation (1838). In A Short History of Mathematical Population Dynamics;
Springer Ltd.: London, UK, 2011; pp. 35–39.
28. Schüttler, J.; Schlickeiser, R.; Schlickeiser, F.; KrSchöttlerger, M. COVID–19 Predictions Using a Gauss Model,
Based on Data from April 2. Physics 2020, 2, 197–212. [CrossRef]
29. Schlickeiser, R.; Schlickeiser, F. A Gaussian Model for the Time Development of the Sars-Cov-2 Corona
Pandemic Disease. Predictions for Germany Made on 30 March 2020. Physics 2020, 2, 164–170. [CrossRef]
30. Barmparis, G.D.; Tsironis, G.P. Estimating the infection horizon of COVID-19 in eight countries with a
data-driven approach. Chaos Solitons Fractals 2020, 135, 109842. [CrossRef]
31. McKay, M.D.; Beckman, R.J.; Conover, W.J. Comparison of three methods for selecting values of input
variables in the analysis of output from a computer code. Technometrics 1979, 21, 239–245.
32. Blower, S.M.; Dowlatabadi, H. Sensitivity and uncertainty analysis of complex models of disease
transmission: An HIV model, as an example. Int. Stat. Rev. 1994, 62, 229–243. [CrossRef]
33. Diekmann, O.; Heesterbeek, J.A.P.; Roberts, M.G. The construction of next-generation matrices for
compartmental epidemic models. J. R. Soc. Interface 2010, 7, 873–885. [CrossRef] [PubMed]
34. Obadia, T.; Haneef, R.; Boëlle, P. The R0 package: A toolbox to estimate reproduction numbers for
epidemic outbreaks. BMC Med. Inform. Decis. Mak. 2012, 12, 147. [CrossRef] [PubMed]
35. Dénes, A.; Ibrahim, M.A.; Oluoch, L.; Tekeli, M.; Tekeli, T. Impact of weather seasonality and sexual
transmission on the spread of Zika fever. Sci. Rep. 2019, 9, 1–10. [CrossRef] [PubMed]
36. Bakary, T.; Boureima, S.; Sado, T. A mathematical model of malaria transmission in a periodic environment.
J. Biol. Dyn. 2018, 12, 400–432. [CrossRef]
37. Ibrahim, M.A.; Dénes, A. Threshold and stability results in a periodic model for malaria transmission with
partial immunity in humans. Appl. Math. Comput. 2021, 392, 125711. [CrossRef]
Publisher’s Note: MDPI stays neutral with regard to jurisdictional claims in published maps and institutional
affiliations.
c 2020 by the authors. Licensee MDPI, Basel, Switzerland. This article is an open access
article distributed under the terms and conditions of the Creative Commons Attribution
(CC BY) license (http://creativecommons.org/licenses/by/4.0/).You can also read