SOCIAL ISOLATION MEASURES CAUSE REDUCTION IN THE CONTAMINATION AND DEATHS BY COVID-19? THE CASE OF THE MUNICIPALITY OF ARARAQUARA, SP, BRAZIL
←
→
Page content transcription
If your browser does not render page correctly, please read the page content below
Saúde e Ambiente
           V.8 • N.3 • 2021 - Fluxo Contínuo
                                                         ABSTRACT
                    ISSN Digital: 2316-3798
                  ISSN Impresso: 2316-3313
DOI: 10.17564/2316-3798.2021v8n3p233-249                 The SARS-Cov-2 pandemic established the need to
                                                         adopt restrictive measures to contain the spread of
                                                         the virus. In 2021, due to the high number of cases
                                                         of COVID-19 in the municipality of Araraquara, Bra-
                                                         zil, and after the exhaustion of hospital vacancies
  SOCIAL ISOLATION MEASURES CAUSE                        in 2021, a lockdown was announced. We analyzed
 REDUCTION IN THE CONTAMINATION AND                      the effect of social distancing this city, using data
                                                         provided by the municipal government over a total
 DEATHS BY COVID-19? THE CASE OF THE                     period of 90 days. We used this data in a life table,
MUNICIPALITY OF ARARAQUARA, SP, BRAZIL                   an important tool that assesses the impact of dise-
                                                         ases on the population dynamics of a species. The
                                                         results indicated a basic mortality rate of 0.0138 in
   MEDIDAS DE ISOLAMENTO SOCIAL CAUSAM REDUÇÃO DA
                                                         the period analyzed, and a considerable decrease
    CONTAMINAÇÃO E MORTES POR COVID-19? O CASO DO
                                                         in the number of infected cases and deaths from
         MUNICÍPIO DE ARARAQUARA, SP, BRASIL             COVID-19 after 24 days of isolation. Our results
                                                         showed the effectiveness of social distancing in
¿LAS MEDIDAS DE AISLAMIENTO SOCIAL PROVOCAN REDUCCIÓN    stopping the spread of the disease, with an 80%
 DE LA CONTAMINACIÓN Y MUERTES POR COVID-19? EL CASO     reduction in the number of deaths, as well as the
        DEL MUNICIPIO DE ARARAQUARA, SP, BRASIL          usefulness of the life table as a useful tool for data
                                                         analysis.

                      Bruno Santos Francisco1
                                                         KEYWORDS
                        Felipe Bueno Dutra2
                      Abner Carvalho-Batista3
                     Ricardo de Souza Cardoso4
                                                         Life table. Lockdown. Pandemic. Population
                      Milena Sciascio Ghidini5           ecology. SARS-CoV-2.
                  Fernanda Gordo Peres Francisco6
                          Gabriel Perussi7
                    Lausanne Soraya de Almeida8
                    José Mauro Santana da Silva9
             Fatima Conceição Márquez Piña Rodrigues10
RESUMO
Saúde e Ambiente
A pandemia SARS-Cov-2 estabeleceu a necessidade de adoção de medidas restritivas para conter
a disseminação do vírus. Em 2021, devido ao elevado número de casos de COVID-19 no município
de Araraquara, Brasil e após o esgotamento das vagas hospitalares em 2021, foi anunciado um
bloqueio. Analisamos o efeito do distanciamento social dessa cidade, utilizando dados fornecidos
pela prefeitura municipal ao longo de um período de 90 dias. Usamos esses dados em uma tabela
de vida, uma importante ferramenta que avalia o impacto de doenças na dinâmica populacional de
uma espécie. Os resultados indicaram uma taxa básica de mortalidade de 0,0138 no período ana-
lisado e uma redução considerável no número de casos infectados e óbitos por COVID-19 após 24
dias de isolamento. Nossos resultados mostraram a eficácia do distanciamento social em conter a
propagação da doença, com redução de 80% no número de óbitos, bem como a utilidade da tábua
de vida como ferramenta útil para análise de dados.
PALAVRAS-CHAVE
Tabela de Vida. Pandemia. Ecologia de População. SARS-coV-2.
RESUMEN
La pandemia SARS-Cov-2 estableció la necesidad de adoptar medidas restrictivas para contener la pro-
pagación del virus. En 2021, debido al alto número de casos de COVID-19 en el municipio de Araraquara,
Brasil, y luego del agotamiento de las vacantes hospitalarias en 2021, se anunció un cierre patronal.
Analizamos el efecto del distanciamiento social en esta ciudad, utilizando datos proporcionados por el
gobierno municipal durante un período total de 90 días. Usamos estos datos en una tabla de vida, una
herramienta importante que evalúa el impacto de las enfermedades en la dinámica poblacional de una
especie. Los resultados indicaron una tasa de mortalidad básica de 0.0138 en el período analizado, y
una disminución considerable en el número de casos infectados y muertes por COVID-19 después de 24
días de aislamiento. Nuestros resultados mostraron la efectividad del distanciamiento social para dete-
ner la propagación de la enfermedad, con una reducción del 80% en el número de muertes, así como la
utilidad de la tabla de vida como herramienta útil para el análisis de datos.
PALABRAS CLAVE
Tabla de vida. Pandemia. Ecología de la población. SARS-CoV-2.
• 234 • Interfaces Científicas • Aracaju • V.8 • N.3 • p. 233 - 249 • 2021 • Fluxo Contínuo1 INTRODUCTION
Saúde e Ambiente
Since the first reported cases in December 2019 (ZHU et al., 2020) in Wuhan, a Chinese province,
the SARS-CoV-2 outbreak rapidly spread to the whole world (SHAO, 2020). COVID-19 is a disease
caused by the SARS-CoV-2, a respiratory virus that belongs to Coronaviridae family, which also con-
tains the MERS and SARS-CoV-1 viruses (BENVENUTO et al., 2020). The virus uses the ubiquitous
Ace II receptor to entry the cells, (XU et al., 2020) especially those of the respiratory tract (ZOU et al.
2020; SUNGNAK et al., 2020). However, many other studies have demonstrated the infection of SARS-
CoV-2 in a broad range of cells from different organs (FENRICH et al., 2020; TRYPSTEEN et al., 2020).
Due to its fast appearance, and the necessity of an acidic entry, chloroquine was used as a potential
treatment for SARS-CoV-2 although without any proven efficacy (PEREZ et al., 2021)
Meanwhile, many other treatments were developed and are applied combined. Currently, there
are vaccines, convalescent sera, and monoclonal treatment antibodies available against SARS-CoV-2
(CASADEVALL; PIROFSKI, 2020; SEWELL et al., 2020). However, due to the limitations in implement-
ing these measures to protect the whole population, social distancing is still necessary. Social dis-
tancing is a method in which the individuals keep a distance of at least 1.8 meters from each other to
avoid contact with potential contaminants such as saliva droplets (MORAWSKA; CAO, 2020). Based
on scientific evidence, the social distancing in combination with the use of masks could be an import-
ant mechanism to halt the viral dissemination (ANDERSON et al., 2020).
In Brazil, there is disagreement among public managers about the implementation of lock-
down to prevent the spread of the virus because of the pressure coming from the economic sector,
since lockdown results the paralysis of many productive activities (ALFANO; ERCOLANO, 2020).
The country has 12,534,688 million diagnosed cases, with 312,206 thousand total deaths from
COVID-19 until March 28, 2021, according to the panel on the status of the pandemic provided by
the Brazilian Ministry of Health (BRASIL, 2021).
Despite these disputes, the drastic strategy of social isolation presented positive results in other coun-
tries, reducing the daily incidence of COVID-19 in different periods of isolation (LAU et al., 2020; DOMEN-
ICO et al., 2020; ALFANO; ERCOLANO, 2020). These results were also observed in some municipalities in
Brazil, with a decrease in the number of daily cases and deaths by COVID-19 (HOUVÈSSOU et al. 2021).
Life tables help providing information about the population dynamics of a species and on the eval-
uation about the impacts of natural enemies on these populations (VAN LENTEREN; WOETS, 1988;
BELLOWS-JUNIOR et al., 1992, BEGON et al., 2020, CHI et al., 2020). They are generally used to eval-
uate the growth of a population in which the data are estimated based on growth, survival, fertility,
births, and deaths of the population, which are summarized in tables called life tables (BEGON et al.
2020). In this study, we used the life table in order to verify the effects of lockdown on reducing the
transmission of COVID-19 on the population of the municipality of Araraquara.
Recently, with the worsening of the health crisis caused by Covid-19 in Brazil, the city of Arara-
quara, in the countryside of São Paulo, issued a lockdown in mid-February 2021 in order to stop the
increase in the number of cases and deaths caused by this disease (ARARAQUARA, 2021). As a result,
Interfaces Científicas • Aracaju • V.8 • N.3 • p. 233 - 249 • 2021 • Fluxo Contínuo • 235 •many debates have been raised about the effectiveness of social distancing, most of them coming
Saúde e Ambiente
from the non-scientific/academic public.
The present study was conducted with the objective of investigating the role of social distance in
the Brazilian city of Araraquara, in the state of São Paulo.
2 MATERIAL AND METHODS
2.1 STUDY AREA
The State of São Paulo is located in the Southeast region of Brazil, which concentrates about 22%
of the Brazilian population, being the most populous state in the country. The city of Araraquara is lo-
cated at 21º 47’40” S, 48º 10’ 32” W at an altitude of 684m above sea level. The climate is tropical with
a dry winter and a rainy summer, classified as Aw (KÖEPPEN, 1948), with an average temperature of
22.3 °C, and average annual rainfall of 1443 mm. It stands out both regionally and nationally due to its
high quality of life, with a high HDI of 0.815, an estimated population of 226,508 inhabitants, a land
area of 109.88 km², and a demographic density of 206.68 hab/km². Located 270 km from the capital,
in the central region of the state, its economy is based on the food industry, civil construction, aero-
nautics, chemical-pharmaceutical industry, sugar and alcohol agribusiness, commerce, and services,
presenting also several universities (CASAGRANDE; JARDIM, 2014).
The lockdown may be classified as complete or partial lockdown. The total lockdown is defined as
the “total suspension of non-essential activities with restricted movement of people”, with exclusive
operation of essential services. In the partial lockdown, some non-essential services may operate,
according to strict surveillance criteria (BRASIL, 2021). The lockdown started in the municipality of
Araraquara on February 21, 2021, and was still in force until the last day analyzed in this study, April
1, 2021, with the prohibition of vehicles and people circulation throughout the day, except in ex-
ceptional cases. Public transportation was interrupted and other essential services were drastically
restricted. The measure was adopted because the health network was collapsing, with 100% occupa-
tion of public hospitals and serious patients being transferred to distant cities. Thus, the hypothesis
that social distancing is effective in preventing the spread of the disease was tested, that is, if there
were no contact between individuals, the number of infections and deaths by coronavirus were ex-
pected to decrease dramatically (NETTO; CORRÊA, 2020).
2.2 SAMPLING AND DATA ANALYSIS
We used the notifications provided about the number of cases and the number of confirmed coro-
navirus deaths per day. The notifications were collected from the data provided by the Coronavirus
Bulletin of the Coronavirus Contingency Committee in Araraquara, which is part of the city govern-
ment. The data used for the study were collected from December 31, 2020 to April 1, 2021, except for
January 14, 2021 in which there was no collection.
• 236 • Interfaces Científicas • Aracaju • V.8 • N.3 • p. 233 - 249 • 2021 • Fluxo ContínuoSaúde e Ambiente
Based on the data collection, we developed a life table according to Begon et al. (2020), with
daily data on the following parameters: Number of People Infected, considered as the number of
people who were tested positive for COVID-19 (Ax); Proportion of People Infected, which is the total
number of infected people divided by the total number of infected on the last sampled day- (Lx);
Number of Deaths, number of people who died per day due to COVID-19 (Fx); Proportion of Deaths,
number of deaths on the day sampled divided by the total number of infected on that same day
(Mx); and Basic Mortality Rate, which represents the contribution of each person infected with
COVID-19 to the number of deaths from COVID-19, calculated from multiplying the proportion of
infected people by the proportion of deaths. Next, the curves of cumulative cases and deaths during
the sampling period were plotted in order to investigate the effects of the lockdown. From the
first day of the lockdown, they were linearized using the log 10 transformation. A non-hierarchical
K-means Clustering Analysis was carried out to divide the plotted data into different groups, i.e.,
different straight lines. All points were fitted to the equation log y=log a+b log x, where y is the
cumulative number of cases, x is the number of days passed since the beginning of the lockdown,
a is the intercept (linear coefficient) and b is the angular coefficient or slope of the line. The result
of the K-means classification was refined by applying a Discriminant Analysis. Once determined,
the groups were subjected to an Analysis of Covariance (ANCOVA) to test the differences in their
angular and linear coefficients, and whether they can be represented by a single straight line and
equation or should be represented by different straight lines and linear equations. Initially, the
angular coefficients (b) of the lines were tested, and if there were no differences between them,
the linear coefficients (a) were also compared. If there were differences between any of the coeffi-
cients, each straight line should be treated as a different sampling group. Differences in the daily
number of infected people and daily deaths were tested between the groups obtained in the Anal-
ysis of Covariance by the non-parametric Kruskal-Wallis test complemented by the Dunn’s test. All
analyses were performed using the R software (R Core Team 2020).
3 RESULTS
A total number of 9,094,000 people infected with COVID-19 was recorded from the first day of
data collection, on December 31, 2020, to the last day of collection, on April 1, 2021, totaling 90 days
of collection. The total number of people infected with coronavirus in the municipality of Araraquara
since the beginning of the pandemic was 17,224,000 (Table 1). The number of deaths in the 90-day
sampling period was 240. The total basic mortality rate in the municipality was 0.942, obtained from
the 2021 data (Table 1).
Interfaces Científicas • Aracaju • V.8 • N.3 • p. 233 - 249 • 2021 • Fluxo Contínuo • 237 •Saúde e Ambiente Table 1 – Number of people infected and deaths from coronavirus in the municipality of Araraquara in
the period from December 31, 2020 to March 29, 2021
Number of Proportion of Number of Proportion of Basic mortality
Date
infected (Ax) infected (Lx) deaths (Fx) deaths (Mx) rate (Lx.Mx)
Dec/31 8327 47.8% 0 0.00% 0.0000
Jan/01 8371 48.1% 0 0.00% 0.0000
Jan/02 8428 48.4% 1 0.01% 0.0001
Jan/03 8451 48.5% 1 0.01% 0.0001
Jan/04 8480 48.7% 0 0.00% 0.0000
Jan/05 8531 49.0% 0 0.00% 0.0000
Jan/06 8623 49.5% 1 0.01% 0.0001
Jan/07 8677 49.8% 0 0.00% 0.0000
Jan/08 8736 50.1% 0 0.00% 0.0000
Jan/09 8806 50.5% 0 0.00% 0.0000
Jan/10 8884 51.0% 0 0.00% 0.0000
Jan/11 8920 51.2% 1 0.01% 0.0001
Jan/12 9005 51.7% 0 0.00% 0.0000
Jan/13 9054 52.0% 0 0.00% 0.0000
Jan/15 9198 52.8% 2 0.02% 0.0001
Jan/16 9243 53.1% 0 0.00% 0.0000
Jan/17 9316 53.5% 1 0.01% 0.0001
Jan/18 9369 53.8% 0 0.00% 0.0000
Jan/19 9461 54.3% 2 0.02% 0.0001
Jan/20 9476 54.4% 1 0.01% 0.0001
Jan/21 9579 55.0% 1 0.01% 0.0001
Jan/22 9642 55.3% 1 0.01% 0.0001
Jan/23 9718 55.8% 0 0.00% 0.0000
Jan/24 9783 56.2% 1 0.01% 0.0001
Jan/25 9853 56.6% 0 0.00% 0.0000
Jan/26 9959 57.2% 1 0.01% 0.0001
• 238 • Interfaces Científicas • Aracaju • V.8 • N.3 • p. 233 - 249 • 2021 • Fluxo ContínuoSaúde e Ambiente
Number of Proportion of Number of Proportion of Basic mortality
Date
infected (Ax) infected (Lx) deaths (Fx) deaths (Mx) rate (Lx.Mx)
Jan/27 10039 57.6% 4 0.04% 0.0002
Jan/28 10107 58.0% 0 0.00% 0.0000
Jan/30 10272 59.0% 4 0.04% 0.0002
Jan/31 10356 59.4% 2 0.02% 0.0001
Feb/01 10386 59.6% 5 0.05% 0.0003
Feb/02 10590 60.8% 0 0.00% 0.0000
Feb/03 10683 61.3% 0 0.00% 0.0000
Feb/04 10794 62.0% 5 0.05% 0.0003
Feb/05 10894 62.5% 1 0.01% 0.0001
Feb/06 10998 63.1% 0 0.00% 0.0000
Feb/07 11093 63.7% 1 0.01% 0.0001
Feb/08 11118 63.8% 1 0.01% 0.0001
Feb/09 11361 65.2% 1 0.01% 0.0001
Feb/10 11522 66.1% 4 0.03% 0.0002
Feb/11 11639 66.8% 1 0.01% 0.0001
Feb/12 11759 67.5% 6 0.05% 0.0003
Feb/13 11960 68.7% 2 0.02% 0.0001
Feb/14 12127 69.6% 3 0.02% 0.0002
Feb/15 12205 70.1% 2 0.02% 0.0001
Feb/16 12434 71.4% 5 0.04% 0.0003
Feb/17 12631 72.5% 5 0.04% 0.0003
Feb/18 12802 73.5% 4 0.03% 0.0002
Feb/19 12989 74.6% 5 0.04% 0.0003
Feb/20 13237 76.0% 3 0.02% 0.0002
LOCKDOWN
Feb/21 13454 77.2% 1 0.01% 0.0001
Feb/22 13493 77.5% 6 0.04% 0.0003
Interfaces Científicas • Aracaju • V.8 • N.3 • p. 233 - 249 • 2021 • Fluxo Contínuo • 239 •Saúde e Ambiente Number of Proportion of Number of Proportion of Basic mortality
Date
infected (Ax) infected (Lx) deaths (Fx) deaths (Mx) rate (Lx.Mx)
Feb/23 13683 78.5% 4 0.03% 0.0002
Feb/24 13822 79.3% 4 0.03% 0.0002
Feb/25 13978 80.2% 7 0.05% 0.0004
Feb/26 14172 81.4% 5 0.04% 0.0003
Feb/27 14377 82.5% 5 0.03% 0.0003
Feb/28 14574 83.7% 3 0.02% 0.0002
Mar/01 14669 84.2% 6 0.04% 0.0003
Mar/02 14854 85.3% 6 0.04% 0.0003
Mar/03 14969 85.9% 7 0.05% 0.0004
Mar/04 15085 86.6% 1 0.01% 0.0001
Mar/05 15214 87.3% 9 0.06% 0.0005
Mar/06 15396 88.4% 6 0.04% 0.0003
Mar/07 15519 89.1% 6 0.04% 0.0003
Mar/08 15577 89.4% 6 0.04% 0.0003
Mar/09 15640 89.8% 6 0.04% 0.0003
Mar/10 15725 90.3% 6 0.04% 0.0003
Mar/11 15809 90.7% 5 0.03% 0.0003
Mar/12 15899 91.3% 7 0.04% 0.0004
Mar/13 15985 91.8% 2 0.01% 0.0001
Mar/14 16159 92.8% 6 0.04% 0.0003
Mar/15 16191 92.9% 5 0.03% 0.0003
Mar/16 16265 93.4% 5 0.03% 0.0003
Mar/17 16345 93.8% 5 0.03% 0.0003
Mar/18 16429 94.3% 3 0.02% 0.0002
Mar/19 16560 95.1% 2 0.01% 0.0001
Mar/20 16622 95.4% 3 0.02% 0.0002
Mar/21 16723 96.0% 2 0.01% 0.0001
Mar/22 16751 96.2% 3 0.02% 0.0002
• 240 • Interfaces Científicas • Aracaju • V.8 • N.3 • p. 233 - 249 • 2021 • Fluxo ContínuoSaúde e Ambiente
Number of Proportion of Number of Proportion of Basic mortality
Date
infected (Ax) infected (Lx) deaths (Fx) deaths (Mx) rate (Lx.Mx)
Mar/23 16796 96.4% 3 0.02% 0.0002
Mar/24 16877 96.9% 1 0.01% 0.0001
Mar/25 16914 97.1% 2 0.01% 0.0001
Mar/26 16957 97.3% 0 0.00% 0.0000
Mar/27 17100 98.2% 6 0.04% 0.0003
Mar/28 17161 98.5% 1 0.01% 0.0001
Mar/29 17224 98.9% 2 0.01% 0.0001
Mar/30 17284 99.2% 1 0.01% 0.0001
Mar/31 17284 99.2% 2 0.01% 0.0001
Apr/01 17421 100.0% 2 0.01% 0.0001
Total basic mortality rate from coronavirus from 2021 onwards 0.0138
Legend: Ax is the number of people infected by coronavirus; Lx is the proportion of those infected
with COVID-19, where the proportion of those infected = Ax/17421; Fx is the number of coronavirus
deaths; Mx is the proportion of coronavirus deaths, where the proportion of deaths = Fx/Ax; Lx.Mx is
the basic mortality rate, where the basic mortality rate = Lx*Mx
Source: Research Data.
The lockdown started on February 21, 2021, and continued until the last sampling day on April 1,
2021, for a total of 39 lockdown days. The first day of the lockdown was the 51st day of the analyzed
series, when the number of infected people was 13,454,000, with 171 coronavirus deaths. Such a
measure was taken after a steepening in the slopes of the curves of number of cases and number
of deaths (Figure 1). In the final part of the series, a reduction in the number of both infections and
deaths per day was observed.
Interfaces Científicas • Aracaju • V.8 • N.3 • p. 233 - 249 • 2021 • Fluxo Contínuo • 241 •Saúde e Ambiente Figure 1 – (A) Number of people infected by coronavirus, in the municipality of Araraquara, state
of São Paulo, in the study period in relation to the number of sampling days. The dashed line in red
indicates the beginning of the lockdown. (B) Number of coronavirus deaths, in the municipality of
Araraquara, São Paulo state. The dashed line in red indicates the beginning of the lockdown
Source: Research Data.
Based on the cumulative number of new infection cases in relation to the numbers of days analyzed, the
period after the beginning of the lockdown was divided into three groups (Discriminant Analysis, pSaúde e Ambiente
Table 2 – Results of the Covariance Analysis (ANCOVA) for the relationship between number of cumu-
lative new cases and the number of days after the lockdown started, in Araraquara. The data groups
were defined based on the K-means Analysis, refined by Discriminant Analysis
Par (log) F P
First vs. second part of a - -
Accumulated the lockdown b 52 0.000001*
number of cases
First vs. third part of a - -
by day of
lockdown the lockdown b 46 0.000003*
Second vs. third part of a - -
the lockdown b 18 0.000302*
Source: Research Data.
Regarding the increase in the cumulative number of deaths in relation to the number of days,
the period after the beginning of the lockdown may also be divided into three groups (Discriminant
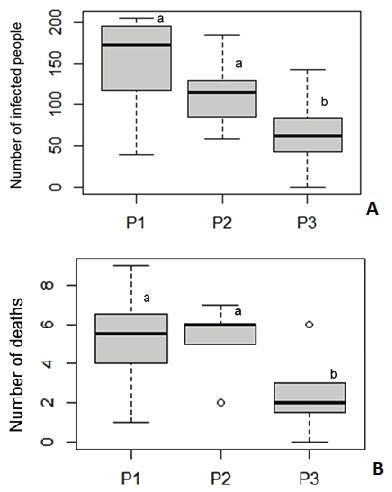
Analysis, pSaúde e Ambiente Regarding the daily number of deaths there was no significant difference between the first and
second lockdown periods. However, the third period was statistically significant different (H= 17.869;
p>0.05), with fewer deaths in this period (Figure 3).
Figure 3 (A) – Box-plots of median and quartiles of the number of people infected by COVID-19 during
the lockdown, in the municipality of Araraquara, state of São Paulo
P1 = first period (February 22 to March 01), P2 = second period (March 02 to March 14) and P3 = third period
(March 15 and April 01). Kruskal-Wallis test (PSaúde e Ambiente
and in the number of deaths from COVID-19 (Table 1, Figure 3). In some places in the world the number
of infections by coronavirus reduced 14 days after the start of the lockdown (HOUVÈSSOU et al., 2021), a
shorter time than that found in our study. That corroborates the positive results observed in China about
the reduction of COVID-19 infections after the adoption of this initiative (LAU et al., 2020).
Between February 21 and March 6, 2021, Brazil was among the countries with the worst indicators
regarding COVID-19, with accelerated growth, corresponding to 9.5% and 10.3% of total number of
cases and deaths worldwide, respectively. Actually, the country never achieved a significant reduction
of its transmission curve, accumulating new records of daily cases and deaths (FIOCRUZ, 2021). In the
study conducted in Araraquara, the rate of growth in the number of deaths was slower, taking more time
to be affected by the lockdown. The reduction in the daily number of deaths only showed a significant
reduction 24 days after its onset (FIGURE 3). Normally, the average time from the onset of symptoms
until intubation is 14.5 days, and from this period until the worsening of the disease resulting in death
is 4 to 5 days (WANG et al., 2020; ZHOU et al., 2020). Thus, the deaths that occurred during much of
the lockdown period may refer to infections that occurred before the onset of this restrictive measure.
Similar results to those of Araraquara on the positive effect of the lockdown were observed in
China, France, South Africa, Germany, Spain, Italy, and New Zealand, which showed a reduction in
the growth of the number of confirmed cases of COVID-19 after the implementation of lockdown
restriction measures (HOUVÈSSOU et al., 2021). In Brazil, the impact of the implementation of strict
containment measures was observed in four municipalities in the northeast region of the country,
showing a reduction of 16.77% (Belém/PA), 33.4% (Fortaleza/CE), 21.76% (Recife/PE) and 37.85%
(São Luís/MA) in the rate of contamination and deaths by COVID-19 (SILVA et al., 2020). These results
were a consequence of the reduction in circulation and proximity between people, since the virus
spreads mainly from person to person through close contact and respiratory droplets (MORAWSKA;
CAO, 2020). However, if the virus does not find a host, the disease terminates and thus the success of
the prevention depends on the inflection of the pandemic (SCHUCHMANN; ZHANG, 2020).
In this study, we showed that the table of life used in ecological studies is an efficient tool in the
analysis of data in pandemics, since we can illustrate the proportions of infected people and deaths
more clearly, also providing data to verify the basic mortality rate, which can be compared with other
studies in any region of the world. Based on the life table, we verified that the lockdown in a mu-
nicipality with just over 100,000 inhabitants in the countryside of Brazil was an effective measure,
because there was a flattening of the curve of infected people and deaths.
We believe that the decisions taken by the health agencies and their professionals highlight the
need of support to social isolation as a tool to deal with the pandemic, especially while effective phar-
macological measures do not exist (HOUVÈSSOU et al., 2021).
Despite the difficulty in evaluating the number contacts people usually have, the estimates pre-
sented help to understand the need for isolation, since the data shown in this study revealed that so-
cial isolation during the lockdown performed in the city of Araraquara was efficient both in reducing
the number of infected people and the number of deaths. Although social isolation actions do not
eliminate the virus, they are useful tools for providing good healthcare services, besides reducing the
burden on nurses and health professionals (SILVA, 2021).
Interfaces Científicas • Aracaju • V.8 • N.3 • p. 233 - 249 • 2021 • Fluxo Contínuo • 245 •5 CONCLUSIONS
Saúde e Ambiente
In our study, we found that the life table was an effective tool for analyzing the infection data,
since it made it clear that the restrictive lockdown resulted in the control of the coronavirus by pro-
moting the reduction of the number of infected people by 80% and the number of coronavirus deaths
only 24 days after its onset. The total basic mortality rate in the city was 0.138. We recommend the
use of the life table for future studies in other municipalities, since it is a powerful tool in Ecology that
can be used in the interpretation of pandemic data.
REFERENCES
ADHIKARI S. P. et al. Epidemiology, causes, clinical manifestation and diagnosis, prevention and
control of coronavirus disease (COVID-19) during the early outbreak period: a scoping review. Infect
Dis Poverty, v. 9, n. 29, 2020.
ALFANO, V.; ERCOLANO, S. The eficacy of lockdown against COVID-19: A cross-country panel
analysis. Appl Health Econ Hea, v. 18, p. 509-517, 2020.
ANDERSON, M. R. et al. How will country-based mitigation measures influence the course of the
COVID-19 epidemic? Lancet Real Heal, 395, 2020.
ARARAQUARA. Prefeitura Municipal de Araraquara. Decreto nº 12.490, de 19 de fevereiro de 2021.
Dispõe sobre a implementação de medidas restritivas complementares às previstas no Decreto nº
12.485, de 12 de fevereiro de 2021, de caráter excepcional e temporário, voltadas à contenção da
disseminação da COVID- 19 no Município. Available at: http://www.araraquara.sp.gov.br/boletim/12
490.19fev21DISPEMEDIDASCOMPLEMENTARESAODECRETO12485.pdf. Access: 10 may 2021.
BEGON, M. et al. Ecology: from individuals to ecosystems. London: Wiley Pub. 2020.
BELLOWS JUNIOR, T. S. et al. Life-table construction and analysis in the evaluation of natural
enemies. Annu Rev Entomol, v. 37, p. 587-614, 1992.
BENVENUTO, D. et al. The 2019�new coronavirus epidemic: Evidence for virus evolution. J Med Virol,
v. 92, p. 455-459, 2020.
BRASIL. Ministério da Saúde COVID-19: Painel coronavírus. 2021. Available at: https://covid.saude.
gov.br/. Access: 15 may 2021.
• 246 • Interfaces Científicas • Aracaju • V.8 • N.3 • p. 233 - 249 • 2021 • Fluxo ContínuoSaúde e Ambiente
CASADEVALL, A.; PIROFSKI, L. The convalescent sera option for containing COVID-19 J Clin
Investig, 2020.
CASAGRANDE E. E.; JARDIM M. C. Araraquara dos anos 2000: uma perspectiva a partir de
diferentes olhares. São Paulo: Editora UNESP. 2014.
CHI, H. S. et al. Age-stage, two-sex life table: an introduction to theory, data analysis, and
application. Entomol Gen, v. 40, p. 103-124, 2020.
DOMENICO, L. et al. Impact of lockdown on COVID-19 epidemic in Île-de-France and possible exit
strategies. BMC med., v.18, n. 240, 2020.
FENRICH, M. et al. SARS-CoV-2 Dissemination Through Peripheral Nerves Explains Multiple Organ
Injury. Front Cell Neuroscien, 2020.
FIOCRUZ. Boletim do Observatório Covid-19. Rio de Janeiro: FIOCRUZ, 2021. Available at: https://
portal.fiocruz.br/sites/portal.fiocruz.br/files/documentos/boletim_covid_2021_semanas_08_09.
pdf. Access: 15 may 2021.
HOUVÈSSOU, M.G. et al. Medidas de contenção de tipo lockdown para prevenção e controle da
COVID-19: estudo ecológico descritivo, com dados da África do Sul, Alemanha, Brasil, Espanha, Estados
Unidos, Itália e Nova Zelândia, fevereiro a agosto de 2020. Epidemiol Serv Saúde, v. 30, n. 1, 2021.
KANG, J. et al. Recent progress in understanding 2019 novel coronavirus (SARS-CoV-2) associated
with human respiratory disease: detection, mechanisms and treatment. Int J Antimicrob, v. 55, n. 5,
a. 105950, 2020.
KÖEPPEN, W. Climatología: con un estudio de los climas de la Tierra. Mexico City: Fondo de
Cultura Económica, 1948. 474 p.
KUCHARSKI, A. J. et al. Early dynamics of transmission and control of COVID-19: a mathematical
modelling study. Lancet Infect Dis, v. 20, p. 553-558, 2020.
LAU, H. et al. The positive impact of lockdown in Wuhan on containing the COVID-19 outbreak in
China. J Travel Med, v. 27, p. 1-7, 2020.
MORAWSKA, L.; CAO, J. Airborne transmission of SARS-CoV-2: The world should face the reality,
Environ Int, v. 139, p. 105730, 2020.
NETTO, R. G. F; CORRÊA, J. W. N. Epidemiologia do surto de doença por coronavírus (COVID-19). Rev
Desafios, v. 7 n. esp. 3, 2020.
Interfaces Científicas • Aracaju • V.8 • N.3 • p. 233 - 249 • 2021 • Fluxo Contínuo • 247 •Saúde e Ambiente PEREZ, J. et al. Reported adverse drug reactions associated with the use of Hydroxychloroquine and
Chloroquine during the COVID-19 pandemic. Ann Intern Med, v. 174, n. 6, p. 878-880, 2021.
SHAO, P. Impact of city and residential unit lockdowns on prevention and control of COVID-19.
MedRxiv, 2020.
SEWELL, F. H. et al. Vaccines, convalescent plasma, and monoclonal antibodies for covid-19. The
BMJ 370, 2020.
SILVA, L. et al. The effect of lockdown on the COVID-19 epidemic in Brazil: evidence from an
interrupted time series design, Cad Saude Publ, v. 36, n. 10, 2020.
SUNGNAK, W et al. SARS-CoV-2 entry factors are highly expressed in nasal epithelial cells together
with innate immune genes. Nat Med, v. 26, p. 681–687. 2020.
TRYPSTEEN, W. et al. On the whereabouts of SARS-CoV-2 in the human body: A systematic review.
Plos Pathogens, v. 2, 2020.
VAN LENTEREN J.C.; WOETS, J. Biological and integrated pest control in greenhouses. Ann Rev
Entomol, v. 33, p. 239-269, 1988.
XU, X. et al. Evolution of the novel coronavirus from the ongoing Wuhan outbreak and modeling of
its spike protein for risk of human transmission. Sci. China Life Sci. v.63, p. 457–460, 2020.
WANG, L. et al. Coronavirus disease 2019 in elderly patients: Characteristics and prognostic factors
based on 4-week follow-up, J Infect, v. 80, n. 6, p. 639-645, 2020.
ZHOU, F. et al. Clinical course and risk factors for mortality of adult inpatients with COVID-19 in
Wuhan, China: a retrospective cohort study. Lancet v. 395, n. 10229, p. 1054-1062, 2020.
ZHU, N. et al. A Novel Coronavirus from Patients with Pneumonia in China, 2019. N Engl J Med v.
382, p. 727-733, 2020.
ZOU, X. et al. Single-cell RNA-seq data analysis on the receptor ACE2 expression reveals the
potential risk of different human organs vulnerable to 2019-nCoV infection. Front Med, v. 14, p.
185–192, 2020.
• 248 • Interfaces Científicas • Aracaju • V.8 • N.3 • p. 233 - 249 • 2021 • Fluxo ContínuoRecebido em: 15 de Março de 2021
1 Doutorando, Programa de Pós-graduação em Planeja- Avaliado em: 10 de Maio de 2021
mento e Uso de Recursos Renováveis, Universidade Fede- Aceito em: 10 de Maio de 2021
ral de São Carlos – UFSCar, Campus Sorocaba, Sorocaba,
SP, Brazil. E-mail: brunofrancisco@estudante.ufscar.br.
2 Doutorando, Programa de Pós-graduação em Planeja-
mento e Uso de Recursos Renováveis, Universidade Fede-
ral de São Carlos – UFSCar, Campus Sorocaba, Sorocaba,
SP. E-mail: fbdutra@estudante.ufscar.br.
3 Doutor em Ciências Biológicas, Instituto de Ciências da
Saúde, Universidade Paulista – UNIP, São Paulo, SP, Brazil. A autenticidade desse
E-mail: carvbatis@gmail.com.
artigo pode ser conferida
4 Department of Microbiology and Immunology of University no site https://periodicos.
of Michigan Medical School, Ann Arbor, Michigan, USA. set.edu.br
Email: rdsc@umich.edu
5 Mestranda, Programa de Pós-graduação em Ciências
Ambientais, Universidade Federal de São Carlos – UFSCar,
Campus São Carlos, São Carlos, SP, Brazil.
E-mail: milenasghidini@gmail.com.
6 Acadêmica em Medicina, Faculdade de Medicina de
Catanduva – FAMECA, Catanduva, SP, Brazil.
E-mail: ferfrancisco98@gmail.com.
7 Mestrando, Programa de Pós-graduação em Planejamen-
to e Uso de Recursos Renováveis, Universidade Federal de
São Carlos – UFSCar, Campus Sorocaba, Sorocaba, SP,
Brazil. E-mail: gabriel.perussi@gmail.com
8 Doutora em Planejamento e Uso de Recursos Renová-
veis, Programa de Pós-graduação em Planejamento e Uso
de Recursos Renováveis, Universidade Federal de São
Carlos – UFSCar, Campus Sorocaba, Sorocaba, SP, Brazil.
E-mail: lausannesoraya@gmail.com.
9 Doutor em Agronomia. Professor Titular, Departamento de Este artigo é licenciado na modalidade acesso
Ciências Ambientais, Universidade Federal de São Carlos, abertosob a Atribuição-CompartilhaIgual CC BY-SA
UFSCar, Campus Sorocaba, Sorocaba, SP, Brazil.
E-mail: josemauro@ufscar.br.
10 Doutora em Ecologia. Professora Titular, Departamen-
to de Ciências Ambientais, Universidade Federal de São
Carlos, UFSCar, Campus Sorocaba, Sorocaba, SP, Brazil.
E-mail: fpinarodrigues@gmail.comYou can also read