Weekly briefing on ONS COVID-19 data and analysis - 14 to 18 September 2020 Helen Fox, Mike Comer and Muhammed Khaliq
←
→
Page content transcription
If your browser does not render page correctly, please read the page content below
Weekly briefing on ONS
COVID-19 data and
analysis
14 to 18 September 2020

Helen Fox, Mike Comer and Muhammed Khaliq
Contact for enquiries: COVID19Analysis@ons.gov.uk

                                                    COVID-19 Analysis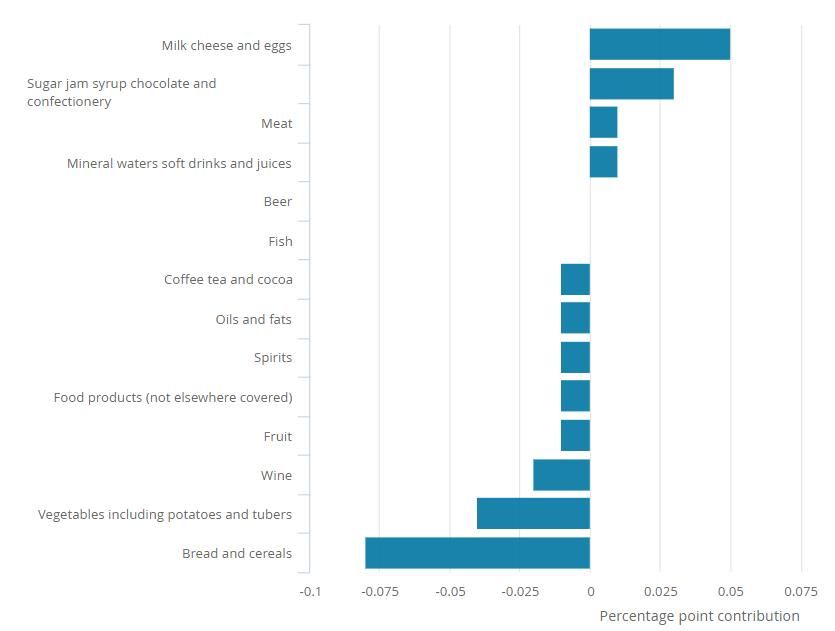
Contents                     This pack provides a brief overview of key facts and figures from the latest content from
0. Main points               ONS between 14 and 18 September 2020 relating to COVID-19. It includes published
1.   Mortality and deaths    ONS data on aspects of the economy and society impacted by COVID-19, summarising
2.   Transmission            the latest information from this week covering the following themes: Mortality and
3.   Preventative measures   deaths, Transmission, Preventative measures, Well-being, Social impacts, Travel to
4.   Well-being              work, UK labour market, UK inflation, UK retail sales, UK house prices, UK trade,
5.   Social impacts          Business impact, Company impact, Online prices, Consumer behaviour, Online job
6.   Travel to work
                             adverts and Road traffic.
7.   UK labour market
                             Further information, including strengths and limitations about the statistics contained in
8.   UK inflation            this pack, can be found by clicking through on the source links on the relevant pages.
9.   UK retail sales
10. UK house prices          Information on ONS publications and statistics relating to COVID-19 included in this
11. UK trade                 pack can be found on ONS’ COVID-19 landing page where all articles, statistical
12. Business impact          bulletins and data relating to COVID-19 are published. ONS’ Coronavirus Roundup
13. Company impact           page provides a summary of ‘what we know about COVID-19’ and you can receive
14. Online prices            email alerts on the latest updates. Our National Statistical Blog provides news and
                             insight from across ONS.
15. Consumer behaviour
16. Online job adverts
                             We are constantly seeking to improve this product, please provide feedback on how you
17. Road traffic             use it and what additional information would be useful via
18. News and announcements   COVID19Analysis@ons.gov.uk.

                                                                                                            Contents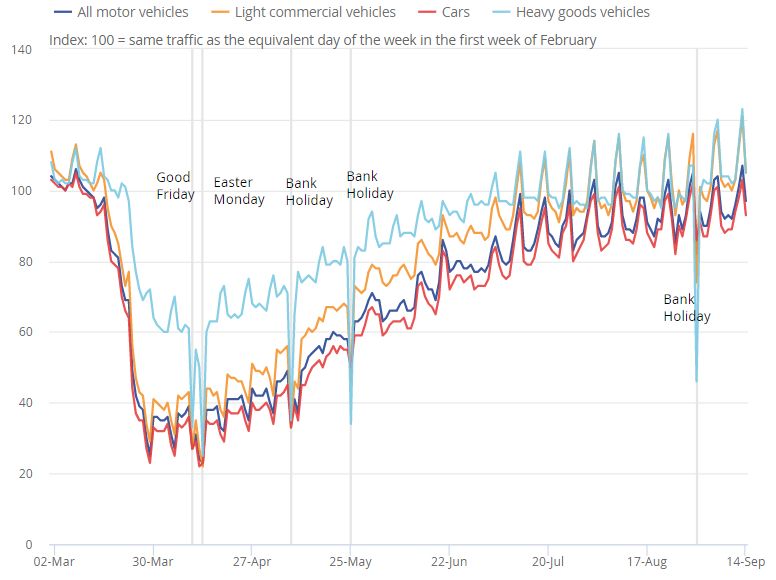
Main Points
•   The number of COVID-19 deaths remain low in England and Wales with 78 deaths related to COVID-19 during w/e 4 September 2020.
•   COVID-19 did not feature in the top 10 leading causes of death in August 2020; COVID-19 was the 24th most common cause of death in England
    and the 19th most common cause of death in Wales.
•   The relative difference in COVID-19 mortality rates between those categorised as ‘disabled and limited a lot’ and those classified as ‘non-disabled’
    was 2.4 times higher for females and 2.0 times higher for males for deaths occurring between 2 March to 14 July 2020.
•   Modelled estimates continue to suggest that COVID-19 infection rates has increased in recent weeks in England.
•   Adults in Scotland were most likely to be asked for and then provide their personal details to test and trace services when visiting public places
    such as restaurants and hairdressers.
•   Labour market figures for May to July 2020 show a rise in the unemployment rate to 4.1%; while the employment rate rose to 76.5%.
•   Between May to July 2019 and May to July 2020, average actual weekly hours worked fell by 5.8 hours. Decreases were observed in all industries
    apart from agriculture, forestry, and fishing.
•   The Consumer Prices Index including owner occupiers' housing costs (CPIH) 12-month inflation rate was 0.5% in August 2020.
•   Average house prices in the UK rose by 3.4% in the year to June 2020.
•   According to the latest Business Impact of Coronavirus Survey, 77% of all responding businesses had applied for the Coronavirus Job Retention
    Scheme (CJRS); 10% of the workforce in all businesses had been furloughed.

                                                                                                                                    0 Main Points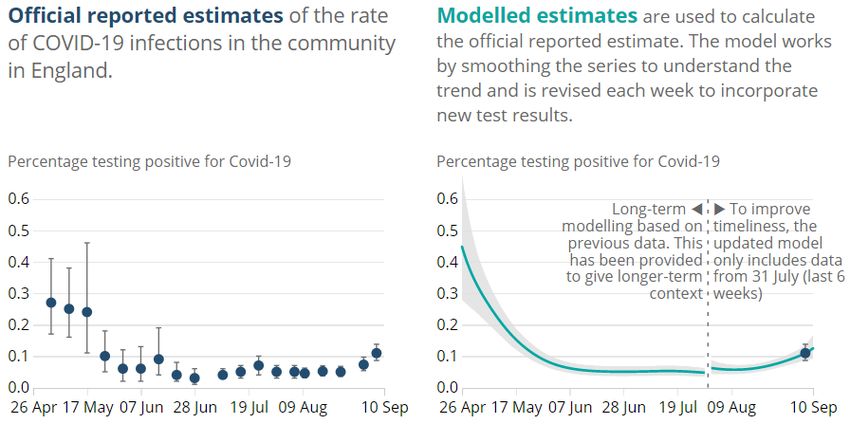
COVID-19 deaths remain low in England                                                                 Deaths in private homes remained above the 5-yr average in w/e 4 Sept 2020
                                                                                                      Number of excess deaths by place of occurrence, England & Wales, registered
and Wales during w/e 4 September 2020                                                                 between 7 March 2020 and 4 September 2020

Deaths registrations during w/e 4 September 2020 in England & Wales:
• Total deaths were 7,739; down 1,293 deaths on previous week and
  15.7% below the 5-year average (1,443 deaths fewer)*.
•   Deaths related to COVID-19 were 78 (1.0% of all deaths; the lowest
    number of COVID-19 deaths in the last 25 weeks ) and down 23 (22.8%)
    on previous week. There has been 52,376 COVID-19 deaths in total.
*The week ending 4 September contained the late August bank holiday, which contributed to the
decreased number of deaths registered and deaths registered involving COVID-19.
Number of deaths involving COVID-19 decreased for the 20th consecutive week
Number of deaths registered by week, England & Wales, 28 Dec 2019 to 4 Sept 2020

                                                                                                  •   Deaths in hospitals, care homes and other locations were below the 5-
                                                                                                      year average. Deaths in private homes above the 5-year average.
                                                                                                  •   55.0% of all deaths involving COVID-19 to w/e 4 Sept were males.
                                                                                                  •   89.3% of all deaths involving COVID-19 to w/e 4 Sept were aged 65+.
                                                                                                  83 UK COVID-19 deaths (w/e 4 Sept): 56,845 total UK COVID-19 deaths.
                                                                                       Source: Deaths registered weekly in England and Wales, provisional: week ending 4 September 2020

                                                                                      Lead analyst: Sarah Caul
                                                                                      (health.data@ons.gov.uk)
                                                                                                                                             1 Mortality and deaths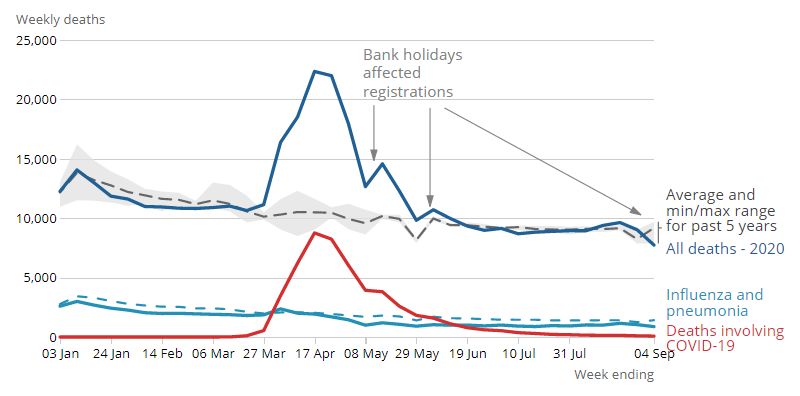
COVID-19 was the 24th most common cause of death in England and the 19th
most common cause of death in Wales, for deaths registered in August 2020
Deaths registered in England and Wales in August 2020:
                                                                                     Mortality rates for the month of August have fallen between 2001 and
•   34,750 deaths were registered in England, 2,060 deaths fewer than August’s 2020
    5-year average. In Wales, 2,379 deaths were registered, 116 deaths fewer   Age-standardised mortality rates by sex, England and Wales, deaths registered
    than the 5-year average.                                                   in August 2001 to August 2020

•   Dementia and Alzheimer’s disease was the leading cause of death in
    England (10.9% of all deaths) with ischaemic heart disease the leading
    cause in Wales (11.0% of all deaths).
•   COVID-19 did not feature in the top 10 leading causes of death in August
    2020; COVID-19 was the 24th most common cause of death in England and
    the 19th most common cause of death in Wales.
•   The age-standardised mortality rate (ASMR) of death due to COVID-19 for
    England and Wales was 7.2 and 11.0 per 100,000 persons respectively. In
    both countries, the COVID-19 mortality rate declined for the 4th consecutive
    month.
•   Of the 34,750 deaths registered in August 2020 in England, 1.4% (482
    deaths) involved COVID-19. In Wales, 2.2% of the 2,379 deaths registered
    in August involved COVID-19 (52 deaths).

                                                                                                Source: Monthly mortality analysis, England & Wales: August 2020

                                                               Lead analyst: Danielle Cornish
                                                                  (health.data@ons.gov.uk)
                                                                                                                        1 Mortality and deaths
The relative difference in COVID-19 mortality rates between those categorised as
‘disabled and limited a lot’ and those classified as ‘non-disabled’ was 2.4 times
higher for females and 2.0 times higher for males between 2 March to 14 July
• Provisional comparisons of death counts, age standardised mortality
rates (ASMRs) and modelled hazard ratios show that a disabled Males aged 65 years and over who were disabled and limited a lot had the
highest age-standardised COVID-19 mortality rate at 860.8 per 100,000
person (self-reported disability status, as collected in the 2011 Census)
Age-standardised mortality rates for deaths involving COVID-19, by sex, age group
was more likely to die from COVID-19 than a non-disabled person in and disability status, England and Wales, 2 March to 14 July 2020
the period 2 March to 14 July 2020, in England and Wales.
• Disabled people made up almost 60% of all deaths involving COVID-
19. Disabled people made up around 16% of the study population
followed from the 2011 Census.
• Among both males and females age 9 and over, those who were either
disabled and limited a lot or disabled and limited a little in 2011 had a
statistically significant higher ASMR of death involving COVID-19 than
those who were non-disabled. Male and female disabled people who
were limited a lot had a statistically significantly higher ASMR of death
involving COVID-19 than disabled people who were limited a little.
• After adjusting for region, population density, socio-demographic and
household characteristics, the relative difference in mortality rates NOTE: people are counted as disabled if they said their daily activities were limited a little or
between those disabled and limited a lot and those non-disabled was limited a lot by a health problem or disability lasting or expected to last at least 12 months.
2.4 times higher for females and 2.0 times higher for males.
Source: Coronavirus (COVID-19) related deaths by disability status, England and Wales: 2 March to 14 July 2020
Lead analysts: Catherine Putz &
David Ainslie 1 Mortality and deaths
(life.course@ons.gov.uk)The most recent modelled estimates suggest the number of COVID-19 infections
has increased in recent weeks with higher infection rates in the North West and
London
During the most recent week (4 to 10 September 2020):
• An estimated 59,800 people (95% credible interval: 46,900 to 75,200) The most recent modelled estimate shows the number of infections in
England has increased in recent weeks
within the community population in England had COVID-19, equating to
Estimated percentage of the population in England testing positive for the
around 1 in 900 people (95% credible interval: 1 in 1,200 to 1 in 700). coronavirus (COVID-19) on nose and throat swabs since 26 April 2020
• There is evidence of higher infection rates in the North West and London.
• It is estimated there were around 1.10 (95% credible interval: 0.77 to
1.51) new COVID-19 infections for every 10,000 people per day in the
community population in England, equating to around 6,000 new cases
per day (95% credible interval: 4,200 to 8,300).
• It is estimated that 1,500 people in Wales had COVID-19 (95% credible
interval: 400 to 3,900), which is around 1 in 2,000 people (95 % credible
interval: 1 in 8,200 to 1 in 800).
The most recent modelled estimates suggest:
• The number of infections has increased in recent weeks.
• In recent weeks, there has been clear evidence of an increase in the
number of people testing positive for COVID-19 aged 2 to 11, 17 to 24
years and 25 to 34 years.
• The incidence rate for England has increased in recent weeks. Source: Coronavirus (COVID-19) Infection Survey pilot: England and Wales, 18 September 2020
Lead analyst: Esther Sutherland;
Hannah Donnarumma 2 Infection
(Infection.Survey.Analysis@ons.gov.uk)Adults in Scotland were most likely to be asked for and then provide their
personal details to test and trace services when visiting public places such as
restaurants and hairdressers
Adults in Scotland were most likely to give their personal contact details for
test and trace systems
Test and trace systems have been put in place in each country Great Britain, 9 to 13 September 2020
in Great Britain. As part of these systems, people who develop
symptoms of COVID-19 can be tested for the virus. If they test
positive, their recent close contacts can be traced.
For adults who had visited public indoor places such as
restaurants or hairdressers this week, 31% said they were
always asked to provide their personal details for the test and
trace service, but 26% said they were never asked.
This varied by country: in England, 27% said they were always
asked, but 27% said they were never asked. In Wales, it was
45% and 23% respectively and in Scotland it was 66% and 12%
respectively.
Of those who were asked to provide their details, 69% said they
did so every time, but 11% said they rarely or never did provide
their personal contact details. This also varied by country with 1.Question: "How often did you provide your personal contact details for the test and trace
87% of adults in Scotland who had been asked to provide their service?" 2.Base population: adults that had been asked to provide their details to the track and
trace service after visiting places such as restaurants or hairdressers.
details said they had always done so, compared with 78% in 3.Results for "Don't know" for Wales and "Rarely" and "Don't know" for Scotland have been
Wales and 66% in England. suppressed because of small sample sizes.
Source: Opinions and Lifestyle Survey
Lead analyst: Ruth Davies
(policy.evidence.analysis@ons.gov.uk) 3 Preventative measuresAnxiety shows a further small increase this week, but other measures of personal
well-being remain stable Life Satisfaction Worthwhile
7.8 7.8
Mean scores for personal well-being 7.6 7.6
7.4 7.4
ratings 7.2 7.2
7 7
Great Britain, March to September 2020 with 6.8 6.8
February 2020 reference point (dashed line) 6.6 6.6
6.4 6.4
6.2 6.2
Question: "Overall, how satisfied are Anxious
you with your life nowadays?", Happiness 5.5
"Overall, to what extent do you feel that 7.8 5
7.6 4.5
the things you do in your life are 7.4 4
7.2
worthwhile?", "Overall, how happy did 7 3.5
6.8 3
you feel yesterday?", "Overall, how 6.6 2.5
anxious did you feel yesterday?". 6.4 2
6.2
Each of these questions is answered
on a scale of 0 to 10, where 0 is “not at
all” and 10 is “completely”.
Key trends on well-being 5-9 August 12-16 August 26-30 August 9-13 September
Percentage of adults that say they are somewhat or very worried about the effect the COVID-19 67 67 64 67
outbreak is having on their life right now
Percentage of adults that say their well-being is affected by the COVID-19 outbreak 40 41 39 39
Percentage of adults that say they are often/always or sometimes lonely 24 23 22 24
Source Opinions and Lifestyle Survey
Lead analyst: Ruth Davies
(policy.evidence.analysis@ons.gov.uk) 4 Well-beingSocial activities have decreased this week, following increases through the
summer
The percentage of adults who had left their home to eat or drink at a Levels of socialising, eating out and travel have decreased this week
restaurant, café, bar or pub decreased for the first time this week, following after increasing through the summer
Great Britain, May to September 2020
continued increases since early July. This week, 30% of adults said they had
done this activity, compared with 38% two weeks ago.
57% of adults said they had socialised with between one and five other people
from outside their household at the same time, and a further 13% said they
had socialised with six or more. Responses to the survey were collected
before new guidance came into effect on 14 September restricting the number
of people that could meet socially.
Key trends on leaving home 5-9 12-16 26-30 9-13
August August August September
Percentage of adults that left their home in 95 94 95 96
the past 7 days
Percentage of adults that feel safe or very 33 35 35 33
safe outside their home due to COVID-19
Percentage of adults that have left their 96 95 96 95
home and worn a face covering to prevent
the spread of COVID-191
1These estimates are based on adults who have worn a face covering at least once, over the past seven days, and
does not give an indication of how frequently people are wearing a face covering over the whole duration of the period. Source: Opinions and Lifestyle Survey
Lead analyst: Ruth Davies
(policy.evidence.analysis@ons.gov.uk) 5 Social impactsOver 6 in 10 (62%) working adults1 reported they had travelled to work (either
exclusively or in combination with working from home), while 20% had worked
exclusively at home between 9 and 13 September 2020
Between 9 and 13 September 2020: Over 6 in 10 working adults said they had travelled to work at some point in
the past seven days
• Half of working adults1 (50%) reported that the coronavirus (COVID- Great Britain, May to September 2020
19) pandemic was affecting their work, a similar percentage to two
weeks ago at 47%.
• There was a higher percentage of working adults who said they had
both worked from home and travelled to work (12% compared with 7%
two weeks ago).
• In total, over 6 in 10 (62%) working adults reported they had travelled
to work (either exclusively or in combination with working from home),
while 20% had worked exclusively at home.
• Among those who had worked from home, the main reasons were
their employer had asked them to do so (61%), they normally worked
from home (32%) and they were following government advice (28%).
1For this survey, a person is said to be a “working adult” if: they had a paid job, either as an
employee or self-employed; they did any casual work for payment; they did any unpaid or
voluntary work in the previous week.
Source: Opinions and Lifestyle Survey
Lead analyst: Ruth Davies
(policy.evidence.analysis@ons.gov.uk) 6 Travel to workEmployment rate rises slightly to 76.5%
The employment rate for all people increased by 0.4 percentage points on the
year to 76.5%, and was up 0.1 percentage points on the quarter
• Labour market figures for May to July 2020 show a rise in the UK employment rates (aged 16 to 64 years), seasonally adjusted, between January to
unemployment rate to 4.1%. Despite this and a rise in the March 1971 and May to July 2020
number of redundancies, the annual employment rate rose to
76.5% and was higher than the previous quarter. The economic
inactivity rate was at a joint record low of 20.2%.
• There has been a large decrease in the number of young
people in employment, while unemployment for young people
has increased.
• Redundancies rose by 58,000 on the year, and 48,000 on the
quarter, to 156,000. These are the largest annual and quarterly
increases seen since 2009.
• A possible contribution for the employment rate remaining
strong is the treatment of furloughed workers which are
considered as in employment.
• The number who are temporarily away from their jobs –
including those whose jobs have been furloughed – has fallen
but it was still more than 5 million in July 2020, with over 2.5
million of these being away for three months or more.
Source: Employment in the UK: September 2020
Lead analyst: Bob Watson
(labour.market@ons.gov.uk) 7 UK Labour MarketTotal actual weekly hours worked fall by almost 10%
• Between February to April 2020 and May to July 2020, total actual weekly hours
worked in the UK fell by 9.8%. Average actual weekly hours fell by 2.8 hours on Total hours worked still low but showing some signs of recovery
the quarter to 26.3 hours. However there are early signs of a recovery with total UK total actual weekly hours worked (people aged 16 years and over),
actual weekly hours rising to around 866 hours in May to July from around 849 in seasonally adjusted, between March to May 1992 and May to July 2020
April to June.
• Between May to July 2019 and May to July 2020, average actual weekly hours
worked fell by 5.8 hours. Decreases were observed in all industries apart from
agriculture, forestry, and fishing. The largest fall in average actual weekly hours
was in the accommodation and food service activities industry, with a fall of 15.4
hours per week in May to July 2020.
Vacancies:
• For June to August 2020, there were an estimated 434,000 vacancies in the UK.
This is almost 30% higher than the record low in April to June 2020. The increase
is driven by small businesses (49 or fewer employees).
• Estimated vacancies for August 2020 are still around 40% less than in February
2020.
• The industry that is closest to its February 2020 vacancy levels is transport and
storage, where estimated vacancies are around 10% less than in February 2020.
In contrast, estimated vacancies in August were around 75% less than in February
2020 in arts, entertainment and recreation.
Source: Employment in the UK: September 2020
Lead analyst: Debra Leaker & Laura Caldwell
(labour.market@ons.gov.uk)
7 UK Labour MarketSince March 2020 the number of payroll employees fell by 695,000
• Experimental estimates for August 2020 indicate that the number of payroll employees fell by 2.4% compared with March 2020. In August,
695,000 fewer people were in paid employment than in March 2020 and 36,000 fewer than in July 2020.
• Early estimates for August 2020 indicate that median monthly pay increased to £1,872, an increase of 2.7% when compared with the same
period of the previous year. Pay growth for April and May 2020 became negative, coinciding with the pandemic as well as related economic
and policy responses. More recently, pay growth has increased, but is still lower than pre-coronavirus levels.
• Claimant Count: Between July 2020 and August 2020, the Claimant Count increased by 73,700 (2.8%) to 2.7 million. Since March 2020, the
Claimant Count has increased by 120.8% or 1.5 million.
After rising for several years, the number of employees has fallen in recent months Median pay decreased sharply in April, but has recovered since June
Payrolled employees, seasonally adjusted, UK, July 2014 to August 2020 Median pay per month, seasonally adjusted, UK, July 2014 to August 2020
Source: HM Revenue and Customs – Pay As You Earn Real Time Information; Employment in the UK: September 2020
Lead analyst: Debra Leaker
(labour.market@ons.gov.uk) 7 UK Labour MarketCPIH 12-month inflation rate lowest since December 2015 at 0.5%
• The Consumer Prices Index including owner occupiers' housing Headline rate slows as a result of reduced prices for eating out
Contributions to change in the CPIH 12-month inflation rate, UK, between July and
costs (CPIH) 12-month inflation rate was 0.5% in August 2020,
August 2020
down from 1.1% in July, and was the lowest rate of inflation
since December 2015.
• The largest downward contribution came from restaurants and
hotels, and reflects the effect of the Eat Out to Help Out Scheme
and, to a lesser extent, the reduction in Value Added Tax from
20% to 5% on the hospitality sector.
• Clothing and footwear also provided a large downward
contribution. Typically, there have been large price falls between
May and July due to the summer sales season before prices rise
again in August. During 2020, there has been discounting since
lockdown began, leading to a smaller fall in prices in the summer
sales followed by a smaller rise in August.
• The largest upward contribution to the change in the CPIH 12-
month inflation came from recreation and culture. The main
contributors were games, toys and hobbies, particularly
computer game downloads. It is possible that prices have been
influenced by the lockdown changing the timing of demand and
the availability of items.
Source: Consumer price inflation, UK: August 2020
Lead analyst: Philip Gooding
(cpi@ons.gov.uk) 8 UK InflationRetail sales rise by 0.8% in August, the fourth consecutive month of growth
• In August 2020, retail sales volumes rose by 0.8% when compared Total retail sales recovered from the sharp falls experienced during the
coronavirus pandemic
with July; and an increase of 4.0% when compared with
Volume sales, seasonally adjusted, Great Britain, August 2013 to August 2020
February’s pre-pandemic level.
• In August 2020, retail sales values increased by 0.7% when
compared with July 2020 and 2.5% when compared with February
2020.
• In August 2020, there was a mixed picture within the different store
types as non-store retailing volumes were 38.9% above February,
2020 while clothing stores were still 15.9% below February’s pre-
pandemic levels.
• Home improvements continued to see a boost in spending with a
rise in August 2020 as sales volumes rose by 9.9% when
compared with February 2020.
• Online retail sales fell by 2.5% in August 2020 when compared
with July 2020, but sales were still 46.8% higher pre-pandemic
levels. Falls in monthly sales were across all sectors except
clothing and household goods.
• The falls in internet value sales may be due to many businesses
reopening from July 2020, resulting in less online spending in
August 2020.
Source: Retail sales, Great Britain: August 2020
Lead analyst: Rhian Murphy
(retail.sales.enquiries@ons.gov.uk) 9 UK Retail SalesAverage UK house prices rise by 3.4% in the year to June 2020
• Average house prices in the UK rose by 3.4% in the year to June
Since November 2017, UK house price growth has been consistently below 5%
2020, up from 1.1% in the year to May 2020. The average UK Annual house price rates of change for all dwellings, UK, January 2006 to June 2020
house price was £238,000 in June 2020; this is £8,000 higher
than in June 2019.
• On a seasonally adjusted basis, average house prices in the UK
increased by 2.4% between May and June 2020, following a
decrease of 0.1% in the previous month. This rise may partly
reflect the unusual conditions in the housing market during the
COVID-19 pandemic and movement restrictions put in place
from 23 March 2020.
• Property transactions completed during that time may have been
more concentrated among those without complicating factors
such as a chain. For example, first-time buyers may have been
freer to complete transactions than former owner occupiers, who
may have had to co-ordinate multiple sales during lockdown and
would also typically be at the lower end of the price scale than
former owner occupiers.
• The rise in prices in June 2020 may reflect pent-up demand
following the easing of lockdown restrictions, particularly at the
higher end of the price scale.
Source: UK House Price Index: June 2020
Lead analyst: Natalie Jones
(hpi@ons.gov.uk) 10 UK House PricesThe end of August 2020 has seen further recovery to imports/exports across all
workforce sizes
Businesses whose importing has not been affected Businesses who are importing, but less than normal
• The number of businesses of all sizes
50%
70% whose importing has not been affected
45%
60%
40% has been increasing since 1st June 2020.
50% 35%
30%
40%
25% • Both large businesses (250+ workforce)
30% 20% and small businesses (< 250 workforce)
15%
20%
10%
have shared a similar experience
10% 5% regarding exports, with businesses of all
0% 0%
1 Jun - 14 15 Jun - 28 29 Jun - 12 13 Jul - 26 27 Jul - 9 10 Aug - 23
sizes seeing an increase in those whose
1 Jun - 14 15 Jun - 28 29 Jun - 12 13 Jul - 26 27 Jul - 9 10 Aug - 23
Jun Jun Jul Jul Aug Aug Jun Jun Jul Jul Aug Aug exporting has not been affected from 1st
Businesses whose exporting has not been affected Businesses who are exporting, but less than normal
June 2020.
60% 60%
50% 50% • The number of both small businesses (<
40% 40% 250 workforce) and large businesses
30% 30%
(250+ workforce) who are importing but
less than normal has been declining
20% 20%
since 1st June 2020. Similarly, the
10% 10% number of both small businesses and
0% 0% large businesses who are exporting but
1 Jun - 14 15 Jun - 28 29 Jun - 12 13 Jul - 26 27 Jul - 9 10 Aug - 23 1 Jun - 14 15 Jun - 28 29 Jun - 12 13 Jul - 26 27 Jul - 9 10 Aug - 23
Jun Jun Jul Jul Aug Aug Jun Jun Jul Jul Aug Aug less than normal has been declining
since 1st June 2020.
Effect of COVID-19 on importing/exporting by workforce size, reported by businesses that experienced any of the listed challenges with importing/exporting
in the two weeks prior to the survey, from 1 June to 23 August 2020.
Source: Business Impact of COVID-19 (BICS) results: BICS Wave (all waves)
Lead analyst: Lucy Parker
(bics@ons.gov.uk)
11 UK Trade10% of the workforce remain on furlough leave, with 71% of furloughed
employees receiving top ups to their pay
Proportion of businesses by trading status, and proportions of workforce on
furlough leave and receiving wage top-ups, 24 August to 6 September 2020, UK • 77% of all responding businesses had applied for the Coronavirus
Job Retention Scheme (CJRS); 10% of the workforce in all
businesses had been furloughed.
• 40% of businesses who had furloughed staff were providing pay
top-ups to the Coronavirus Job Retention Scheme, covering 71%
of the furloughed workforce.
• Of businesses currently trading, 40% reported that they had less
Cash reserves, 24 August to 6 September 2020, UK than six months of cash reserves and 3% reported they had no
cash reserves. The corresponding figures for businesses who had
paused trading were 46% and 14% respectively.
Proportion of businesses applying to government schemes, 24 August to 6
September 2020, UK
Note: The proportion of the furloughed workforce receiving top-ups to their pay in this
period will be affected by the change to the furlough scheme; as from 1 September all
employers must contribute 10% on top of the government’s 70% contribution. However,
businesses may have referred to the reference period of the previous 2 weeks, which
included 8 days in August.
Source: Coronavirus and the latest indicators for the UK economy and society: 17
September 2020
Lead analyst: Jon Gough
(bics@ons.gov.uk) 12 Business impactTurnover below expectations for 46% of businesses
Nearly half (46%) of currently trading businesses reported that their turnover
• Almost half (46%) of currently trading businesses reported that
had decreased below what is normally expected for this time of year
their turnover had decreased below what is normally expected for Percentage of businesses currently trading, 24 August to 6 September 2020, UK
this time of year.
• Whilst around 13% reported that turnover had risen relative to
expectations for this time of the year.
Use of Government Support measures:
• Nearly half (47%) of businesses that had not permanently ceased
trading are deferring VAT payments, and over a fifth (22%) are
making use of business rates holidays.
• 13% are using HMRC’s Time to Pay scheme, and 9%
participated in the Eat Out to Help Out scheme.
Risk of insolvency:
• Of businesses that had not permanently ceased trading, 11%
said that they were at moderate or severe risk of insolvency. 48%
of businesses said they were at low risk, and 30% said they were
at no risk.
Note: The percentages in this table might not sum to 100% due to rounding
Source: Coronavirus and the latest indicators for the UK economy and society: 17 September 2020
Lead analyst: Jon Gough
(bics@ons.gov.uk) 12 Business impactAverage daily company incorporations rise above the Quarter 3 average
• In the week starting Saturday 5 September, there was an average of 3,083 company incorporations per working day, which is above the Quarter 3
average (2,612).
• The observed fluctuations in weekly incorporations per working day between April to early May 2020 and June to the end of July 2020 coincide
with government instigated lockdown measures and the subsequent easing of them in response to the COVID-19 pandemic. This is in line with
official statistics published by Companies House on 30 July 2020.
• In the week starting Saturday 5 September, there was an average of 1,004 voluntary dissolution applications per working day, which is consistent
with the Quarter 3 2019 average (1,008).
In the week starting Saturday 5 September, there was an average of 3,083 company incorporations and 1,004 voluntary dissolutions applications
per working day
Company incorporations and voluntary dissolutions per working day, UK, quarterly and weekly, Q1 2019 to Q2 2020, and w/c 29 Feb 2020 to w/c 5 Sept 2020
Source: Companies House; Coronavirus and the latest indicators for the UK economy and society: 17 September 2020
Lead analyst: Chloe Gibbs
(faster.indicators@ons.gov.uk) 13 Company impactPrices of items in the food and drink basket fall in the latest week
Prices of items in the food and drink basket decreased by 0.1% in the latest
• Online prices of items in the food and drink basket marginally fell week, driven by several categories such as bread and cereals and vegetables
overall by 0.1% in the latest week. Contributions to online price change of a selection of food and drink products, UK,
percentage point contributions to the percentage change between Week 14 (31
• The largest contributions to the decline in prices in the latest week August to 6 September) and Week 15 (7 September to 13 September)
were seen in the following: bread and cereals (with a weekly price
decrease of 0.6%); and vegetables (with a weekly price decrease of
0.3%).
• These downward contributions were partially offset by an overall
price rise for milk, cheese and eggs (that showed a weekly price
increase of 0.5%) driven by a rise in the majority of items in this
category.
• The all item index remains below the starting point of the series (1
June), with the overall index at 1.3% lower. Oils and fats have had
the largest reduction in price since the series began, now 4% lower.
Wine has shown the largest increase since the series began, now
1.5% above the starting point of the beginning of June, although
prices have fallen slightly in the latest week.
Note: A timely indication of weekly price change for a selection of food and drink
products from several, large UK retailers has been developed, covering the period
1 June to 13 September 2020. This analysis is experimental and should not be
compared with our regular consumer price statistics. Source: Coronavirus and the latest indicators for the UK economy and society: 17 September 2020
Lead analysts: Helen Sands; Tanya Flower
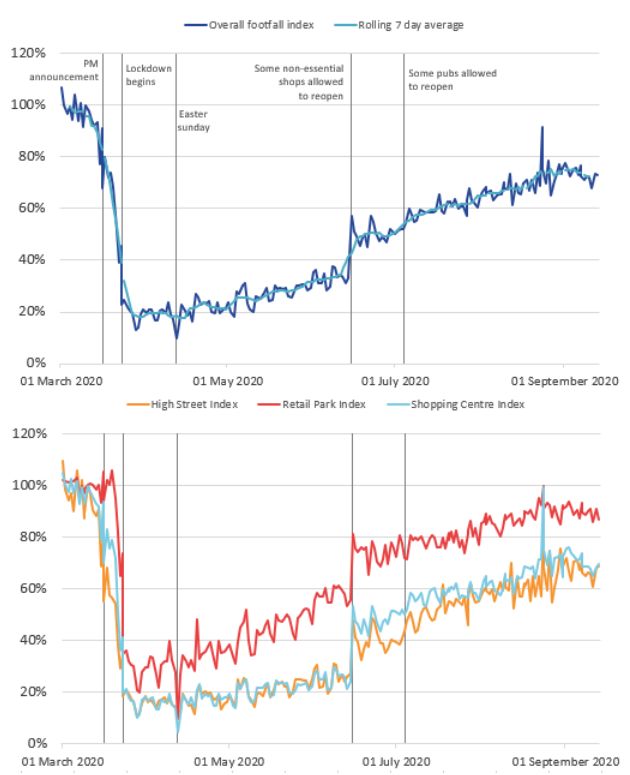
(cpi@ons.gov.uk) 14 Online pricesVolume of footfall, year-on-year percentage change between footfall
Overall footfall falls in all types of retail on the same day, UK, 1 March to 13 September 2020
location
• In the week commencing 7 September, overall footfall fell
slightly compared to the previous two weeks, driven by
reduced footfall in all types of retail location.
• In the week commencing 7 September, average overall
footfall fell to around 72% of its level the same day a year
ago, from around 75% in the previous two weeks. The
categories of high streets, shopping centres and retail parks
all contributed to this decline, with footfall in each declining
between 1 and 3 percentage points.
Source: Springboard and the Department for Business, Energy and Industrial Strategy;
Coronavirus and the latest indicators for the UK economy and society: 17 September 2020
Lead analyst: Chloe Gibbs
(faster.indicators@ons.gov.uk) 15 Consumer behaviourTotal online job adverts rise from 50% to 53% of their 2019 average
Between 4 and 11 September, total online job adverts increased from 50% to 53%
• The three percentage point increase in the volume of online job
of their 2019 average
adverts in the last week was spread evenly across the Adzuna Total weekly job adverts on Adzuna, UK, 4 January 2019 to 11 September 2020, index
categories, with an increase in 24 of the 28 categories. 2019 average = 100
• In particular, the volume of online job adverts in the IT,
computing and software category rose seven percentage points
to 64% of its 2019 average, its highest level since 17 April.
Online job adverts also increased five percentage points in
wholesale and retail, and four percentage points in healthcare
and social care, partially offsetting the previous week’s
decrease.
Regional breakdowns:
• In the latest week, every region and country of the UK except
Yorkshire and The Humber saw a rise in the volume of online
job adverts.
• The largest increase in online job adverts in the latest period
was in Northern Ireland, where they increased six percentage
points. The only decrease was in Yorkshire and The Humber,
where online job adverts decreased one percentage point.
Source: Adzuna; Coronavirus and the latest indicators for the UK economy and society: 17 September 2020
Lead analyst: Chloe Gibbs
(faster.indicators@ons.gov.uk) 16 Online job advertsBetween 7 and 13 September counts of cars, pedestrians and cyclists in London
Counts of cars, pedestrians and cyclists were around 5% above the average level seen immediately pre-lockdown (11 to
22 March)
in London continue to grow Activity in selected areas, daily counts of cars, buses, pedestrians and cyclists,
seasonally adjusted, March to September 2020, UK
• Between 7 and 13 September counts of cars, pedestrians
and cyclists in London were around 5% above the average
level seen immediately pre-lockdown (11 to 22 March).
• Average daily counts of cars, pedestrians and cyclists in
the North East have remained around 95% above their
average pre-lockdown level (an average of 1 March to 22
March for the North East).
• In Northern Ireland, although data collection didn't start until
15 May 2020, the data continue to show a gradual increase
in cars and pedestrians and cyclists. This trend is also
observed across Manchester, Durham and Southend.
Note: (1) The chart shows selected regions from our published dataset which includes other regions as
well.
(2)Traffic camera images capture the appearance of buses but they give no indication of the number of
passengers using public transport.
Source: Transport for London, North East Traffic, TrafficWatchNI; Coronavirus and (3) In this release, North East traffic data contains a higher than usual number of missing images and
the latest indicators for the UK economy and society: 17 September 2020 hence imputations, which is likely to lead to revisions in future weeks.
Lead analyst: Chloe Gibbs
(faster.indicators@ons.gov.uk) 17 Road trafficRoad traffic has been gradually recovering towards pre-lockdown levels
On Monday 14 September, all motor vehicle traffic was three per cent below traffic
• Road traffic across all motor vehicles has continued to
seen in February, the highest recorded since the Prime Minister's announcement on
gradually return to levels seen in the first week of February Monday 16 March
2020 following a lockdown low point around the end of Daily road traffic index: 100 = same traffic as the equivalent day of the week in the first
March. (Department for Transport estimates) week of February, 1 March 2020 to 14 September 2020, non-seasonally adjusted
• On Monday 14 September, heavy vehicle traffic was five
per cent higher than traffic seen on the equivalent Monday
in the first week of February. Car traffic remained below the
levels seen in the first week of February, but over the last
few months it has increased from around thirty per cent
below February traffic levels to around seven per cent
below.
Shipping:
• Between 7 and 13 September, the average volume of daily
ship visits was 324, compared with an average of 377 in
the week immediately before lockdown (16 to 22 March).
• Between 7 and 13 September, the average daily volume of
visits for cargo ships was 100 ships a day, compared with
an average of 126 in the week immediately before
lockdown (16 to 22 March)
Source: Department for Transport – Road traffic statistics: management information; Coronavirus and the latest indicators for the UK economy and society: 17 September 2020
Lead analyst: Chloe Gibbs
(faster.indicators@ons.gov.uk) 17 Road trafficNews
ONS blogs
• How the COVID-19 Pandemic has accelerated the shift to online spending
• Measuring the UK housing market?
Government announcements and news related to COVID-19
• Statement by the Secretary of State for Health and Social Care on coronavirus and the government’s plans for winter: Matt Hancock outlined the government’s plans to combat COVID-19
this winter in England.
• Adult social care winter plan announced: plan to help curb COVID-19 infections in care settings during the winter in England.
• More than £500 million for social care to reduce coronavirus transmission over winter: extension of the Infection Control Fund to provide more resources to the care sector, as part of the
adult social care winter plan in England.
• Hospitality and leisure venues will be required to enforce the rule of 6: regulations for businesses to maintain social distancing measures and record customer contact details, with fines for
failing to comply.
• Stronger measures introduced in parts of the North East to tackle rising infection rates: new restrictions introduced as the North East becomes the area with the second highest number of
cases in England, after the North West.
• Local restrictions imposed to control Rhondda Cynon Taf outbreak: second area in Wales to impose restrictions, following a spike in coronavirus cases.
• Film & TV Production Restart Scheme – Draft Rules: scheme to support the recommencement of film and television production in the UK to aid the lack of availability of insurance
coverage.
• New Lighthouse labs to boost NHS Test and Trace capacity: two new Lighthouse labs in Bracknell and Newcastle to increase testing capacity.
• The future of public health: the National Institute for Health Protection and other public health functions: overview of government plans to reorganise public health provision in England,
including the creation of the National Institute for Health Protection.
COVID-19 guidance
• Changes to the Coronavirus travel corridor countries list : Guadeloupe and Slovenia have been removed from the travel corridor exempt list, and Singapore and Thailand have been added
to the list of countries from where you may not need to self-isolate on your arrival in England.
• Birmingham, Sandwell and Solihull local restrictions: restrictions imposed in Birmingham City Council area, and Sandwell and Solihull Metropolitan Borough Council areas.
• Bolton: local restrictions: restrictions imposed in the Bolton Metropolitan Borough Council area.
18 AnnouncementsYou can also read