2019 Nine Month Results - Investor Presentation 29 October 2019 - Campari Group
←
→
Page content transcription
If your browser does not render page correctly, please read the page content below
2019 Nine Month
    Results
   Investor Presentation

     29 October 2019
Table of contents
Results Summary

Sales Results
‒ By region
‒ By brand

Consolidated P&L

Net Financial Debt

New marketing initiatives & developments

Conclusion & Outlook

Annex

                                                                                     2

                                           Results for the nine months ended 30 September 2019
Results for nine months ended 30 September 2019
Continued positive growth across organic topline and profit indicators

                                                              9M 2019 (1)                                          Change vs. 9M 2018                                                    Q3 2019
               Key figures                           € million % on sales                   Reported               Organic                FX            Perimeter       (2)
                                                                                                                                                                                     Organic change

Net sales                                              1,303.8          100.0%                 +8.6%                +6.9%               +2.6%                -0.9%                        +4.9%
of which: Global priorities                                                                                          +8.2%                                                                 +5.5%
         Regional priorities                                                                                         +5.3%                                                                 -4.2%

Gross profit                                            808.6            62.0%               +10.5%                +8.3%                +2.4%                -0.2%                         +6.1%
                                     (3)
   margin accretion (bps)                                                                    +110bps               +80bps              -10bps               +40bps                        +70bps

EBIT adjusted (4)                                       288.0            22.1%                +11.1%               +9.9%               +1.9%                 -0.7%                         +8.9%
                                     (3)
   margin accretion (bps)                                                                     +50bps               +60bps              -20bps               +10bps                        +90bps

EBITDA adjusted (4)                                     340.3            26.1%               +13.5%                +12.2%              +1.9%                 -0.6%                        +11.4%
                                     (3)
   margin accretion (bps)                                                                    +110bps              +120bps              -20bps               +10bps                       +160bps

                                           (5)
Group pre-tax profit adjusted                           259.0            19.9%                +10.0%

                               (1)
Net Debt at period end                                  874.4

         (1)    Application of IFRS 16-’Leases’ (effective 1 January 2019)
         (2)    Mainly including the effects of termination of agency brand contracts
         (3)    Basis points rounded to the nearest ten
         (4)    EBIT and EBITDA bef ore negative operating adjustments of €(13.9) million in 9M 2019, mainly attributable to restructuring operations. 9M 2018 had positive operating adjustments of €12.3
                million
         (5)    Group pre-tax prof it before negative adjustments of €(13.9) million in 9M 2019. In 9M 2018 overall adjustments of €13.9 million of which €1.6 million were financial adjustments

                                                                                                                                                                                                         3

                                                                                                                                                 Results for the nine months ended 30 September 2019
Key highlights
   Overall positive growth, despite a tougher Q3 comparable, driven by Global Priorities

> Net Sales      •   Solid organic grow th in 9M (+6.9%) w ith positive grow th in Q3 (+4.9%) despite the tough com parable base (Q3 2018: +8.9%), as w ell
                     as poor w eather conditions in Northern Europe
                            — By brand: Global Priorities continuing to outperform (+8.2% in 9M), mainly driven by Aperol and brow n spirits. Regional
                               priorities up +5.3% in 9M, thanks to Espolòn w hile Local Priorities w ere up +5.2%, largely thanks to the single serve aperitifs
                               (Crodino and Cam pari Soda)
                            — By geography: good perform ance in high-m argin m arkets, driven mainly by the US, Western and Central Europe. Emerging
                               markets continued to recover mainly thanks to a favorable comparison base
                 •   Reported change of +8.6%, reflecting a negative perim eter effect of -0.9% or €(10.9) m illion and a positive FX effect of +2.6% or
                     €31.0 m illion

> EBIT           •   EBIT adjusted
                        -   Organic grow th of +9.9%, ahead of organic sales grow th (+60 bps m argin accretion), driven by strong organic gross m argin
                            expansion of +80 bps in 9M 2019, thanks to positive sales mix by brand and market, after a neutral margin contribution from A&P and
                            slightly dilutive effect of SG&A (-20 bps). Very positive EBIT margin expansion in Q3 (+90 bps) enhanced by phasing effects
                        -   On a reported basis change of +11.1%, taking into account the negative effects of disposals of -0.7% or €(1.8) m illion and
                            positive FX of +1.9% or €4.8 m illion

> Group          •   Group pre-tax profit adjusted (1) to €259.0 million, up +10.0% at 19.9% of sales
pre-tax profit
                 •   Group pre-tax profit reported to €245.1 million, dow n -1.7%

> Net debt       •   Net financial debt at €874.4 m illion as of 30 September 2019 vs. €846.3 million as of 31 December 2018 up €28.1 m illion, entirely
                     driven by the incremental debt generated by the adoption of IFRS16-’Leases’(2) . Excluding such effect, the net financial debt w ould have
                     decreased by €53.1 million, thanks to the positive cash flow generation and after the dividend pay ment of €57.3 million and the net
                     purchase of ow n shares of €27.2 million

                 •   Net debt to EBITDA pro-form a ratio at 1.9 tim es as of 30 September 2019

                                (1)   Group pre-tax prof it before total adjustments of €(13.9) million in 9M 2019. Total positive adjustments of €13.9 million in 9M 2018
                                (2)   Please ref er to slide 25 f or details on the net financial debt                                                                             4

                                                                                                                                          Results for the nine months ended 30 September 2019
Positive organic sales growth
Continued positive growth across all regions and brand clusters

                         By Region                                                             By Brand

>   Americas: solid growth driven by the core US market, up       >   Global Priorities: strong 9M performance, against a tough
    +6.0%, and Jamaica +17.3%                                         comparable base (9M 2018: +10.3%). Positive growth in Aperol,
                                                                      the Jamaican rums, Wild Turkey and Campari. Shipments driven
>   SEMEA: Italy up +8.4%, with good growth across the rest of        decline in Grand Marnier and weakness in SKYY Vodka, albeit
    the region                                                        with improving trends
>   NCEE: solid growth across the region driven by Germany, the   >   Regional Priorities: very positive performance from Espolòn and
    UK and Russia                                                     Riccadonna
>   Asia Pacific: overall positive growth, despite the tough      >   Local Priorities: positive growth across brand portfolio,
    comparison base (9M 2018: +16.3%), driven by Australia            particularly the single serve aperitifs

                                                                                                                                      5

                                                                                             Results for the nine months ended 30 September 2019
Table of contents
Results Summary

Sales Results
‒ By region
‒ By brand

Consolidated P&L

Net Financial Debt

New marketing initiatives & developments

Conclusion & Outlook

Annex

                                                                                     6

                                           Results for the nine months ended 30 September 2019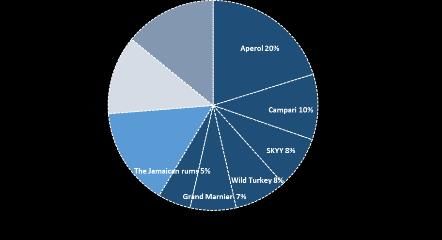
Net sales results for 9M 2019
Growth drivers

                                                           Organic change (1)
           % change                                             +6.9%                            +2.6%                       -0.9%

           €million                    1,200.6                       +83.2                      +31.0                       (10.9)                       1,303.8

                                                                                                                                        (3)

>         Organic change of +6.9% (after excluding the positive price effect in Argentina of 50bps) (1) or €83.2 million (+4.9% or €20.7 million in Q3
          2019), largely driven by the high-margin Global Priorities
>         Forex effect of +2.6% or €31.0 million, largely thanks to the strengthened US Dollar vs. Euro (2) (+3.0% or €12.9 million in Q3 2019)
          which more than offset weakness in emerging market currencies
>         Perimeter impact of -0.9% or €(10.9) million, due to the tail end termination effect of agency brands contracts (-0.1% or €(0.3) million in
          Q3 2019) (3)

    (1)    Starting f rom Q3 2018, following the inclusion of Argentina into the cluster of Hyperinflationary Economies, sales organic change in this country has been calculated to reflect only the volume change,
           theref ore excluding the price effect and the revaluation component required by IAS 29 (both included in FX effect)
    (2)    Av erage USD vs Euro of 1.124 in 9M 2019 and 1.089 in 9M 2018
    (3)    Does not include the effects generated by recent acquisitions of Bellonnie&Bourdillon Successeurs S.A, closed on 1 October 2019, and Licorera Ancho y Cia S.A.P.I. de C.V and Casa Montelobos
           S.A.P.I. de C.V nor the disposal of Villa Les Cédres which are expected to close by year end
                                                                                                                                                                                                                 7

                                                                                                                                                        Results for the nine months ended 30 September 2019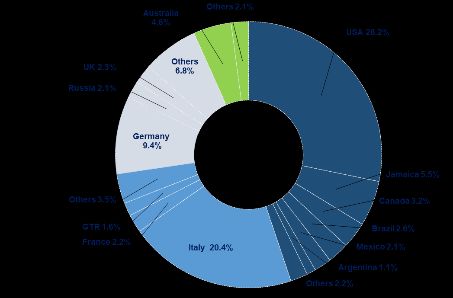
Net sales by regions & key markets in 9M 2019
   US remains the largest market with 28.2% of Group Net Sales

                                                  9M 2019 Group Net Sales €1,303.8 million
                                                                   Organic growth +6.9%

Asia Pac:   6.7% of total
             Organic growth: +0.9%

NCEE:       20.6% of total
            Organic growth: +8.3%                                                                                                        Americas: 44.8% of total
                                                                                                                                                   Organic growth: +6.5%

SEMEA:      27.8% of total
            Organic growth: +8.1%

                                               Developed vs. emerging markets(1): 82% vs. 18%

                             (1)   Key emerging markets include Jamaica, Russia, Brazil, Argentina, Mexico, South Africa, Peru and Nigeria                                     8

                                                                                                                                     Results for the nine months ended 30 September 2019
Americas
Americas: +6.5% organic 44.8%
% change +6.5% +5.9% -0.1%
Regional net sales organic grow th
€million 520.3 +34.0 30.8 (0.4) 584.7 by quarter
Q1 Q2 Q3
2019 13.1% 7.3% 0.5%
2018 2.9% 6.0% 4.7%
Organic grow th by key m arket in 9M
> US +6.0% • Overall positive grow th in the US market in 9M, after shipment normalization in Q3, as indicated. Wild Turkey, Aperol (+44.6%),
Cam pari and the Jam aican rum s continued their positive trend w hile SKYY continued to reduce the gap to more favourable sell-out
trends
> Jamaica +17.3% • Continued strong performance in Jam aica w ith positive m ix driven by core Wray&Nephew Overproof (+22.9%), Appleton Estate
(+50.2%), Magnum Tonic Wine (+23.4%) and Cam pari (+6.4%)
> Brazil +6.5% • Positive grow th in the nine months, w ith continued grow th into Q3 despite the tough comparison base (Q3 2018: +36.9%), driven by a
positive performance from Aperol and Cam pari as w ell as local brand Dreher. Macroeconom ic w eakness, high unem ployment rates
and political instability continue to impact the Brazilian market
> Others +2.1% • Canada grew positively (+3.4%), largely thanks to Aperol, Cam pari and Espolòn. Mexico also grew , largely thanks to SKYY ready-to-drink
and Aperol. Argentina registered a positive performance (+5.5%) largely due to grow th in SKYY, Old Sm uggler and Aperol. Macro
conditions remain uncertain. Other m arkets in South Am erica grew thanks to Aperol and Riccadonna
9
Results for the nine months ended 30 September 2019(1)
SEMEA: +8.1% organic
SEMEA
27.8%
% change +8.1% -0.1% -3.0%
Regional net sales organic grow th
€million 345.7 +27.9 (0.4) (10.5) 362.6 by quarter
Q1 Q2 Q3
2019 6.4% 8.6% 8.9%
2018 1.1% 6.3% 9.6%
(2)
Organic grow th by key m arket in 9M
> Italy +8.4% • Very solid performance with acceleration in Q3 (+12.5%), largely driven by the aperitifs portfolio: double-digit grow th of Aperol
(+15.1%), continued positive grow th of Cam pari (+8.5%) as w ell as continued positive trends in local brands such as Crodino
(+5.6%) and Cam pari Soda (+6.7%)
> Others +7.2% • France grew positively by +10.3%, despite the tough comparison base, thanks to double-digit grow th of Aperol and Riccadonna.
Spain w as positive driven by Aperol (+21.4%), almost offset by w eakness in Bulldog affected by a very competitive Gin market. In the
African markets, Nigeria grew +34.4% thanks to a strong performance of Cam pari and Am erican Honey and South Africa also grew
thanks SKYY and Bulldog
• Global Travel Retail declined -0.8% against a difficult comparison base (9M 18 +13.0%) despite positive trends in Aperol and
GlenGrant
(1) Incl. Global Trav el Retail
(2) Perimeter effect in Italy driven by agency brand distribution termination 10
Results for the nine months ended 30 September 2019NCEE: +8.3% organic NCEE
20.6%
% change +8.3% +0.5% -0.0%
Regional net sales organic grow th
€million 247.1 +20.4 +1.2 (0.1) 268.7 by quarter
Q1 Q2 Q3
2019 11.6% 4.2% 10.4%
2018 -3.8% 14.4% 13.9%
Organic grow th by key m arket in 9M
> Germany +5.7% • Good grow th in Germ any, w ith an acceleration in Q3 (+8.7%), largely driven by double-digit grow th of Aperol (+17.1%) as the
brand continues to leverage new consumption occasions, as w ell as positive trends in Averna, SKYY, Crodino, Frangelico and
GlenGrant. This more than offset a temporary decline in Cam pari, due to both a price repositioning earlier in the year as w ell as
cycling a very tough comparable base from Q3 2018 (+22.5%)
> UK +27.9% • Solid grow th with acceleration in Q3 (+52.6%), driven by sustained grow th of Aperol (+23.1%) and the Jam aican brands
(+40.8%), largely Wray&Nephew Overproof and Magnum Tonic
> Russia +11.6 • Continued positive performance against an easy comparison base (9M 18 -16.5%) w ith positive grow th in Aperol and the
Cinzano portfolio in a highly volatile market
> Others +5.5% • Good perform ance across the rest of the region, mainly driven by Aperol
11
Results for the nine months ended 30 September 2019Asia
Asia Pacific: +0.9% organic Pacific
6.7%
% change +0.9% -0.7% 0.0%
Regional net sales organic grow th
€million 87.6 +0.8 (0.6) 0.0 87.8 by quarter
Q1 Q2 Q3
2019 -3.1% 4.9% 0.7%
2018 17.8% 11.7% 19.2%
Organic grow th by key m arket in 9M
> Australia +3.7% • Overall a very satisfactory performance, despite the tough comparison base (9M 18 +12.9%), driven by grow th in Wild Turkey
ready-to-drink and Aperol w hich continues its double-digit trend (+34.2%), SKYY and Espolòn
> Others -4.8% • Decline overall largely against tough comparison bases in both Japan (9M 18 +30.2%) and China (9M 18 +32.7%)
12
Results for the nine months ended 30 September 2019Net sales by key brand
9M 2019 Group Net Sales €1,303.8 million
Organic growth +6.9%
Rest of Portfolio: 14%
(-100bps v s. 9M 2018)
Agency brands & Co-packing 6%
Rest of own brands 8%
Local Priorities, 12%
Organic change: +5.2% Global Priorities, 59%
(+100bps vs 9M 2018)
Organic change: +8.2%
Regional Priorities,15%
Organic change: +5.3%
13
Results for the nine months ended 30 September 2019Brand sales review
Global priorities
Global priorities Brand sales as % Organic Organic
of Group’s sales change change
in 9M 2019 in 9M 2019 in Q3 2019
> Continued double-digit growth in the brand’s top three
markets: Italy +15.1%, Germany +17.1% and the US +44.6%
20% +21.8% +21.5% > Strong double-digit growth in high potential and seeding
markets such as Russia, France, the UK, GTR, Spain,
Australia, Scandinavia and Eastern Europe
> Solid growth in the brand’s core market Italy (+8.5%) and
double-digit growth in the US, Brazil and Nigeria
10% +5.0% +3.5% > Negative performance in Germany due to both price
repositioning earlier in the year as well as a tough comparable
base, while France, Russia and Spain were also soft
> The key US declined by -4.5% overall due to continued destocking
mainly affecting flavours which are down double-digit, in a market
with persistent competitive pressure. The core SKYY Vodka was
8% (1) -2.6% -1.9% flat in Q3 and continues to close the gap to more favourable sell-
out trends
(1) including SKYY Infusions > Positive growth in international markets (26% of total SKYY
sales) such as Australia, Germany, South Africa and Mexico
14
Results for the nine months ended 30 September 2019Brand sales review
Global priorities
Global priorities Brand sales as % Organic Organic
of Group’s sales change change
in 9M 2019 in 9M 2019 in Q3 2019
> Overall negative performance driven by a shipment
7% -4.3% -14.7% decline in Q3 in the core US market, despite positive
Nielsen and Nabca sell-out trends, while Canada remains
weak due to a price increase earlier in the year
> Good overall growth in Wild Turkey bourbon, up +4.7% despite
a tough comparison base (9M 18: +14.3%) driven by the core US
market (+8.1%) thanks to high-end offerings (Longbranch).
8% (1)(2) +6.7% -1.1% Positive growth in seeding markets (the UK, Italy, Germany)
was offset by temporary weakness in Australia and Japan due to
(1)
phasing
Incl. Wild Turkey straight bourbon, Russell's
Reserve, Longbranch, American Honey > High-margin Russell’s Reserve grew double-digits, driven by
(2) Wild Turkey ready-to-drink and American
the core US market (+15.1%)
Honey ready-to-drink are excluded
> American Honey registered double-digit growth driven by the core
US market and high potential Nigeria
> Wray&Nephew Overproof grew +13.8% thanks to continued
solid trends in core markets of Jamaica, the US and the UK as
5% (1) +6.2% +4.8% well as in seeding markets such as Canada
> Appleton Estate was flattish overall due to temporary
weakness in core Canadian market largely due to a tough
(1) Incl. Appleton Estate and W&N Overproof comparison base in Q3 and in Mexico, while other core markets
such as Jamaica and the US were positive
15
Results for the nine months ended 30 September 2019Brand sales review
Regional priorities
Regional priorities Brand sales as % Organic Organic
of Group’s sales change change
in 9M 2019 in 9M 2019 in Q3 2019
Tequila
> Continued double-digit growth in the nine months despite
4% +24.9% -11.7% negative phasing in core US market in Q3. Nielsen and Nabca sell-
out trends remain at strong double-digits, continuing to outpace
the category
> Seeding markets such as Australia, South Africa, Canada, Italy
and Russia continue to grow positively
> Soft performance due to a combination of gin market pressure
Gin
in core Spanish and Belgian markets as well as the temporary
1% -0.9% +3.0% effect of price increases in other regions. Strong growth in
South Africa
> Overall negative results reflecting the Group’s long-term
1% -9.9% -7.9% strategic refocus on higher-margin and longer-aged
premium expressions
Whiskies
1% +0.6% +0.1% > Flattish performance in the core market of Canada
16
Results for the nine months ended 30 September 2019Brand sales review
Regional priorities
Regional priorities Brand sales as % Organic Organic
of Group’s sales change change
in 9M 2019 in 9M 2019 in Q3 2019
> Flattish performance by Frangelico as positive growth in the
Italian bitters and
core US and Germany was offset by weakness in Spain and
GTR
liqueurs
> Averna registered a soft performance in core Italy which was
4% -0.4% -3.1% more than offset by growth in Germany, the US and Austria
> Slight decline in Cynar as solid growth in core Italy and
seeding US was offset by declines in Brazil and Switzerland
> Overall decline in Braulio due to a robust price increase in
core Italy
> Vermouth declined (-8.9%) as positive growth in the core
Russian market was offset by declines in Germany due to a
delisting and other European markets ahead of price repositioning
3% (1) -3.9% -9.4%
Sparkling wine &
> Sparkling wines flattish as weakness in the core markets of
Germany and Italy, was partly offset by growth mainly in Russia
vermouth
(1)
Incl. Cinzano verrmouth and
Cinzano sparkling wines and China
> Weakness in Mondoro (-8.3%) driven by the core market of
Russia
2% +11.7% +3.1% > Riccadonna registered positive results of +23.3% thanks to
a double-digit growth in the core market of France
17
Results for the nine months ended 30 September 2019Brand sales review
Local priorities
Local priorities Brand sales as % Organic Organic
of Group’s sales change change
in 9M 2019 in 9M 2019 in Q3 2019
3% +6.7% +9.6% > Strong performance in core Italian market benefitting from
a new marketing campaign
> Continued positive performance in core Italy, with acceleration
in Q3 partly thanks to an easier comparison base. Strong
3% +6.0% +12.3% growth across seeding European markets (now 13% of sales)
such as Benelux, Germany, Switzerland and the Czech
Republic
2% +3.9% +5.8% > Good performance in core Australia and New Zealand
1% +4.0% +4.1% > Positive overall performance in core Brazilian market
> Overall positive driven by Germany and the US
1% +1.6% +3.0%
1% +5.6% +5.1% > Positive growth driven by core US
18
Results for the nine months ended 30 September 2019Table of contents
Results Summary
Sales Results
‒ By region
‒ By brand
Consolidated P&L
Net Financial Debt
New marketing initiatives & developments
Conclusion & Outlook
Annex
19
Results for the nine months ended 30 September 20199M 2019 consolidated P&L
(1) COGS = cost of materials, production and logistics expenses
(2) SG&A = selling, general and administrative expenses
(3) Bps rounded to the nearest ten
20
Results for the nine months ended 30 September 2019EBIT adjusted - Key highlights
> Gross profit: on a reported basis up +10.5%in value, to 62.0% on sales (+110 bps accretion):
Organic growth of +8.3% in value, +80 bps margin expansion in the nine months driven by favourable sales mix by
brand and market. Strong third quarter (+70 bps) thanks to the sustained performance of the aperitifs business
(particularly the single-serve aperitifs in Italy), which largely offset a lower than expected dilution from agave due to the
order phasing of Espolòn into Q4
Forex and perimeter combined effect of +2.2% in value, +30 bps margin expansion, driven by termination of low-
margin agency brands
> A&P: on a reported basis up +10.2%in value, to 17.8% on net sales (-30 bps dilution)
Organic growth of +6.9% in value, in-line with topline growth and therefore neutral on margin, driven by phasing in Q3
ahead of Q4 peak season for marketing investments
Forex and perimeter combined effect of +3.3% in value, -30 bps margin dilution, driven by the termination of low A&P-
intensity agency brands
> SG&A: on a reported basis up +10.1%in value, to 22.1% on net sales (-30 bps dilution)
Organic growth of +7.8% in value, slightly above topline growth, leading to -20 bps margin dilution in 9M due to higher
investments in sales capabilities (-20 bps in Q3)
Forex and perimeter combined effect of +2.3% in value, -10 bps margin dilution, primarily driven by the deconsolidation
of businesses carrying no structure costs
> EBIT adjusted: on a reported basis up +11.1%in value, to 22.1% on net sales (+50 bps accretion)
Organic growth of +9.9% in value, well above topline growth, generating +60 bps margin accretion, thanks to solid
organic gross margin accretion (+80 bps), net of investments in sales capabilities (-20 bps). The adoption of IFRS16-
‘Leases’ accounting principle from 1 January 2019 generated a positive effect of €1.3 million. Very positive EBIT margin
expansion in Q3 (+90 bps) enhanced by phasing effects
Forex and perimeter combined effect of +1.2% in value, corresponding to -10 bps margin dilution
> EBITDA adjusted: on a reported basis up +13.5% in value, to 26.1% on net sales. The increase includes a positive effect
generated by the adoption of IFRS 16-‘Leases’ of €11.4 million, driven by the replacement of lease costs with depreciation
on the rights of use
Organic growth of +12.2% in value, leading to +120 bps margin accretion
Forex and perimeter combined effect of +1.3% in value, -10 bps margin dilution
21
Results for the nine months ended 30 September 2019EBIT adjusted – summary effects
€ million 25.8 4.8 (1.8)
% change +9.9% +1.9% -0.7%
259.2 +11.1% 288.0
+50 bps
% on sales (1) 21.6% +60 bps (20) bps +10 bps 22.1%
> EBIT adjusted of €288.0 million, up +11.1% on a reported basis, 22.1% margin on sales (+50 bps accretion). Key drivers:
• Organic growth of +9.9%, ahead of topline growth (+60 bps accretion), thanks to strong gross margin expansion (+80 bps) more
than offsetting higher investment in sales capabilities (-20 bps)
• FX effect of +1.9% or €4.8 million (-20 bps accretion)
• Perimeter effect of -0.7% or €(1.8) million (+10 bps), largely due to termination of agency brand contracts
> EBIT of €274.1 million, up +1.0%, due to unfavourable comparison base of net operating adjustments (negative amount of €(13.9)
million in 9M 2019, due to restructuring, vs. positive amount of €12.3 million in 9M 2018) due to the capital gain of the sales of
Lemonsoda, net of provisions for restructuring costs
> EBITDA adjusted of €340.2 million, up +13.5% overall, at 26.1% margin on sales
(1) Bps rounded to the nearest ten
22
Results for the nine months ended 30 September 20199M 2019 Consolidated P&L – Group pre-tax profit
9M 2019 9M 2018
Reported
€million % of sales €million % of sales Change
Operating profit = EBIT 274.1 21.0% 271.5 22.6% 1.0%
Net financial income (charges) (25.4) -1.9% (22.4) -1.9% 13.3%
Financial adjustments (charges) (0.0) 0.0% 1.6 0.1% -100.1%
Put option costs (3.7) -0.3% (1.2) -0.1% 205.1%
Share of profit (loss) of associates and joint ventures 0.1 0.0% (0.1) 0.0% -224.7%
Group pre-tax profit 245.1 18.8% 249.4 20.8% -1.7%
Group pre-tax profit adjusted 259.0 19.9% 235.5 19.6% 10.0%
> Financial charges were €25.4 million in 9M 2019, up by €3.0 million vs. 9M 2018 due to first time adoption of IFRS16-’Leases’
generating additional €2.5 million interest charges and the negative carry effect on excess cash
> Average cost of net debt at 4.1% (1) in 9M 2019, up from 3.1% in 9M 2018, due to the negative carry effect and the IFRS16-’Leases’
adoption
> Group pre-tax profit was €245.1 million down -1.7% in 9M 2019
> Group pre-tax profit adjusted(2) was €259.0 million, up +10.0%
(1) Calculated based on net financial income (charges over average financial debt)
(2) In 9M 2019, negative operating adjustments of €(13.9) million, mainly attributable to restructuring operations. This compares with the net positive
operating and f inancial adjustment of €13.9 million in 9M 2018
23
Results for the nine months ended 30 September 2019Table of contents
Results Summary
Sales Results
‒ By region
‒ By brand
Consolidated P&L
Net Financial Debt
New marketing initiatives & developments
Conclusion & Outlook
Annex
24
Results for the nine months ended 30 September 2019Net financial debt
€ million 30 September 2019
(1)
31 December 2018 Change
Short-term cash/(debt) (72.1) 404.1 (476.2)
- Cash and cash equivalents 757.7 613.9 143.8
- Short-term debt (*) (829.9) (209.9) (620.0)
Medium to long-term cash/(debt) (*) (652.5) (1,076.0) 423.5
Debt relating to operating activities (724.7) (672.0) (52.7)
(2)
Liabilities for put option and earn-out payments (149.7) (174.3) 24.6
Net cash/(debt) (874.4) (846.3) (28.1)
(*) Reclassification of September 2020 bond maturity of €581 million from medium to long-term to short term debt. See Annex 5 on page 41 for additional financial
debt details.
> Net financial debt at €874.4 million as of 30 September 2019, up €28.1 million vs. €846.3 million as of 31 December 2018
(down €62.8 million vs 30 June 2019), entirely driven by the incremental debt generated by the adoption of IFRS16-’Leases’
(leases net exposure of €81.2 million as of 30 September 2019)
> Excluding such effect, the net financial debt would have decreased by €53.1 million vs. 31 December 2018 thanks to
the positive cash flow generation and after the dividend payment of €57.3 million and the net purchase of own shares of
€27.2 million
> Net debt EBITDA pro-forma ratio at 1.9x as of 30 September 2019 (3) in line with 31 December 2018
(1) Does not include the effects generated by recent acquisitions of Bellonnie&Bourdillon Successeurs S.A, closed on 1 October 2019 and Licorera Ancho y Cia
S.A.P.I. de C.V and Casa Montelobos S.A.P.I. de C.V nor the disposal of Villa Les Cédres which are expected to close by year end
(2) Includes future commitments for purchases of Société Des Produits Marnier Lapostolle S.A.’s minorities, earn-out related to the Bulldog acquisition and Sagatiba
(3) Pro-f orma ratio mainly to take into account the full year effect of acquisitions and disposals that occurred in the period
25
Results for the nine months ended 30 September 2019Table of contents
Results Summary
Sales Results
‒ By region
‒ By brand
Consolidated P&L
Net Financial Debt
New marketing initiatives & developments
Conclusion & Outlook
Annex
26
Results for the nine months ended 30 September 2019Campari – celebrating art
Venice Film Festival
Cam pari has been the main sponsor of the World
renow ned Venice Film Festival. Affirming its presence as
brand w ith indissoluble link w ith the Cinem a industry,
Cam pari has been the protagonist not only on the Red
carpet, but also in the surrounding ecosystem of the
festival. The Cam pari lounge, for example, dominating the
w ay from the taxi pier and the Excelsior hotel to the red
carpet, has been one of the most visible attractions of the
Festival site, becoming a meeting hub for celebrities,
influencers, directors and new talents w ho could taste
Cam pari cocktails. On top of that, activations like
Venetika, the floating cinema and Entering Red, the secret
closing party w hich took place in one of the most
prestigious locations in the City, literally spread the brand
style and essence everywhere, painting Venice w ith a
distinctive tone of red, the Cam pari red
New York Film Festival
Cam pari extended its long-standing com mitment
to the w orld of art and cinem a as the exclusive
spirits partner of the 57th New York Film Festival
(NYFF), the premier U.S. show case of the best in
w orld cinema presented by the Film Society of Lincoln
Center. During the 17-day festival, the Cam pari Red
Diaries 2019 platform w as showcased to highly
influential film industry notables and target
consum er audiences at screenings and festival
programming. Cam pari hosted guests including
media, influencers and celebrity Maggie Gyllenhaal to
join for star-studded festival events such as the World
Premiere of Martin Scorsese’s “The Irishman” on
Opening Night, w here Cam pari w as front and
center w ith brand visibility, bar presence, featured
cocktails and experiential activations
27
Results for the nine months ended 30 September 2019Aperol – summer activations in established and
seeding markets
Madrid & Barcelona - Spain Cologne - Germany
Aperol celebrated its centenary also in Germ any w ith an
unexceptional City Take Over planned in Cologne. With m ultiple
activations spreading the light-hearted and positive vibe of Aperol,
Cologne has been w rapped in orange: megalights, billboards, street’s
entertainment, park takeover, kiosk activations and different venues
w ere all part of an immersive orange celebration. The biggest highlight
w as the Aperol Sundow ner Boat-tour w here guests & consumers
enjoyed the best Aperol Spritz ever, listening to the nicest beats and
music from Dj sets
Aperol celebrated its centenary at the Italian Em bassy for three evenings w ith a "Together w e
fest’" event in July, w ith the same taking place in Barcelona during September. Attendees
breathed the “Together We Joy” spirit in different w ays as if they w ere at several parties in a one
single place w ith spectacular Aperol bars, m erchandise and scenery in the garden
Governor's Ball (NY) & Lollapalooza
(Chicago)
London - UK
Aperol activations continued to run in
the US market over August and Activations and events throughout London took place over the
September, w ith tw o key summer period, w ith the viral ‘Aperol-ivery’ continuing, competitions
sponsorships of the both the highly to w in Aperol branded glassw are, as w ell as special events w ithin
anticipated Governor’s Ball in NY restaurant chains such as ‘Bills’ – w ith the founder making his love
and the Lollapalozza festival in for Aperol w ell know n on Instagram
Chicago.
Aperol Spritz sw ings, signs and
special Aperol gardens created the
perfect Aperol Spritz am biance , w ith
customized Aperol bars w here Aperol
Spritz w ere served w as central to the
activations, w ith w earable
m erchandise w as offered in
exchange for social & instagrammable
sharing – creating m illions of
im pressions
28
Results for the nine months ended 30 September 2019Other brand building initiatives
Wild Turkey - Cornerstone Rye Grand Marnier – Cuveé du Centenaire
Wild Turkey launched Master’s Keep
Cornerstone Rye , the fourth release in the The new Cuvée du Centenaire was launched
aw ard-winning Master’s Keep series. The w ith a premium packaging inspired by the
result is a Rye Whiskey of extraordinary vibrant artistic movement of Art Nouveau.
m aturity – the trium phant culm ination of Originally created in 1927 in honour of the
m ore than 150 years of Kentucky artisanship first Century of The House of Marnier
and heritage. For this limited release, Eddie Lapostolle, Cuvée du Centenaire celebrates
hand-picked from among his oldest #4 an extraordinary era of audacity and
alligator char barrels – each w ith Rye aged eccentricity by combining for the first time
betw een nine and 11 years . From there, Eddie orange bigaradia w ith XO cognacs. The
crafted a perfectly balanced, high-aged Rye cognacs used in this extraordinary Cuvée
Whiskey that exquisitely show cases Wild come from the finest grow ing areas of Cognac
Turkey’s signature bold and spicy flavors region: Grand and Petite Cham pagne
Wild Turkey - Talk Turkey! Grand Marnier – France & the UK
Wild Turkey is excited to announce the launch of its first ‘advertainm ent’ series, In September, journalists and influencers
Talk Turkey! The brand, w ith Creative Director and brand storyteller, Matthew attended a unique three-day rendez-vous to
McConaughey, announce the launch of a new unscripted, digital interview series rediscover Grand Marnier, on the banks of
featuring conversations betw een McConaughey, and trailblazers from influential the Seine, Paris, w here they w ere able to
m ovem ents who are helping to define culture through acts of personal enjoy the Grand Classics prepared by La
conviction. The first of four interview s and mini-documentaries w ill launch on social Demesure bartenders, and discover a set of
media on October 11th Grand experiences like a floating mixology
w orkshop
In Central London, during the w hole month of
October, a series of installations in super-
prem ium spirit stores focused on
com m unicating the unique product
alchem y of Grand Marnier and invited
consumers to discover the luxury range of the
Grand Marnier Cuvées via tasting events
29
Results for the nine months ended 30 September 2019GlenGrant wins big: 2020 Whisky Bible
Jim Murray 2020 Whisky Bible
GlenGrant 18 Year Old, the rarest variant in the GlenGrant single malt range, has once again been named “Scotch Whisky of the Year", “Single
Malt of the Year" and “Best Single Malt Scotch Aged 16-21 years" by the esteemed Whisky writer and reviewer, taking home the top prize in the
category for a stunning fourth year in a row. Additionally, The GlenGrant 10 Year Old wins in the “Best Single Malt Scotch Aged 10 Years and
Under" category for a remarkable 7th time. There were also awards for the GlenGrant 15 year old whisky as well as the unaged ‘Rothes Chronicles
Cask Haven’. The complete list is below:
Scotch Whisky of the Year
GlenGrant Aged 18 Years Rare
Edition
Single Malt of the Year (Multiple
Casks)
GlenGrant Aged 18 Years Rare
Edition
Scotch No Age Statem ent
GlenGrant Rothes Chronicles Cask
Haven
10 Years & Under (Multiple Casks)
GlenGrant Aged 10 Years
11-15 Years (Multiple Casks)
GlenGrant Aged 15 Years Batch
Strength
16-21 Years (Multiple Casks)
GlenGrant Aged 18 Years Rare
Edition
30
Results for the nine months ended 30 September 2019New developments: super-premium additions
Trois Rivières and La Mauny Ancho Reyes and Montelobos Mezcal
• On September 5th, acquisition of French company Rhum antilles SAS, ow ner • On October 9th, acquisition of a controlling interest in Ancho Reyes spicy
of 96.5% of the Martinique based company Bellonnie & Bourdillon liqueur and Montelobos Mezcal super premium brands (closing expected
Successeurs (deal closed on October 1st) by year end)
• Prestigious agricole rhum brands Trois Rivières and Maison La Mauny to • Tw o truly handcrafted gem s allow ing further portfolio prem ium isation in key
enhance the Group exposure to rum , a prem iumising category currently at US m arket, w ith strong focus on strategic premium on-premise channel
the heart of the m ixology trend and grow ing cocktail culture • 2018 net sales of c.USD7 m illion (c.€6 million) overall, before any
• Added significant critical m ass in France , poised to become one of the distribution synergies, w ith CAGR of 53.7% overall in 2016-2018
Group’s strategic m arkets • Overall consideration for 51% interest in the tw o com panies of USD35.7
• 2018 net sales of €24.1 m illion m illion (€32.7 million at the exchange rate on the announcement date)
• Enterprise Value of €60.0 m illion • Reciprocal put and call options on the remaining shareholdings to be
exercised starting from 2024
• Historic m ultiple of the Contribution After Advertising&Promotion
(CAAP) in 2018, equal to €6.5 million reclassified as per IFRS, of
approximately 9.5 tim es
31
Results for the nine months ended 30 September 2019Table of contents
Results Summary
Sales Results
‒ By region
‒ By brand
Consolidated P&L
Net Financial Debt
New marketing initiatives & developments
Conclusion & Outlook
Annex
32
Results for the nine months ended 30 September 2019Conclusion and Outlook
> Positive organic growth in sales and profit indicators in the first nine months, thanks to positive underlying sales
momentum in core developed markets, driving continuous sales mix improvement, enhanced by a recovery in
emerging markets
> For the full year 2019, the outlook remains broadly unchanged and fairly balanced in terms of risks and opportunities
> Organic performance:
• Positive organic sales performance driven by high-margin combinations of priority brands in core
developed markets, with continued volatility in emerging markets in their key seasonality period
• Positive organic EBIT growth, whilst EBIT margin expansion will be moderated by higher than expected
increase in agave purchase price exacerbated by Espolòn outperformance on a full year basis as well as
reinvestments into brand building initiatives and strengthening of sales capabilities
> The strengthened US Dollar against the Euro will continue to offset the weakness of the emerging markets
currencies which are expected to remain volatile during their peak season in the fourth quarter
The Group remains confident in delivering a positive performance across
all key underlying business indicators in 2019
33
Results for the nine months ended 30 September 2019Table of contents
Results Summary
Sales Results
‒ By region
‒ By brand
Consolidated P&L
Net Financial Debt
New marketing initiatives & developments
Conclusion & Outlook
Annex
34
Results for the nine months ended 30 September 2019Annex - 1 Net sales by region and key market
Annex - 2 Net sales by brand cluster
Annex - 3 9M 2019 consolidated P&L
Annex - 4 Q3 2019 consolidated P&L
Annex - 5 Financial debt details
Annex - 6 Exchange rates effects
35
Results for the nine months ended 30 September 2019Annex - 1
Net sales by region & key market
Consolidated Net sales by region
9M 2019 9M 2018 Change of which: Q3 2019
€m % €m % % organic perimeter forex organic
Americas 584.7 44.8% 520.3 43.3% 12.4% 6.5% -0.1% 5.9% 0.5%
Southern Europe, Middle East & Africa 362.6 27.8% 345.7 28.8% 4.9% 8.1% -3.0% -0.1% 8.9%
North, Central & Eastern Europe 268.7 20.6% 247.1 20.6% 8.7% 8.3% 0.0% 0.5% 10.4%
Asia Pacific 87.8 6.7% 87.6 7.3% 0.3% 0.9% 0.0% -0.7% 0.7%
Total 1,303.8 100.0% 1,200.6 100.0% 8.6% 6.9% -0.9% 2.6% 4.9%
Region breakdown by key market
Americas by market
9M 2019 9M 2018 Change of which: Q3 2019
€m % €m % % organic perimeter forex organic
USA 367.7 62.9% 326.2 62.7% 12.7% 6.0% 0.0% 6.7% -2.8%
Jamaica 71.3 12.2% 58.7 11.3% 21.4% 17.3% -0.1% 4.2% 14.7%
Canada 41.4 7.1% 38.9 7.5% 6.5% 3.4% 0.0% 3.1% -2.5%
Brazil 34.5 5.9% 32.9 6.3% 4.8% 6.5% 0.0% -1.7% 6.2%
Mexico 27.5 4.7% 25.8 5.0% 6.5% 2.2% -0.8% 5.2% 11.1%
Other countries 42.3 7.2% 37.8 7.3% 12.0% 0.6% -0.2% 11.6% -3.0%
Americas 584.7 100.0% 520.3 100.0% 12.4% 6.5% -0.1% 5.9% 0.5%
36
Results for the nine months ended 30 September 2019Annex - 1
Net sales by region & key market
Southern Europe, Middle East & Africa by market
9M 2019 9M 2018 Change of which: Q3 2019
€m % €m % % organic perimeter forex organic
Italy 266.3 73.4% 254.7 73.7% 4.6% 8.4% -3.8% 0.0% 12.5%
Other countries 96.3 26.6% 90.9 26.3% 5.9% 7.2% -0.8% -0.5% 1.4%
Southern Europe, Middle East & Africa 362.6 100.0% 345.7 100.0% 4.9% 8.1% -3.0% -0.1% 8.9%
North, Central & Eastern Europe by market
9M 2019 9M 2018 Change of which Q3 2019
€m % €m % % organic perimeter forex organic
Germany 122.8 45.7% 116.2 47.0% 5.7% 5.7% 0.0% 0.0% 8.7%
Russia 27.1 10.1% 24.2 9.8% 12.1% 11.6% 0.0% 0.5% 12.4%
United Kingdom 29.7 11.1% 23.2 9.4% 28.0% 27.9% 0.0% 0.1% 52.6%
Other countries 89.0 33.1% 83.5 33.8% 6.7% 5.5% -0.1% 1.2% 0.6%
North, Central & Eastern Europe 268.7 100.0% 247.1 100.0% 8.7% 8.3% 0.0% 0.5% 10.4%
Asia Pacific by market
9M 2019 9M 2018 Change of which Q3 2019
€m % €m % % organic perimeter forex organic
Australia 60.2 68.6% 59.2 67.6% 1.7% 3.7% 0.0% -2.0% 3.9%
Other countries 27.6 31.4% 28.4 32.4% -2.7% -4.8% 0.0% 2.1% -5.7%
Asia Pacific 87.8 100.0% 87.6 100.0% 0.3% 0.9% 0.0% -0.7% 0.7%
37
Results for the nine months ended 30 September 2019Annex - 2
Net sales by brand cluster
Consolidated Net sales by brand
9M 2019 9M 2018 Change of which: Q3 2019
€m % €m % % organic perimeter forex organic
Global Priorities 772.4 59.2% 693.9 57.8% 11.3% 8.2% 0.0% 3.1% 5.5%
Regional Priorities 193.7 14.9% 179.7 15.0% 7.8% 5.3% 0.0% 2.5% -4.2%
Local Priorities 154.8 11.9% 147.2 12.3% 5.1% 5.2% 0.0% 0.0% 7.6%
Rest of portfolio 182.9 14.0% 179.8 15.0% 1.7% 5.0% -6.1% 2.9% 10.9%
Total 1,303.8 100.0% 1,200.6 100.0% 8.6% 6.9% -0.9% 2.6% 4.9%
38
Results for the nine months ended 30 September 2019Annex - 3
9M 2019 consolidated P&L
(1) COGS = cost of materials, production and logistics expenses
(2) SG&A = selling, general and administrative expenses
(3) Bps rounded to the nearest ten
39
Results for the nine months ended 30 September 2019Annex - 4
Q3 2019 consolidated P&L
Q3 2019 Q3 2018 Reported change Organic change Forex impact Perimeter effect
(
€ million % of sales € million % of sales % % % %
b
Net Sales 455.6 100.0% 422.4 100.0% 7.9% 4.9% 3.0% -0.1%
COGS (1) (172.8) -37.9% (162.5) -38.5% 6.4% 3.0% 3.5% -0.1%
Gross Profit 282.8 62.1% 259.9 61.5% 8.8% 6.1% 2.8% -0.1%
A&P (80.8) -17.7% (75.9) -18.0% 6.4% 2.5% 3.8% 0.1%
Contribution after A&P 202.0 44.3% 184.0 43.6% 9.8% 7.6% 2.3% -0.1%
SG&A (2) (94.3) -20.7% (85.3) -20.2% 10.5% 6.0% 4.5% 0.0%
EBIT adjusted 107.7 23.6% 98.7 23.4% 9.2% 8.9% 0.5% -0.2%
Operating adjustments (5.3) -1.2% (7.2) -1.7% -27.3%
Operating profit = EBIT 102.5 22.5% 91.4 21.6% 12.1%
Financial income (charges) (10.3) -2.3% (7.6) -1.8% 34.7%
Financial adjustments 0.0 0.0% (0.0) 0.0% -101.4%
Proft (loss) related to companies valued at
(0.0) 0.0% 0.0 0.0% -176.2%
equity
Put option costs (0.7) -0.2% (0.4) -0.1% 95.1%
Group pre-tax profit 91.5 20.1% 83.4 19.7% 9.7%
Other Information
Depreciation&Amortisation (17.4) -3.8% (13.2) -3.1% 31.7% 29.6% 2.1% 0.0%
EBITDA adjusted 125.2 27.5% 111.9 26.5% 11.9% 11.4% 0.7% -0.2%
EBITDA 119.9 26.3% 104.6 24.8% 14.6%
(1) COGS = cost of materials, production and logistics expenses
(2) SG&A = selling, general and administrative expenses
40
Results for the nine months ended 30 September 2019Annex - 5
Financial debt details
Outstanding gross debt as of 30 September 2019
Outstanding Amount
Issue date Maturity Type Currency Coupon Original tenor As % of total
(€ million)
Oct 25, 2012 (1) Oct-19 Unrated Eurobond EUR 4.5% 219 7 years 16%
Sep 30, 2015 (1) Sep-20 Unrated Eurobond EUR 2.75% 581 5 years 42%
Apr 5, 2017 Apr-22 Unrated Eurobond EUR 1.768% 50 5 years 4%
Apr 5, 2017 Apr-24 Unrated Eurobond EUR 2.165% 150 7 years 11%
Apr 23, 2019 Apr-24 Unrated Eurobond EUR 1.655% 150 5 years 11%
Jul 31, 2019 Jul-24 Term Loan EUR 1.25% +3m euribor 250 5 years 18%
Total gross debt 1,400 100%
Of which: medium-long term 600
(1) Classified as short-term debt
41
Results for the nine months ended 30 September 2019Annex - 6
Exchange rates effects
(1)
(1) Following the adoption of IAS 29 ‘Financial reporting Hyperinflationary Economies’ in Argentina, the average exchange rate of Argentine Peso for 9M 2019 was adjusted to be equal to the rate as
of 30 September 2019
42
Results for the nine months ended 30 September 2019Disclaimer
This document contains forward-looking statements, that relate to future events and future operating, economic and
financial results of Campari Group. By their nature, forward-looking statements involve risk and uncertainty because
they depend on the occurrence of future events and circumstances. Actual results may differ materially from those
reflected in forward-looking statements due to a variety of factors, most of which are outside of the Group’s control.
43
Results for the nine months ended 30 September 2019You can also read