4Q FY2011/12 Investor Presentation ASEAN Stars Conference 2012 - 1 March 2012 Europe non-deal roadshow slides 19 - 21 June 2019 - Sgx.com
←
→
Page content transcription
If your browser does not render page correctly, please read the page content below
4Q FY2011/12
Europe non-deal roadshow slides Investor Presentation

19 - 21 June 2019
                              ASEAN Stars Conference 2012
                              1 March 2012

                                                                   Asia’s First Listed Indian Property Trust
                              Asia’s First Listed Indian Property Trust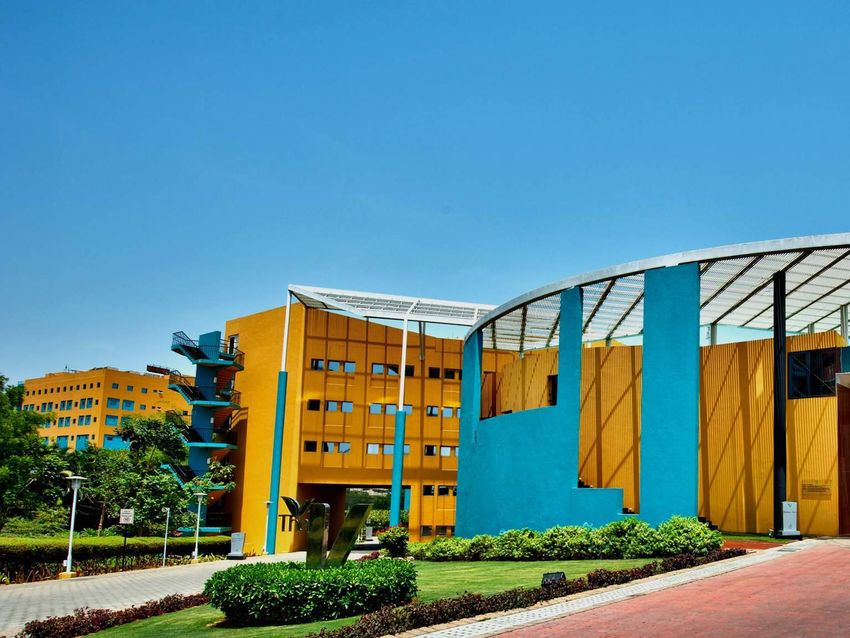
Disclaimer
This presentation on a-iTrust’s results for the financial year and quarter ended 31
March 2019 (“FY18/19” & “4Q FY18/19”) should be read in conjunction with
a-iTrust’s quarterly results announcement, a copy of which is available on
www.sgx.com or www.a-iTrust.com.

This presentation may contain forward-looking statements that involve risks and uncertainties. Actual future
performance, outcomes and results may differ materially from those expressed in forward-looking
statements as a result of a number of risks, uncertainties and assumptions. Representative examples of
these factors include (without limitation) general industry and economic conditions, interest rate trends, cost
of capital and capital availability, competition from other developments or companies, shifts in expected
levels of property rental income and occupancy rate, changes in operating expenses (including employee
wages, benefits and training, property expenses), governmental and public policy changes and the continued
availability of financing in the amounts and the terms necessary to support future business. Investors are
cautioned not to place undue reliance on these forward-looking statements.

All measurements of floor area are defined herein as “Super Built-up Area” or “SBA”, which is the sum of
the floor area enclosed within the walls, the area occupied by the walls, and the common areas such as the
lobbies, lift shafts, toilets and staircases of that property, and in respect of which rent is payable.
The Indian Rupee and Singapore Dollar are defined herein as “INR/₹” and “SGD/S$” respectively.
Any discrepancy between individual amounts and total shown in this presentation is due to rounding.

                                                                                                                  2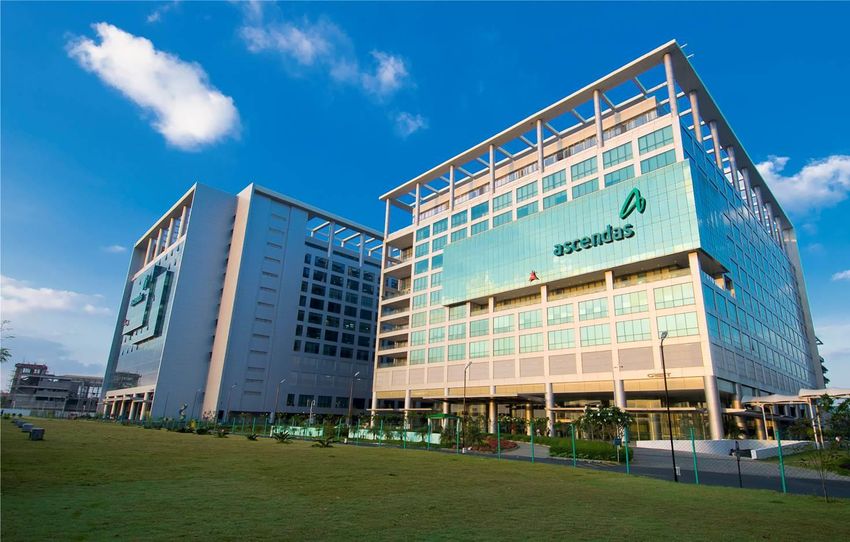
Content

 • Overview

              33
Introduction to a-iTrust
 Our presence                                                                             13.1 million sq ft1
                                                                                                                     Mumbai
                                                                                                                      6%
                                                                                          of completed      Pune
                                                                                                            12%
                                                                                          floor area                                  Bangalore
                                                                                                                                        34%

 Mumbai
 (Panvel)
                                                     Pune                                               Chennai
• Arshiya                                            • BlueRidge 2                                       22%
   warehouses
                                                                                                                               Hyderabad
Bangalore                                             Hyderabad                                                                   26%
                                                                                                                     Chennai
• International Tech                                   • The V                                                         6%
  Park Bangalore                                       • CyberPearl
Chennai                                                • aVance Biz Hub                  6.6 million sq ft2                           Bangalore
                                                                                                                                        41%
• International Tech                                                                     of potential floor
  Park Chennai                                                                           area
• CyberVale
1.   Excludes floor area of Auriga building (0.2m sq ft) in The V which was demolished as part of the
     redevelopment. Includes a 0.5 million sq ft multi-tenanted building in Bangalore which was
     subsequently completed in May 2019.
2.   Excludes a 0.5 million sq ft multi-tenanted building in Bangalore which was subsequently
     completed in May 2019.                                                                              Hyderabad
                                                                                                            53%
                                                                                                                                              4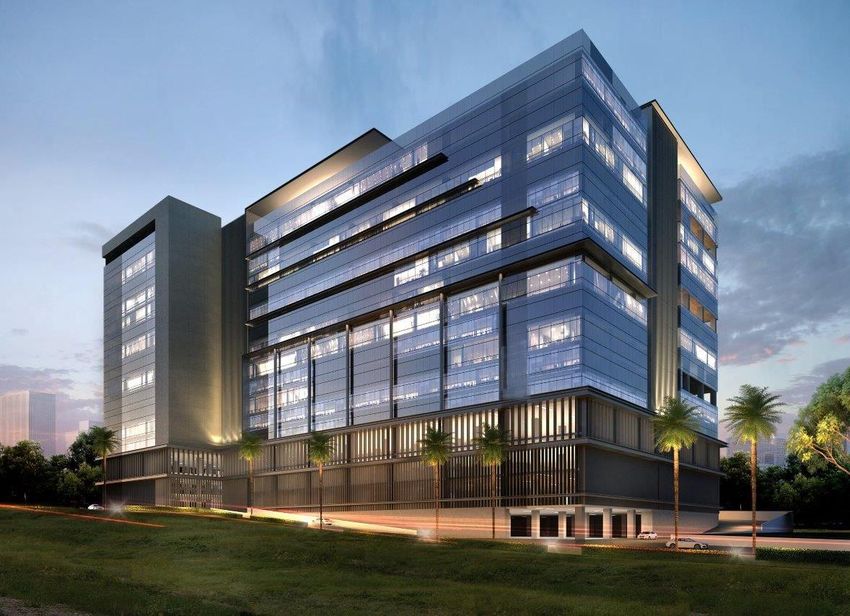
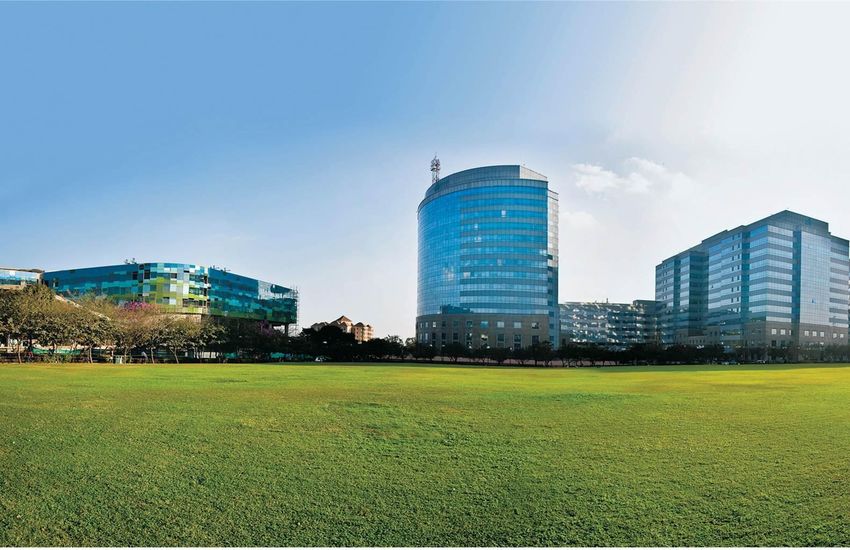
World class IT parks and warehouses
Our products

                                                                      Arshiya Warehouses

Modern IT Parks built to international        Modern warehouses with state of the
specifications & standards.                   art technology.

Award winning properties                      Grade-A specifications
• ITPC: 2018 CNBC-AWAAZ Real Estate Awards    • Up to G+6 racked structure
   Winner, “Best Commercial Project”          • 13 metres ceiling height
• ITPC: 2013 FIABCI Prix d’Excellence Award   • M35 grade super flat floor
   Gold Winner, Industrial Category           • Advanced fire detection system and
• ITPB: 2012 FIABCI Prix d’Excellence Award      security services
   Gold Winner, Industrial Category

                                                                                           5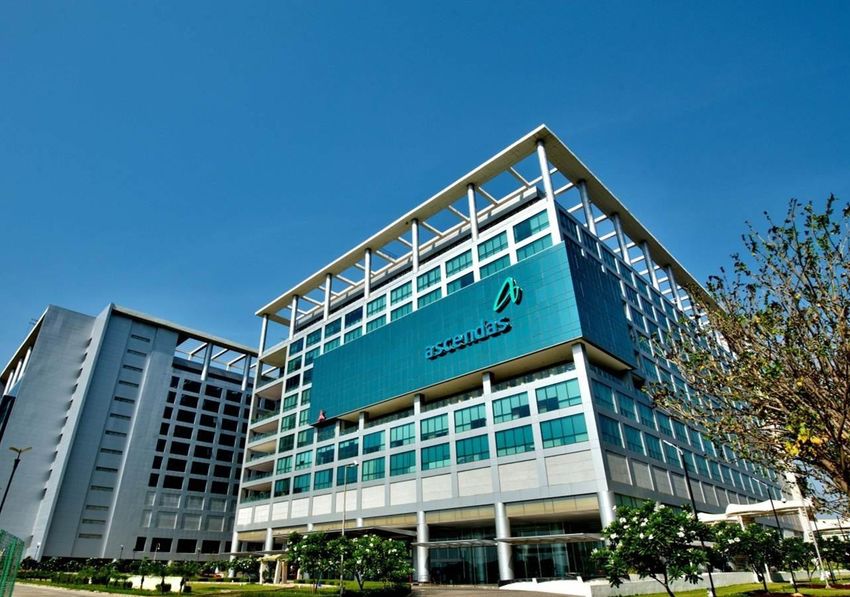
Awards and accolades

Singapore Corporate Awards       Securities Investor Association   The Edge Billion Dollar Club   The Edge Billion Dollar Club
(“SCA”) 2018                     (Singapore) Investors’ Choice     2018 Corporate Awards          2017 Corporate Awards
                                 Awards 2018
                                                                   REITs Category:                REITs Category:
REITs & Business Trust           Properties Category:
                                                                   “Most Profitable Company”      “Fastest Growing Company”
Category:
                                 “Most Transparent Company
                                                                                                  “Most Profitable Company”
                                 Award”
“Gold Award” for Best Investor
                                                                                                  “Best in Sector”
Relations

                                                                                                                                 6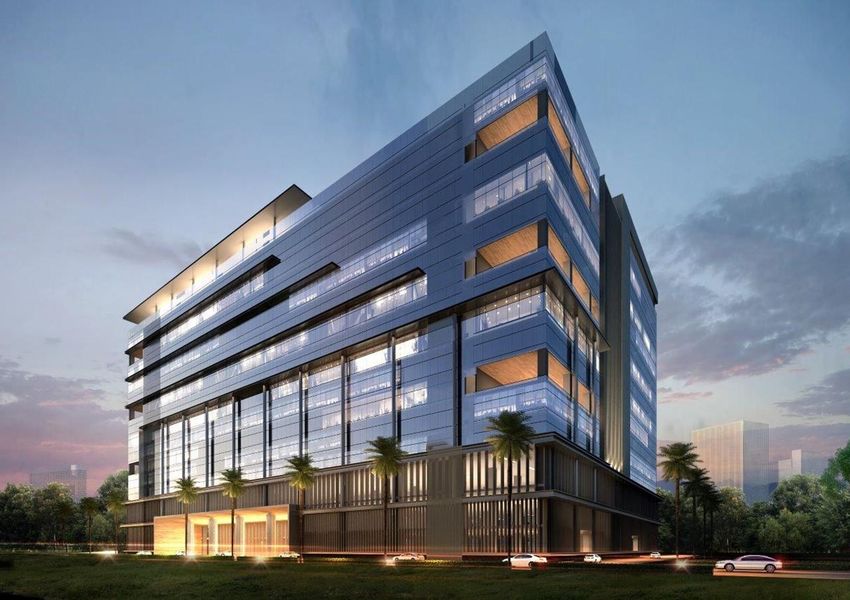
Key safeguarding provisions
Our structure
a-iTrust is a business trust that has voluntarily adopted the following SREIT restrictions:

                                Adheres to Property Fund Appendix’s definition of allowable
Permissible investment
                                investments
                                Invests at least 75% of the Trust property in income-producing
Investment restriction
                                real estate
Development limit               20% of Trust property
Distributable income            Minimum 90% to be distributed
Tax-exempt distributions        Distributions exempt from Singapore tax
Gearing limit                   45%

                                                                                                 7
Ascendas-Singbridge Group
Our sponsor
•   Ascendas-Singbridge Group undertakes
    urbanisation projects spanning townships, mixed-
    use developments and business/industrial parks,
    offices, hotels and warehouses.
•   The group has a substantial interest in, and also
    manages three Singapore-listed funds:
     • Ascendas Reit
     • Ascendas India Trust; and
     • Ascendas Hospitality Trust.
•   The group has presence across 11 countries in
    Asia, Australia, Europe and the United States of
    America.

                                                        8
4Q FY18/19 results
                                         4Q FY18/19 4Q FY17/18 Variance   • Income from BlueRidge 2 and Arshiya
                                                                            warehouses;
 SGD/INR FX rate1                              52.1      48.8     6.8%    • positive rental reversions; and
                                                                          • partly offset by lower utilities income
                                              ₹2,459m   ₹2,406m    2%       with phasing out of Dedicated Power
 Total property income
                                              S$47.2m   S$49.3m   (4%)      Plant (“DPP”) in ITPB.

                                                                          • Increase due to higher revenue; and
                                              ₹1,840m   ₹1,633m   13%
 Net property income                                                      • lower utilities expenses with the phasing
                                              S$35.3m   S$33.5m    5%
                                                                            out of DPP in ITPB.

 Income available for                         ₹1,023m    ₹888m    15%     • Mainly due to net property income
 distribution                                 S$19.6m   S$18.1m    9%       growth and interest income from
                                                                            investments in AURUM IT SEZ, aVance 5 &
                                                                            6 and aVance A1 & A2; and
                                               ₹920m     ₹799m    15%     • partly offset by one-off Goods and
 Income to be distributed
                                              S$17.7m   S$16.3m   9%        Services Tax (“GST”) provision based on
                                                                            assessments received.

 Income to be distributed                      ₹0.89     ₹0.81    9%      • After retaining 10% of income available
 (DPU2)                                        1.70¢     1.65¢    3%        for distribution.

                                                                          • Includes 97.4 million units issued
 Weighted average number of
                                          1,038,758     984,917   5%        pursuant to February 2018 private
 units (‘000)                                                               placement.

1.   Average exchange rates for the period.
2.   Distribution per unit.

                                                                                                                        9
FY18/19 results
                                                                            • Income from BlueRidge 2, Atria and Arshiya
                                          FY18/19     FY17/18    Variance     warehouses;
                                                                            • positive rental reversions; and
 SGD/INR FX rate1                             51.5      47.5      8.5%      • partly offset by lower utilities income with
                                                                              phasing out of Dedicated Power Plant (“DPP”)
                                         ₹9,389m      ₹8,943m      5%         in ITPB.
 Total property income
                                         S$182.0m     S$188.2m    (3%)
                                                                            • Increase due to higher revenue;
                                                                            • lower utilities expenses with the phasing out
                                         ₹6,999m      ₹6,089m      15%        of DPP in ITPB;
 Net property income                                                        • gains from scrap sale of DPP; and
                                         S$135.7m     S$128.1m     6%
                                                                            • partly offset by one-off provision for water
                                                                              supply and sanitary connection charges in
 Income available for                     ₹4,357m     ₹3,062m      42%        ITPB.
 distribution                             S$84.5m     S$64.2m      32%      • Mainly due to net property income growth
                                                                              and interest income from investments in
                                                                              AURUM IT SEZ, aVance 5 & 6 and aVance A1
                                          ₹3,921m     ₹2,756m      42%        & A2;
 Income to be distributed
                                          S$76.1m     S$57.8m      32%      • one-off tax benefit arising from the merger of
                                                                              the legal entities of The V and BlueRidge 2;
                                                                              and
 Income to be distributed                     ₹3.78    ₹2.91       30%      • partly offset by one-off Goods and Services
 (DPU2)                                       7.33¢    6.10¢       20%        Tax (“GST”) provision based on assessments
                                                                              received.

 Weighted average number of                                                 • After retaining 10% of income available for
                                         1,036,952    945,968      10%        distribution.
 units (‘000)

1.   Average exchange rates for the period.                                 • Includes 97.4 million units issued pursuant to
2.   Distribution per unit.
                                                                              February 2018 private placement.

                                                                                                                               10
Consistent growth
Our INR financial performance
INR million 9,389
8,943
7,587
Total property income 6,784
6,108
5,540 5,774
4,899
4,007 4,182
13% CAGR 3,783
2,801
FY08 FY09 FY10 FY11 FY12 FY13 FY14 FY15 FY16 FY17 FY18 FY19
INR million
6,999
6,089
Net property income 5,047
4,415
3,681
3,450
16% CAGR 2,805 3,165
2,448 2,425
2,117
1,651
FY08 FY09 FY10 FY11 FY12 FY13 FY14 FY15 FY16 FY17 FY18 FY19
11Consistent growth
Our SGD financial performance
S$ million 188.2 182.0
156.7
144.0
Total property income 121.5 127.5 126.3 128.8
118.1 120.9 120.7
102.7
6% CAGR
FY08 FY09 FY10 FY11 FY12 FY13 FY14 FY15 FY16 FY17 FY18 FY19
S$ million
135.7
128.1
Net property income 104.2
93.7
77.6
73.8 70.6 73.0 72.1 72.1
8% CAGR 60.5 66.2
FY08 FY09 FY10 FY11 FY12 FY13 FY14 FY15 FY16 FY17 FY18 FY19
12Quarterly DPU since listing
INR/SGD exchange rate2
DPU1 (S¢) (Indexed)
9.00
Change since listing 130
INR depreciation against SGD: -48%
8.00 SGD DPU3: +34% 120
7.00 110
6.00 100
5.00 90
4.00 80
3.00 70
2.00 60
1.00 50
0.00 40
FY07/08 FY08/09 FY09/10 FY10/11 FY11/12 FY12/13 FY13/14 FY14/15 FY15/16 FY16/17 FY17/18 FY18/19
1Q 2Q 3Q 4Q INR/SGD exchange rate
1. DPU (income available for distribution) refers to 100% of distributable income. 10% of distributable income was retained starting from 1Q FY12/13.
2. Average daily spot INR/SGD exchange rate for the period, pegged to 1 August 2007 using data sourced from Bloomberg.
3. FY18/19 DPU compared against FY07/08 DPU.
13Content
• Market review
1414Global IT powerhouse
India’s IT industry
Largest global IT Most cost competitive
sourcing destination1 IT sourcing destination2
India
IT engineer’s salary
55%
2 IT engineers in Singapore
The salary of
Rest of the 1 IT engineer in USA
world is equivalent to
45% 12 IT engineers in India
1. Source: India Brand Equity Foundation.
2. Source: March 2019 median salary from PayScale (provider of global online compensation data), converted into USD from local currencies using
exchange rate from Bloomberg (31 March 2019).
15India office market growth
512
India Grade A office stock (in million sq ft)1
127% growth from 2009 to 2018
444
310
225
2009 2012 2015 2018
1. Source: JLL Report 2018
16Strong growth in Grade A office supply
India Grade A office supply-absorption trend1
70
60
50
40
30
20
70%
10
0
2013 2014 2015 2016 2017 2018 2019E
Supply (in million sq ft) Net Absorption (in million sq ft)
1. Source: CBRE Research
17Office markets healthy
Bangalore (Whitefield) Hyderabad (IT Corridor I2)
4.0 4.0
15.5% 14.3%1 12.0%
12.0%
3.0 3.0
8.9%
6.2% 5.7% 5.2%
2.0 7.2% 2.0
3.0%
1.0 1.0
0.0 0.0
CY 2015 CY 2016 CY 2017 CY 2018 1Q 2019 CY 2015 CY 2016 CY 2017 CY 2018 1Q 2019
Chennai (OMR) Pune (Hinjewadi)
3.0 2.0
9.0%
2.0 7.0% 15.2%
1.0 9.9%
3.8% 8.6%
3.3% 3.3% 6.0% 6.0%
1.0
0.0 0.0
CY 2015 CY 2016 CY 2017 CY 2018 1Q 2019 CY 2015 CY 2016 CY 2017 CY 2018 1Q 2019
Supply (in million sq ft) Gross Absorption (in million sq ft) Vacancy (%) Source: CBRE Research
1. Higher vacancy is due to supply of 1.9m sq ft into the micro-market in 1Q 2019.
2. Includes Hitec City and Madhapur.
18Content
• Operational review
1919Top quality tenants
Tenant statistics
Top 10 tenants (in alphabetical order) Top 5 subtenants of Arshiya Limited
(in alphabetical order)
1 Applied Materials 1 APMC FZE
2 Arshiya1 2 DHL Logistics
3 Bank of America 3 Huawei Telecommunications
4 Cognizant 4 Rolex Logistics (CISCO)
5 Mu Sigma 5 UPL
6 Renault Nissan
7 Societe Generale
8 Tata Consultancy Services
9 Technicolor
10 The Bank of New York Mellon
All information as at 31 March 2019.
1. The Trust is in a master lease agreement with Arshiya Limited (“Vendor”) for the Arshiya warehouses. Rents paid by subtenants of the
Vendor are deposited into an escrow account controlled by the Trust. Hence, this allows for the Trust to be paid first before all other
expenses.
20Diversified tenant base
Tenant country of origin & company structure by base rental
59% US companies 86% multinational companies
Singapore 2% Others 5%
Indian Co
Japan 2% USA 59% 14%
France 8%
India 24%
MNC
86%
All information as at 31 March 2019.
21Diversified tenant base
Tenant statistics Diversified tenant industry
Retail F&B Oil & Gas
Telco 2% 1% 1%
337 tenants Others 2%
3% IT & Software
Healthcare &
Development
Pharma
49%
3%
119,100 park employees
Electronics &
Engineering
7%
Largest tenant accounts for Automobile
7% of total base rent 6%
Logistics
Top 10 tenants accounts for 7%
33% of total base rent
Design, Gaming
and Media
7%
Banking &
Financial Services
12%
All information as at 31 March 2019.
22Healthy portfolio occupancy
Committed portfolio occupancy: 99%
99% 100% 100% 99% 100%
98% 96% 98%
1% 96% 95% 95% 95%
93% 94%
98%
5%
86%
1
ITPB ITPC CyberVale aVance CyberPearl The V BlueRidge 2 Arshiya
a-iTrust occupancy Committed occupancy Market occupancy of peripheral area2
All information as at 31 March 2019.
1. There are no comparable warehouses in the micro-market that the Arshiya warehouses are located in.
2. CBRE market report as at 31 March 2019.
23Transacted versus effective rents1
Bangalore Hyderabad2 Chennai Pune
35%
32%
30%
25%
20%
16%
15% 13% 13%
10%
7%
5%
5% 3%
0%
ITPB The V CyberPearl ITPC Cybervale BlueRidge 2 Weighted
Average
Property
All information as at 31 March 2019.
1. Difference in average transacted rents by a-iTrust over the past 12 months against effective rents at the respective properties.
2. There were no comparable transactions for aVance in the past 12 months.
24Spread-out lease expiry profile
Weighted average lease term: Weighted average lease expiry:
6.6 years 4.2 years
Sq ft expiring
5,500,000
5,000,000 40%
4,500,000
4,000,000
3,500,000
3,000,000
2,500,000 18% 19%
2,000,000 14%
1,500,000
9%
1,000,000
500,000
-
FY19/20 FY20/21 FY21/22 FY22/23 FY23/24 & beyond
All information as at 31 March 2019.
Note: Retention rate for the period 1 April 2018 to 31 March 2019 was 71%. This excludes leases in The V which are affected by the redevelopment of
Auriga building.
25Content
• Capital management
2626Capital management
Currency hedging strategy Funding strategy
Balance sheet • The Trustee-Manager’s approach to equity
raising is predicated on maintaining a strong
• Trustee-Manager does not hedge equity.
balance sheet by keeping the Trust’s gearing
• At least 50% of debt must be denominated ratio at an appropriate level.
in INR. • Trustee-Manager does not borrow INR loans
onshore in India as it costs less to hedge SGD
Income borrowings to INR-denominated borrowings
• Income is repatriated semi-annually from using cross-currency swaps and derivatives.
India to Singapore.
• Trustee-Manager locks in the income to
be repatriated by buying forward
Income distribution policy
contracts on a monthly basis. • To distribute at least 90% of its income
available for distribution.
• a-iTrust retains 10% of its income available
for distribution to provide greater flexibility
in growing the Trust.
27Debt maturity profile
Hedging ratio
Effective borrowings: S$717 million
INR: 62% SGD: 38%
S$ Million
0.0
220.3 213.6
1.0
64.8
0.0
145.2
0.0
171.4
92.0
154.5 108.2 0.0
62.0 46.2
36.2 42.2
30.0 37.0
10.0
FY19/20 FY20/21 FY21/22 FY22/23 FY23/24
SGD Denominated debt INR Denominated debt Deferred consideration1
Information as at 31 March 2019.
1. Deferred consideration refers to the remaining purchase consideration pertaining to the acquisition of BlueRidge 2 in Pune.
28Capital structure
Indicator As at 31 March 2019
Interest service coverage 4.0 times
(EBITDA/Interest expenses) (FY18/19)
Percentage of fixed rate debt 77%
Percentage of unsecured borrowings 100%
Gearing: 31%
Effective weighted average cost of debt1 6.0%
Gearing limit 45%
Available debt headroom S$593 million
1. Based on borrowing ratio of 62% in INR and 38% in SGD as at 31 March 2019.
29Content
• Growth strategy
3030Steady track record
Portfolio growth
Total developments: Total acquisitions:
5.0 million sq ft 4.8 million sq ft
Million
Square feet
13.1
12.8 12.61
0.5
11.1 1.2
0.4
Floor area 1.5
9.0 0.6
8.1 1.0
7.5
6.9 6.9 0.6
12% CAGR 6.0 0.4
0.6
0.5 12.6 12.6
4.7 4.8 4.8 1.2 11.1
0.1 9.0
3.6 1.1 8.1
6.9 6.9 7.5
6.0
4.7 4.8 4.8
3.6 3.6
IPO Mar-08 Mar-09 Mar-10 Mar-11 Mar-12 Mar-13 Mar-14 Mar-15 Mar-16 Mar-17 Mar-18 Mar-19 YTD
Portfolio Development Acquisition
1. Reduction in floor area due to the demolition of Auriga building (0.2m sq ft) in The V as part of the redevelopment.
31Clear growth strategy
• 2.7m sq ft1 in Bangalore
Development • 3.5m sq ft in Hyderabad
pipeline
• 0.4m sq ft in Chennai
• 2.3m sq ft from Ascendas Land
Sponsor International Pte Ltd
assets
Growth • Ascendas India Growth Programme
strategy • 3.0m sq ft aVance Business Hub
3rdparty
• 5.2m sq ft aVance Business Hub 2
acquisitions
• 2.9m sq ft AURUM IT SEZ
• 2.8m sq ft Arshiya warehouses
Logistics • Ascendas-Firstspace platform
1. Includes buildings under construction and additional development potential due to the widening of the road in front of International Tech Park Bangalore.
Excludes a 0.5 million sq ft multi-tenanted building in Bangalore which was completed in May 2019.
32Development: ITPB pipeline
Future development potential International Tech Park Bangalore
• Development potential of 2.7 million sq ft1.
• MTB 4 (0.5 million sq ft) recently completed in
May 2019.
• Construction of MTB 5 (0.7 million sq ft) has
commenced.
MTB 4
Park Square (Newly completed
(Mall) building)
Taj Vivanta
(Hotel) Victor
(Multi-tenanted
Special Economic Zone2 building)
Aviator
(Multi-tenanted building)
MTB 5
Voyager (New building )
(Multi-tenanted building)
1. Includes buildings under construction and additional development potential due to the widening of the road in front of International Tech Park Bangalore.
2. Red line marks border of SEZ area.
33Development: MTB 4, Bangalore
Artist’s impression
Floor area 0.52m sq ft
Property International Tech Park Bangalore
Construction status Completed in May 2019
Leasing status 100% leased and handed over to a leading IT Services company
34Development: MTB 5, Bangalore
Artist’s impression
Floor area 0.68m sq ft
Property International Tech Park Bangalore
• Construction has commenced and excavation is in progress
Construction status
• Completion expected by 2H 2020
Leasing status 100% pre-leased to a leading IT Services company
35Development: The V redevelopment
Existing Master Plan (1.5m sq ft1) Proposed Master Plan (5.0m sq ft)
MLCP
BLOCK E
Capella
Vega BLOCK D
Atria Atria
Phase I
Phase I BLOCK C
BLOCK A BLOCK B
Orion
Auditorium Mariner
Auriga
Key Highlights
Redevelopment to increase the development potential, rejuvenate the existing park, and leverage strong
demand in Hyderabad:
• Net increase of 3.5m sq ft of leasable area
• Development planned in multiple phases over next 7 to 10 years
• Construction for Phase I has commenced and excavation is in progress
1. Excludes the leasable area of Auriga building (0.2m sq ft) which has been demolished.
36Development: The V redevelopment – Phase I
Artist’s impression
Floor area 1.36m sq ft
Property The V redevelopment – Phase I
• Construction has commenced and excavation is in progress
Development status
• Completion expected by 2H 2021
37Sponsor: Assets in India
Sponsor presence1 International Tech Park, Pune
• Three phases comprising 1.9 million sq ft
completed
• Final phase of 0.4 million sq ft under
Gurgaon development
Pune
Chennai
Private fund managed by sponsor
• Ascendas India Growth Programme
1. Excludes a-iTrust properties.
383rd party: Acquiring third-party assets
Acquisition criteria
Target cities Investment criteria
• Location
• Tenancy profile
Gurgaon Delhi • Design
• Clean land title and land tenure
Mumbai
• Rental and capital growth prospects
Pune • Opportunity to add value
Hyderabad
Bangalore Chennai
393rd party: aVance Business Hub
Acquisition details
Property details Investment details
Owned by a-iTrust
(3)
(8) (4)
(6) • aVance 1 – 4 with total floor area of 1.5
(2) (7)
(5) (1)
million sq ft.
(9) Construction funding
(10)
• Total construction funding towards aVance
5 & 6: Up to ₹8.9 bn (S$177m1).
• Till date, ₹7.6 bn (S$151m1) already
disbursed.
Location Hitec City, Hyderabad • aVance 6 was completed in December
2017. aVance 5 is expected to complete in
Site area 25.7 acres/10.4 ha 1Q 2020.
Floor area 1.50m sq ft Forward purchase agreement
Forward purchase of (5) & (6) 1.80m sq ft • Total consideration not expected to exceed
₹13.5 bn2 (S$270m1).
ROFR on (7), (8), (9) & (10) 1.16m sq ft
1. Based on exchange rate of S$1 to INR 50.04.
2. Dependent on the leasing commitment at the time of acquisition.
403rd party: aVance Business Hub 2
Acquisition details
Property details Investment details – aVance A1 & A2
Construction funding
• Total construction funding towards aVance
A1 & A2: Up to ₹8.0 bn (S$158m1)
• Construction completion expected by 2H
2021.
• Till date, ₹0.5 bn (S$10m1) already
disbursed
Forward purchase agreement
Location Hitec City, Hyderabad • Total consideration not expected to exceed
₹14.0 bn2 (S$278m1).
Site area 14.4 acres/5.8 ha
Forward purchase of (A1) & (A2) 1.85m sq ft
1. Based on exchange rate of S$1 to INR 50.44.
Proposed acquisition3 of (A3) to (A5) 3.32m sq ft 2. Dependent on the leasing commitment at the time of acquisition.
3. Master Agreement executed for proposed acquisition of Vendor assets.
413rd party: AURUM IT SEZ acquisition details
Acquisition details
Property details Investment details
Construction funding
(3) (2)
• ₹5.0 bn (S$100m1).
(4) (1)
• A total of ₹3.3 bn (S$65m1) already
disbursed.
Forward purchase agreement
• Total consideration not expected to
exceed ₹9.3 bn2 (S$186m1).
Buildings 1 & 2 (0.6m & 0.8m sq ft)
• Building 1: Occupancy Certificate
Location AURUM IT SEZ, Navi Mumbai received; Building 2: Expected
completion 1H 2020.
Site area 16.06 acres/6.50 ha
Strategic location
Forward purchase of (1) & (2) 1.40m sq ft • Marks entry into Navi Mumbai, an
ROFR on (3) & (4) 1.50m sq ft important market for large MNCs.
1. Based on exchange rate of S$1 to INR 50.04. • Located next to Thane-Belapur
2. Dependent on the leasing commitment at the time of acquisition.
Expressway; close proximity to the
Ghansoli train station. 42Logistics: Key demand drivers
1
Rise of • Rapid progress under ‘Make in India’ campaign to raise sector’s share from 13-17% to 25%
manufacturing of GDP (e.g FDI increase in defence and railways; new plants announced by MNCs like Apple,
sector Hitachi, Huawei, Foxconn)
2 Retail &
• Warehousing requirements of the “E-tail” segment set to double from 14 million in 2016
E-Commerce
to 29 million in 2020
boom
3
GST • GST has been introduced since July 1, 2017 and is expected to lead to the simplification
implementation of the tax regime, leading to a more efficient supply chain
4
Trend towards • Trend towards modern logistics and manufacturing facilities for speed and efficiency
quality • Sectors such as manufacturing, retail and e-commerce demand for modern warehouses
Source: Euromonitor, BCG, Goldman Sachs, Various Govt. ministries, Knight Frank and JLL Research
43Logistics: Growing demand for warehousing space
Close to 10 million sq ft leased in 1H 2018
Million sq ft
12
Pre - GST Post - GST
10
8
6
4
2
0
1H 2H 1H 2H 1H 2H 1H
2015 2016 2017 2018
Half-year average: Half-year average:
~4.5 million sq ft ~10 million sq ft
Source: CBRE
120%
44Logistics: ASB partnership with Firstspace Realty
Sponsor initiative
• The Ascendas-Firstspace platform is a joint venture formed by Ascendas-
Singbridge and Firstspace Realty.
• Aims to deliver state-of-the-art logistics and industrial facilities across major
warehousing and manufacturing hubs in India.
• Targets to develop close to 15 million sq ft of space over the next five to six years.
• Provides a-iTrust with a potential pipeline of quality warehouses in the future.
45Logistics: Arshiya acquisition details
Acquisition details
Property details Investment details
6 operating warehouses (0.83m sq ft)
• Acquired in February 2018.
• Upfront payment of ₹4.3 bn (S$91m1) and
deferred consideration of up to ₹1.0 bn (S$21m1)
to be paid over the next 4 years.
• Operating lease arrangement with vendor to
lease-back the warehouses for 6 years.
Forward purchase agreement
Location Panvel, near Mumbai • Additional future development potential of at
least 2.80m sq ft.
Site area ~143 acres/57.92 ha
• Right to provide co-financing of construction
Floor area 0.83m sq ft loan.
Forward purchase At least 2.80m sq ft • Exclusive right to acquire all future warehouses.
1. Based on an exchange rate of S$1 to INR 47.50.
46Content
• Outlook
4747Growth pipeline
Floor area
(million square feet)
22.0
1.8
1.9
1.8
Floor area 1.4
13.11 1.4
0.7
68%
13.1
YTD Growth pipeline
Portfolio MTB 5 V redevelopment - Phase I AURUM IT SEZ aVance 5 & 6 aVance A1 & A2 BlueRidge 3 - Phase 1 & 2
1. Includes a 0.5 million sq ft multi-tenanted building in Bangalore which was subsequently completed in May 2019.
48Growth pipeline
ITPB The V aVance Business Hub aVance Business Hub 2 AURUM IT SEZ BlueRidge 3
TOTAL
MTB 5 Phase I aVance 5 aVance 6 aVance A1 aVance A2 Building 1 Building 2 Phase 1 Phase 2
Floor area 0.68 1.36 1.16 0.64 0.86 0.99 0.60 0.80 1.41 0.43 8.93
(mil sq ft)
Time of 2H 2H 1Q Dec 2H 2H OC2 1H 1H 2H N.A.
Completion 2020 2021 2020 2017 2021 2021 received 2020 2021 2023
Total N.A. N.A. ₹13.5b ₹14.0b ₹9.3b ₹9.8b ₹46.6b
consideration1 (S$270m) (S$278m) (S$186m) (S$194m) (S$928m)
Amount N.A. N.A. ₹7.6b ₹0.5b ₹3.3b - ₹11.4b
disbursed1 (S$151m) (S$10m) (S$65m) (S$226m)
Remaining N.A. N.A. ₹5.9b ₹13.5b ₹6.0b ₹9.8b ₹35.2b
funding1 (S$119m) (S$268m) (S$121m) (S$194m) (S$702m)
1. Based on exchange rate at the time of investment/announcement.
2. Refers to occupancy certificate.
49Overview – BlueRidge 3
50
Perspective of buildings at BlueRidge 3BlueRidge 3
Key statistics
Location Hinjewadi Phase 1, Pune
Nalanda Shelter Private Limited (“NSPL”)
Vendor entities
Brickmix Developers Private Limited (“BDPL”)
Land title Freehold land
Project Type IT SEZ
Total Project NLA: 1.8 million sq ft1
• Phase 1 (IT building 1 and Cafeteria building)
No. of buildings and NLA ⁻ Construction funding and forward purchase of 1.4 million sq ft NLA.
• Phase 2 (IT building 2)
⁻ Construction funding and forward purchase of 0.4 million sq ft NLA.
Expected construction • Phase 1 – 1H 2021
completion date • Phase 2 – 2H 2023
Stablisation period post • Phase 1 - 21 months
occupancy certificate • Phase 2 - 15 months
• Phase 1 – 1H 2023
Expected acquisition date
• Phase 2 – 1H 2025
1. Currently, a-iTrust is conservatively underwriting total net leasable area upto 1.7 million sq ft. On compliance of certain conditions by the
vendor, total net leasable area can increase upto 1.8 million sq ft.
51BlueRidge 3
Masterplan1
1. Subject to revisions.
52BlueRidge 3
Location
• Hinjewadi is one of the prominent micro-markets in Pune housing 20% (10 million sq ft) of the total office
stock. IT/ ITes SEZs make up 86% of the stock.
• Location has well-developed social infrastructure and residential properties and is strategically located in
proximity to Mumbai – Pune Highway.
Source: CBRE Research Report Q1, 2019.
53Acquisition Details
54
Perspective of IT Building 1Acquisition details – Phase 1
Loan repayment and balance land payment funding
• a-iTrust through its subsidiary, International Tech Park Limited (“ITPL”) will provide Inter-Corporate
Deposits (“ICDs”) to NSPL amounting to INR 612 million or S$12.1 million. Funds will be used by NSPL to
part repay an existing loan in NSPL and towards balance land payments.
• The funding will be done upon execution of transaction documents and completion of conditions
precedent.
Construction funding
• a-iTrust through its wholly owned subsidiary, Ascendas Property Fund (FDI) Pte. Ltd. (“APFF”) will
subscribe to Rupee Denominated Off-shore Bonds (“RDBs”) issued in Singapore by NSPL amounting to
INR 4,315 million or S$85.5 million1.
• The subscription to RDBs will happen upon execution of transaction documents and tied to the
construction funding requirements of Phase 1.
Acquisition2
• Upon obtaining occupancy certificate and post completion of stabilization period of 21 months, a-iTrust
shall acquire NSPL shares by paying the Vendor a top-up consideration. The estimated purchase price
(including the top up consideration) is INR 7,390 million or S$146.4 million.
1. Based on exchange rate of SGD 1 to INR 50.48
2. An independent valuation would be conducted and announced after the acquisition
55Acquisition details – Phase 2
Construction funding
• Pursuant to the terms of the Master Agreement and upon satisfaction of certain conditions precedent, a-
iTrust shall provide construction funding to BDPL amounting to INR 1,250 million or S$24.76 million.
Acquisition1
• Upon obtaining occupancy certificate and post completion of stabilization period of 15 months, a-iTrust
shall acquire BDPL shares by paying the Vendor a top-up consideration. The estimated purchase price
(including the top up consideration) is INR 2,420 million or S$47.94 million.
1. An independent valuation would be conducted and announced after the acquisition.
56Transaction Rationale
57
Perspective of IT Building 1Transaction rationale
Strengthen presence in Pune IT/ITes market
• Transaction will increase the area in Pune from 1.5 million sq ft to 3.3 million sq ft with the addition of
BlueRidge 3.
• BlueRidge 3 can capitalise on the current market scenario, which is witnessing limited supply and declining
vacancy levels.
• BlueRidge 3 is in close proximity to BlueRidge 2 and other IT/ITes SEZ projects, and is strategically
positioned to absorb expansion demand from existing occupiers in addition to new demand.
• Proximity to BlueRidge township which extends over 138 acres will offer employees a work-live-play
environment within Hinjewadi.
Portfolio Diversification
Current Portfolio Enlarged Portfolio
(by floor area) 13.1 million sq ft1 (by floor area)
22.0 million sq ft
Mumbai
Mumbai
6%
10%
Pune
12% Bangalore Bangalore
34% 24%
Pune
15%
Chennai
Chennai 13%
22%
Hyderabad
26% Hyderabad
38%
1. Includes a 0.5 million sq ft multi-tenanted building in Bangalore which was subsequently completed in May 2019.
58Accretive acquisition
Pro forma FY18/19 net profits1
The FY18/19 pro forma net profit attributable to the acquisition is approximately S$9.7 million assuming
income generated from the Project on a stabilized basis.
Pro forma NAV as at 31 March 2019
Before the acquisition After the acquisition
NAV per Unit (S$) 1.02 1.03
Pro forma FY18/19 DPU2
Before the acquisition After the acquisition
DPU (S$ cents) 7.33 7.40
1. The pro forma financial effects of the acquisition presented are strictly for illustration purposes only, and do not reflect the actual financial position
of a-iTrust following the completion of the acquisition. Calculations assume that the transaction had been funded using 40% debt and 60% equity.
2. Post retaining 10% of income available for distribution.
59Contact
Tan Choon Siang
Chief Financial Officer
Ascendas Property Fund Trustee Pte Ltd
(Trustee-Manager of a-iTrust)
Office: +65 6774 1033
Email: choonsiang.tan@a-iTrust.com
Website: www.a-iTrust.com
The V 6060Appendix
Glossary
Trust properties : Total assets.
Derivative financial : Includes cross currency swaps (entered to hedge SGD borrowings into INR), interest rate swaps and
instruments forward foreign exchange contracts.
DPU : Distribution per unit.
EBITDA : Earnings before interest expense, tax, depreciation & amortisation (excluding gains/losses from
foreign exchange translation and mark-to-market revaluation from settlement of loans).
Effective borrowings : Calculated by adding/(deducting) derivative financial instruments liabilities/(assets) to/from gross
borrowings, including deferred consideration.
Gearing : Ratio of effective borrowings to the value of Trust properties.
ITES : Information Technology Enabled Services.
INR or ₹ : Indian rupees.
m : Million.
SEZ : Special Economic Zone.
SGD or S$ : Singapore dollars.
Super Built-up Area or : Sum of the floor area enclosed within the walls, the area occupied by the walls, and the common
SBA areas such as the lobbies, lift shafts, toilets and staircases of that property, and in respect of which
rent is payable.
61Average currency exchange rate
Average exchange rates used to translate a-iTrust’s INR income statement to SGD
1 Singapore Dollar buys Jan Feb Mar
Indian Rupee
2018 52.1 52.6 51.5
2017 48.1 48.8 49.5
SGD appreciation/(depreciation) 8.3% 7.9% 4.1%
1 Singapore Dollar buys 1Q 2Q 3Q 4Q FY
Indian Rupee
FY18/19 50.2 51.3 52.5 52.1 51.5
FY17/18 46.3 47.2 47.8 48.8 47.5
SGD appreciation/
8.4% 8.7% 9.8% 6.8% 8.5%
(depreciation)
Note: These rates represent the average exchange rates between Indian Rupee & Singapore Dollar for
the respective periods.
62Balance sheet
As at 31 March 2019 INR SGD
Total assets ₹118.31 billion S$2,319 million
Total borrowings ₹36.95 billion S$724 million
Deferred consideration1 ₹0.05 billion S$1 million
Derivative financial instruments (₹0.41 billion) (S$8 million)
Effective borrowings2 ₹36.59 billion S$717 million
Construction funding (AURUM IT SEZ) ₹3.26 billion S$64 million
Construction funding (aVance 5 & 6) ₹7.55 billion S$148 million
Construction funding (aVance A1 & A2) ₹0.49 billion S$10 million
Net asset value ₹51.90 per unit S$1.02 per unit
Adjusted net asset value3 ₹66.82 per unit S$1.31 per unit
1. Deferred consideration relates to the remaining purchase consideration on the acquisition of BlueRidge 2 in Pune.
2. Calculated by adding/(deducting) derivative financial instruments liabilities/(assets) to/from gross borrowings, including deferred consideration.
3. Excludes deferred income tax liabilities of ₹15.5 billion (S$304 million) on capital gains due to fair value revaluation of investment properties.
63World-class IT and logistics parks
City Bangalore Chennai Hyderabad Pune Mumbai
• Intl Tech Park • Intl Tech Park • The V • BlueRidge 2 • Arshiya
Property Bangalore Chennai • CyberPearl warehouses
• CyberVale • aVance Biz Hub
Type IT Park IT Park IT Park IT Park Warehouse
68.5 acres 33.2 acres 51.2 acres1 5.4 acres 143.1 acres1
Site area
27.9 ha 13.5 ha 20.5 ha1 2.2 ha 57.9 ha1
Completed
4.5m sq ft2 2.8m sq ft 3.4m sq ft2 1.5m sq ft 0.8m sq ft
floor area
Number of
10 6 11 3 6
buildings
Park
43,200 34,300 30,100 11,500 -
population
Land bank
(development 2.7m sq ft3 0.4m sq ft 3.5m sq ft4 - -
potential)
1. Includes land not held by a-iTrust.
2. Only includes floor area owned by a-iTrust. Excludes the leasable area of Auriga building (0.2m sq ft) in The V, which has been demolished. Includes a 0.5
million sq ft multi-tenanted building in Bangalore which was completed in May 2019.
3. Includes buildings under construction and additional development potential due to the widening of the road in front of International Tech Park Bangalore.
4. Excludes a 0.5 million sq ft multi-tenanted building in Bangalore which was subsequently completed in May 2019.
64Lease expiry profile
FY23/24 &
City FY19/20 FY20/21 FY21/22 FY22/23 Total
Beyond
Bangalore 192,700 876,800 856,700 503,900 1,460,000 3,890,100
Chennai 507,000 802,000 742,800 498,000 153,000 2,702,900
Hyderabad 383,800 460,400 713,500 707,300 1,020,600 3,285,600
Pune - - - 64,000 1,402,800 1,466,800
Mumbai - - - - 832,200 832,200
Total 1,083,500 2,139,200 2,313,100 1,773,300 4,868,600 12,177,600
Note: Figures are expressed in square feet
65a-iTrust unit price versus major indices
(Indexed)
Indicator
175
Trading yield
a-iTrust 6.2%1
(as at 31 Mar 2019)
150 FTSE STI Index
Average daily trading volume
1,038,900 units
FTSE ST REIT Index (4Q FY18/19)
125
Bombay SE Realty Index
INR/SGD FX rate
100 a-iTrust
FTSE STI Index
75 FTSE ST REIT Index
50 INRSGD FX Rate
25 Bombay SE
Realty Index
0
Jun 08
Jun 09
Jun 10
Jun 11
Jun 12
Jun 13
Jun 14
Jun 15
Jun 16
Jun 17
Jun 18
Dec 07
Dec 08
Dec 09
Dec 10
Dec 11
Dec 12
Dec 13
Dec 14
Dec 15
Dec 16
Dec 17
Dec 18
IPO
Mar 19
Source: Bloomberg
1. Trading yield based on FY18/19 DPU of 7.33 cents at closing price of S$1.19 per unit as at 31 March 2019.
66Structure of Ascendas India Trust
Unitholders
Holding of units Distributions
Trustee’s fee & management fees
Ascendas Property Fund Trustee Pte. Ltd.
a-iTrust (the Trustee-Manager), a wholly-owned subsidiary of
Acts on behalf of unitholders/ Ascendas Pte Ltd
management services
100% ownership & Dividends, principal
shareholder’s loan repayment
of shareholder’s loan
Singapore SPVs
1. Ascendas Property Fund (India) Pte. Ltd.
2. Ascendas Property Fund (FDI) Pte. Ltd
Ownership of ordinary shares ; Subscription to Fully &
Dividends on ordinary shares, proceeds from share buyback
Compulsory Convertible Debentures(“FCCD”) and Non-
Convertible Debentures (“NCD”)
& interest on FCCD and NCD Singapore
The VCUs India
• Ascendas Panvel FTWZ • Information Technology Park Limited (92.8% ownership)2
Limited1 • Ascendas Information Technology Park Chennai Ltd. (89.0% ownership)2
(100.0% ownership)
• Cyber Pearl Information Technology Park Private Limited (100.0% ownership)
• VITP Private Limited (100.0% ownership)
• Hyderabad Infratech Private Limited (100.0% ownership)
• Avance-Atlas Infratech Private Limited (100.0% ownership)
• Deccan Real Ventures Private Limited (100.0% ownership)
Ownership Master rental income Ownership Net property income
The Properties Provides property
• Arshiya warehouses • ITPB • The V management services
• ITPC • aVance Ascendas Services
• CV • BlueRidge 2 (India) Private Limited
• CP (the property manager)
Property management fees
1. Entered into a master lease agreement with Arshiya Limited (“AL”) to lease back the warehouses to AL for a period of six years. AL will operate and manage the
warehouses and pay pre-agreed rentals.
2. Karnataka State Government owns 7.2% of ITPB & Tamil Nadu State Government owns 11.0% of ITPC.
67You can also read