CAPITALAND MALL TRUST - Singapore's First & Largest Retail REIT Morgan Stanley - CapitaLand Integrated ...
←
→
Page content transcription
If your browser does not render page correctly, please read the page content below
CAPITALAND MALL TRUST
Singapore’s First & Largest Retail REIT

         Morgan Stanley
 16th Annual Asia Pacific Summit
             15 November 2017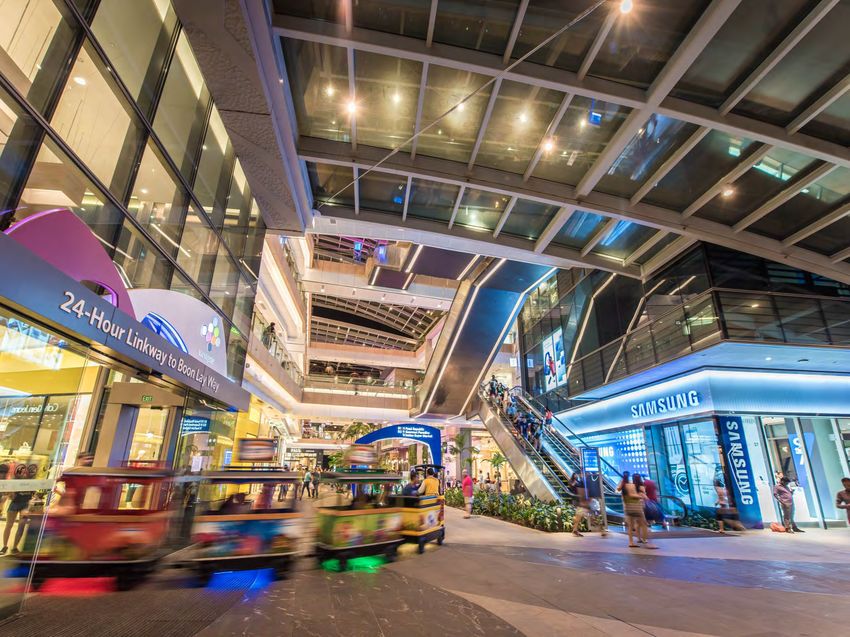
Disclaimer
    This presentation may contain forward-looking statements that involve assumptions, risks and uncertainties. Actual future
    performance, outcomes and results may differ materially from those expressed in forward-looking statements as a result
    of a number of risks, uncertainties and assumptions. Representative examples of these factors include (without
    limitation) general industry and economic conditions, interest rate trends, cost of capital and capital availability,
    competition from other developments or companies, shifts in expected levels of occupancy rate, property rental
    income, charge out collections, changes in operating expenses (including employee wages, benefits and training
    costs), governmental and public policy changes and the continued availability of financing in the amounts and the
    terms necessary to support future business. You are cautioned not to place undue reliance on these forward-looking
    statements, which are based on the current view of management on future events.

    The information contained in this presentation has not been independently verified. No representation or warranty
    expressed or implied is made as to, and no reliance should be placed on, the fairness, accuracy, completeness or
    correctness of the information or opinions contained in this presentation. Neither CapitaLand Mall Trust Management
    Limited (the ‘Manager’) or any of its affiliates, advisers or representatives shall have any liability whatsoever (in
    negligence or otherwise) for any loss howsoever arising, whether directly or indirectly, from any use, reliance or
    distribution of this presentation or its contents or otherwise arising in connection with this presentation.

    The past performance of CapitaLand Mall Trust (‘CMT’) is not indicative of the future performance of CMT. Similarly, the
    past performance of the Manager is not indicative of the future performance of the Manager.

    The value of units in CMT (‘Units’) and the income derived from them may fall as well as rise. Units are not obligations of,
    deposits in, or guaranteed by, the Manager or any of its affiliates. An investment in Units is subject to investment risks,
    including the possible loss of the principal amount invested.

    Investors should note that they will have no right to request the Manager to redeem or purchase their Units for so long as
    the Units are listed on the Singapore Exchange Securities Trading Limited (the ‘SGX-ST’). It is intended that unitholders of
    CMT may only deal in their Units through trading on the SGX-ST. Listing of the Units on the SGX-ST does not guarantee a
    liquid market for the Units.

    This presentation is for information only and does not constitute an invitation or offer to acquire, purchase or subscribe
    for Units.

2                                          Morgan Stanley 16th Annual Asia Pacific Summit *November 2017*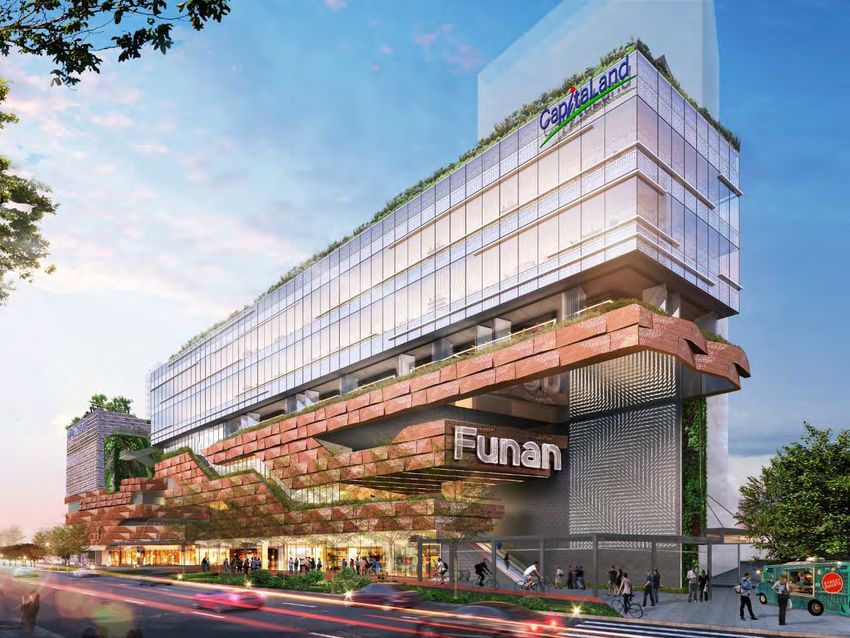
Contents

    ▪ Key Highlights and Financial Results

    ▪ Portfolio Updates

    ▪ Asset Enhancement Initiatives

    ▪ Striving for Excellence

    ▪ Looking Forward

    ▪ Annexes

3                  Morgan Stanley 16th Annual Asia Pacific Summit *November 2017*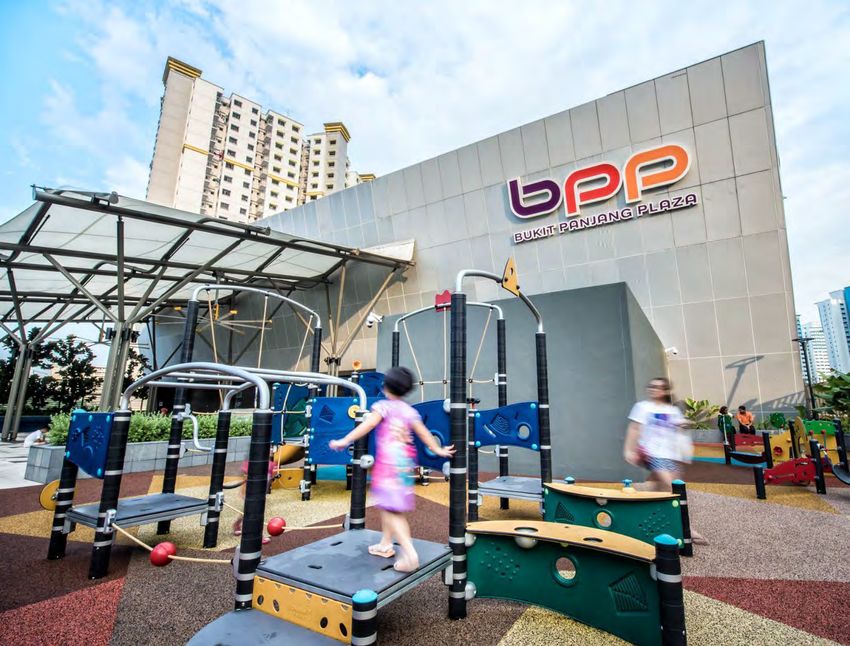
Key Highlights and Financial
Results

                               Tampines Mall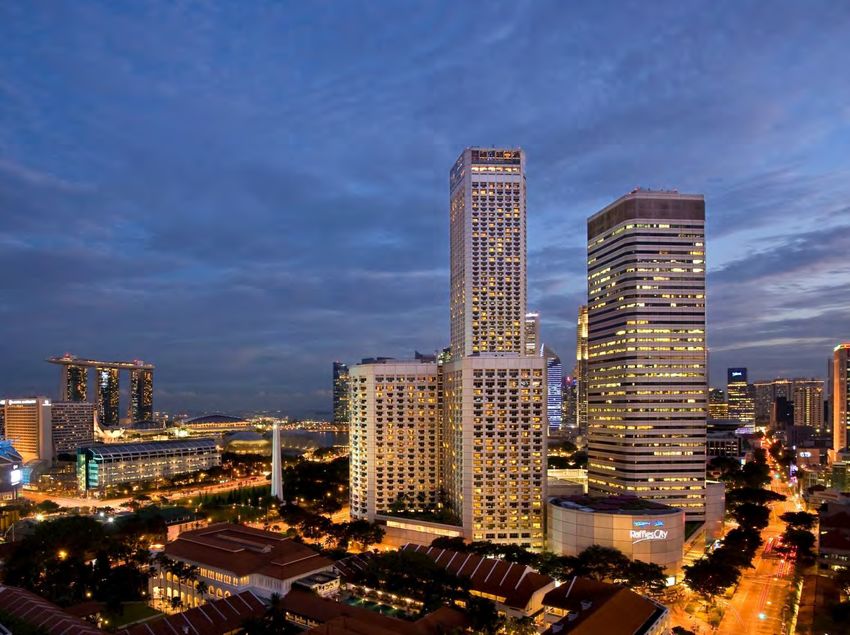
Review of YTD Sep 2017
     Operational Performance                                 Asset Enhancement Initiatives

           ,                    ,

    1.7%                99.0%                         ▪    Completed its rejuvenation works with the new
                                                                    public library on Level 4
           5           as at end-Sep 2017
           .                    .
    Rental reversion        Portfolio
                         occupancy rate

                                                  ▪       Funan gathers momentum with high retail leasing
                                                          interest

    0.2%                   0.0%                   ▪       Construction works are on schedule

        Y-o-Y                Y-o-Y                                      Divestment of
                                .
    Shopper traffic       Tenants’ sales                             Serviced Residences
                         per square foot
                                                      On 4 August 2017, CMT announced the divestment
                                                       of its entire unitholding interest in Victory SR Trust,
                                                      which owns the serviced residence component in
                                                               the Funan integrated development.

5                               Morgan Stanley 16th Annual Asia Pacific Summit *November 2017*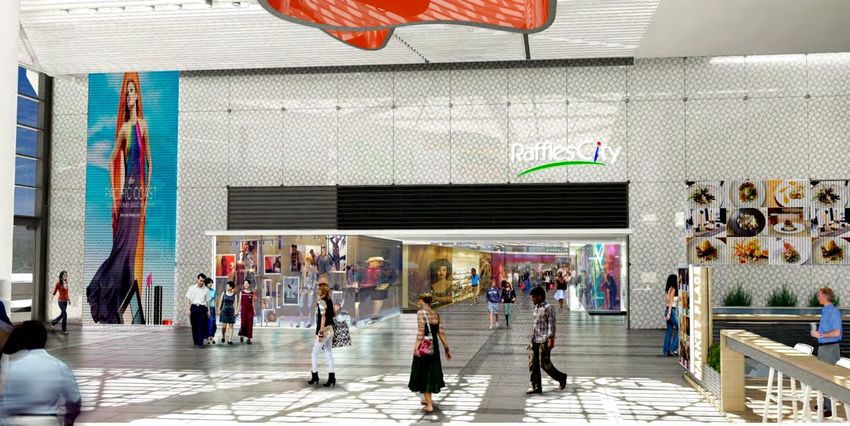
3Q 2017 Distributable Income Up 0.3% Y-o-Y
                                                                                                           Distributable Income (S$ mil)
     Distributable Income                         Distribution Per Unit (DPU)                                         (1)                       (1)
                                                                                                               98.7                      98.4

       S$98.7                                           2.78
                              (1)

       million                                          cents
              0.3% Y-o-Y                                unchanged Y-o-Y                                      3Q 2017                   3Q 2016

                       DPU (cents)
                                                             Annualised DPU                                Annualised Distribution
               2.78                      2.78
                                                                                                                    Yield

                                                              11.03                                           5.41
                                                              cents                                           %
                                                                                                           (Based on closing unit price of
             3Q 2017                   3Q 2016                       0.3% Y-o-Y                            S$2.040 on 20 October 2017)

    (1) Capital distribution of S$6.6 million and capital distribution & tax exempt income of S$6.5 million received from CapitaLand Retail China Trust
        (‘CRCT’) in 3Q 2017 and 3Q 2016 respectively had been retained for general corporate and working capital purposes.

6                                                    Morgan Stanley 16th Annual Asia Pacific Summit *November 2017*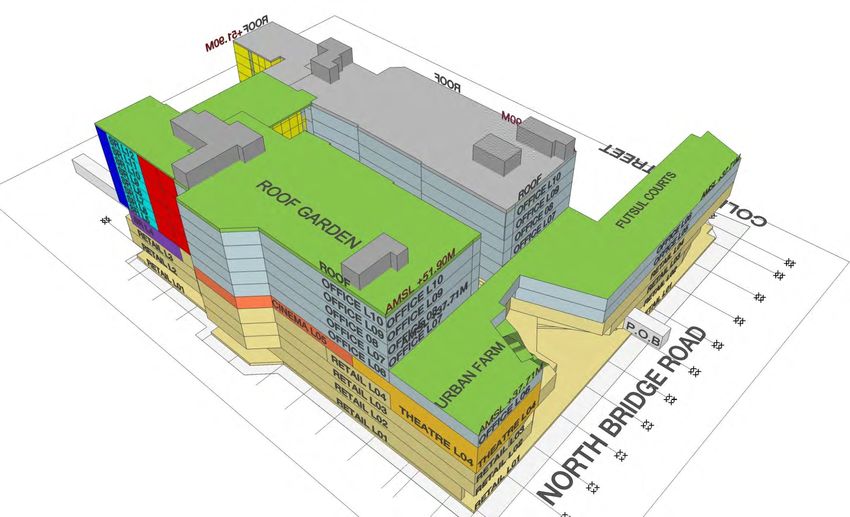
YTD Sep 2017 Distributable Income Up 0.2% Y-o-Y
                                                                                                               Distributable Income (S$ mil)
     Distributable Income                            Distribution Per Unit (DPU)                                           (1)                        (2)
                                                                                                                   292.9                      292.3

        S$292.9                                           8.26
                                    (1)

        million                                           cents
               0.2% Y-o-Y                                       0.1% Y-o-Y                                     YTD Sep 2017               YTD Sep 2016

                       DPU (cents)
                                                               Annualised DPU                                   Annualised Distribution
                8.26                       8.25
                                                                                                                         Yield

                                                                 11.04                                             5.41
                                                                 cents                                             %
                                                                                                                (Based on closing unit price of
           YTD Sep 2017               YTD Sep 2016                      0.2% Y-o-Y                              S$2.040 on 20 October 2017)

    (1) For YTD Sep 2017, CMT had retained S$7.6 million of its taxable income available for distribution to Unitholders for distribution in FY 2017. Capital
        distribution and tax exempt income distribution of S$12.4 million received from CRCT in YTD Sep 2017 had also been retained for general corporate
        and working capital purposes.
    (2) For YTD Sep 2016, CMT had retained S$12.0 million of its taxable income available for distribution to Unitholders for distribution in FY 2016. Capital
        distribution and tax exempt income distribution of S$12.9 million received from CRCT in YTD Sep 2016 had also been retained for general corporate
        and working capital purposes.

7                                                      Morgan Stanley 16th Annual Asia Pacific Summit *November 2017*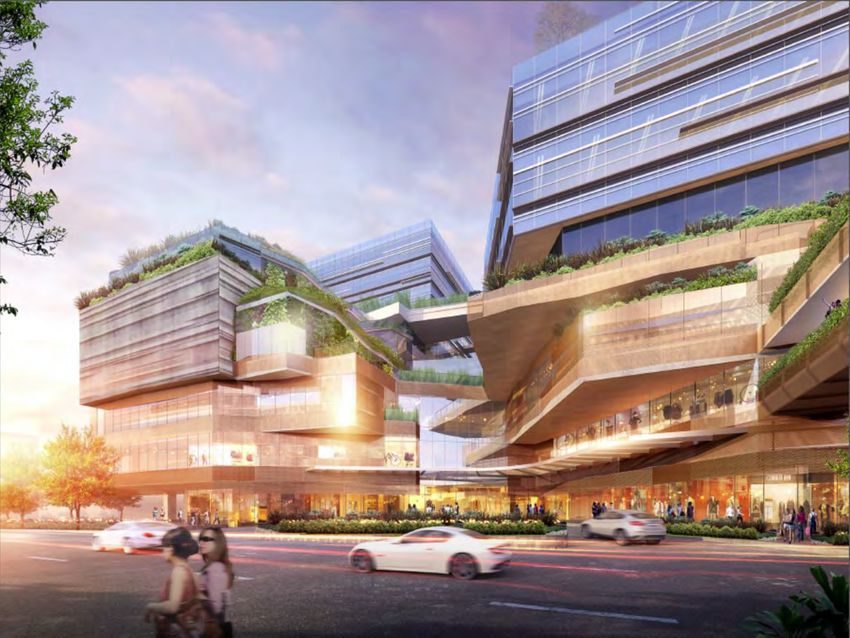
3Q 2017 Financial Performance
       Gross Revenue                              Net Property Income                            Distributable Income

          S$169.4                                      S$121.4                                        S$98.7               (1)

          million                                      million                                        million
                 0.2% Y-o-Y                                   1.6% Y-o-Y                                     0.3% Y-o-Y

    S$ million
                                                                                                      3Q 2017          3Q 2016
                  169.4        169.7

                                                            121.4         119.5
                                                                                                        98.7 (1)     98.4 (1)

                 Gross Revenue                         Net Property Income                        Distributable Income
    (1) Capital distribution of S$6.6 million and capital distribution & tax exempt income of S$6.5 million received from CRCT in 3Q 2017 and
        3Q 2016 respectively had been retained for general corporate and working capital purposes.

8                                             Morgan Stanley 16th Annual Asia Pacific Summit *November 2017*
YTD Sep 2017 Financial Performance
         Gross Revenue                                 Net Property Income                              Distributable Income

             S$510.1                                        S$359.0                                          S$292.9                 (1)

             million                                        million                                          million
                   2.0% (2)Y-o-Y                                  1.2% (2)Y-o-Y                                     0.2% Y-o-Y

      S$ million
                                                                                               YTD Sep 2017              YTD Sep 2016
                      510.1         520.4

                                                                   359.0         363.5                                  (1)          (3)
                                                                                                               292.9          292.3

                     Gross Revenue                           Net Property Income                          Distributable Income
    (1) For YTD Sep 2017, CMT had retained S$7.6 million of its taxable income available for distribution to Unitholders for distribution in FY 2017.
        Capital distribution and tax exempt income distribution of S$12.4 million received from CRCT in YTD Sep 2017 had also been retained for
        general corporate and working capital purposes.
    (2) The decrease was mainly due to Funan which was closed in July 2016 for redevelopment.
    (3) For YTD Sep 2016, CMT had retained S$12.0 million of its taxable income available for distribution to Unitholders for distribution in FY 2016.
        Capital distribution and tax-exempt income distribution of S$12.9 million received from CRCT in YTD Sep 2016 had also been retained for
        general corporate and working capital purposes.

9                                                 Morgan Stanley 16th Annual Asia Pacific Summit *November 2017*
Debt Maturity Profile1 as at 30 September 2017
             700
                                                                                      -
                          605.2                 596.7
             600                  (2)
                                                           (2)                (2)
                           100.0                100.0
                                                                                                484.0
             500                                                                                                            460.0         450.0
                                                                                                       (2)
                                                           (4)                                      72.0
                                               162.0
                                               162.0                     381.0
                                                                                                                                    (2)
             400                                                                                                            120.0
S$ million

                                                                                    (2)
                                                                          48.0
                                                                                                              235.7
             300                                                                                                    (2)     100.0         300.0
                                                           (5)                                                5.6
                                                                         100.0
                                 (3)
                          505.2                 157.6
                                                                                                350.0                            (9)                                               199.0
             200                                                                    (6)                                     100.0                                                          (12)
                                                                         126.0
                                                                                                                      (8)
                                                                                                              190.1                                                                  99.0                        (13)

             100                                                                                                                (10)                                                                    192.8
                                                177.1                                                                                     150.0                                                                                                         150.0
                                                                                                                                                                    (11)
                                                                                                                            140.0
                                                                        107.0                          (7)                                                  108.3                   100.0
                                                                                                    62.0      40.0
               0
                          2018                 2019                     2020                   2021          2022           2023          2024              2025                   2026                  2027                                          2031
                               Un secu red Ba nk Lo an s                                                                                    No tes issu ed u nde r Euro -Med ium Term N ote ('EMTN' ) Pro gra mme

                               Se cured Bank L oan s - 3 0.0% intere st i n Infini ty Ma ll Trust                                           No tes issu ed u nde r Med ium Term N ote ('MTN') Pro gra mme

                               Re tail Bo nd s d ue 2 02 1 at fi xed ra te of 3 .08% p.a.                                                   No tes issu ed u nde r RCS Trust Euro -Med iu m Te rm N ote ('EM TN ') Prog ramme - 4 0.0% i ntere st in RCS Trust

                               Un secu red Ba nk Lo an s - 4 0.0% i ntere st i n RC S Tru st

                   (1)    Includes CMT’s share of borrowings in RCS Trust (40.0%) and Infinity Mall Trust (30.0%).
                   (2)    S$1.114 billion unsecured bank loans/notes by RCS Trust. CMT’s 40.0% share thereof is S$445.6 million.
                   (3)    US$400.0 million 3.731% fixed rate notes ('EMTN Series 2') were swapped to S$505.2 million at a fixed rate of 3.29% p.a. in M arch 2012.
                   (4)    S$540.0 million secured bank loans by Infinity Mall Trust due in October 2019. CMT’s 30.0% share thereof is S$162.0 million.
                   (5)    ¥10.0 billion 1.309% fixed rate notes ('EMTN Series 4') were swapped to approximately S$157.6 million at a fixed rate of 2.79% p.a. in October 2012.
                   (6)    ¥10.0 billion 1.039% fixed rate notes ('MTN Series 10') were swapped to S$126.0 million at a fixed rate of 3.119% p.a. in November 2013.
                   (7)    ¥5.0 billion floating rate (at 3 months JPY LIBOR + 0.48% p.a.) notes ('MTN Series 12') were swapped to S$62.0 million at a fixed rate of 3.148% p.a. in February 2014.
                   (8)    HK$1.15 billion 3.76% fixed rate notes ('EMTN Series 3') were swapped to S$190.1 million at a fixed rate of 3.45% p.a. in June 2012.
                   (9)    ¥8.6 billion floating rate (at 3 months JPY LIBOR + 0.25% p.a.) notes ('MTN Series 16') were swapped to S$100.0 million at a fixed rate of 2.85% p.a. in February 2015.
                   (10)   HK$885.0 million 3.28% fixed rate notes ('EMTN Series 5') were swapped to S$140.0 million at a fixed rate of 3.32% p.a. in November 2012.
                   (11)   HK$650.0 million 3.25% fixed rate notes ('MTN Series 14') were swapped to S$108.3 million at a fixed rate of 3.25% p.a. in November 2014.
                   (12)   HK$560.0 million 2.71% fixed rate notes (‘MTN Series 18’) were swapped to S$99.0 million at a fixed rate of 2.928% p.a. in July 2016.
                   (13)   HK$1.104 billion 2.77% fixed rate notes ('MTN Series 15') were swapped to S$192.8 million at a fixed rate of 3.25% p.a. in February 2015.

  10                                                                                                 Morgan Stanley 16th Annual Asia Pacific Summit *November 2017*
Key Financial Indicators
As at As at
30 September 2017 30 June 2017
Unencumbered Assets as % of Total Assets 100.0% 100.0%
Aggregate Leverage(1) 34.7% 34.7%
Net Debt / EBITDA(2) 6.5x 6.5x
Interest Coverage(3) 4.8x 4.8x
Average Term to Maturity (years) 4.8 5.0
Average Cost of Debt(4) 3.2% 3.2%
CMT’s Issuer Rating(5) ‘A2’
(1) In accordance to Property Funds Appendix, CMT’s proportionate share of its joint ventures borrowings and total deposited
property are included when computing the aggregate leverage. Funds raised ahead of the maturity of the existing borrowings
of CMT are excluded from both borrowings and total deposited property for the purpose of computing the aggregate leverage
as the funds are set aside solely for the purpose of repaying the existing borrowings of CMT.
(2) Net Debt comprises gross debt less temporary cash intended for refinancing and capital expenditure. EBITDA refers to earnings
before interest, tax, depreciation and amortisation.
(3) Ratio of net investment income at CMT Group before interest and tax over interest expense from 1 January 2017 to 30
September 2017.
(4) Ratio of interest expense over weighted average borrowings.
(5) Moody’s Investors Service has affirmed the ‘A2’ issuer rating of CMT on 16 July 2015.
11 Morgan Stanley 16th Annual Asia Pacific Summit *November 2017*Valuations and Valuation Cap Rates
Valuation Valuation Variance Valuation Valuation Cap Rate Valuation Cap Rate
as at 30 Jun 17 as at 31 Dec 16 as at 30 Jun 17 as at 30 Jun 17 as at 31 Dec 16
S$ million S$ million S$ million S$ per sq ft NLA % %
Tampines Mall 1,039.0 994.0 45.0 2,930 4.85 5.35
Junction 8 732.0 703.0 29.0 2,891 4.85 5.35
Retail: 6.25 Retail: 6.50
IMM Building 640.0 624.0 16.0 666 (1)
Warehouse: 7.25 Warehouse: 7.50
Plaza Singapura 1,279.0 1,257.0 22.0 2,655 4.50 5.00
Bugis Junction 1,062.0 1,014.0 48.0 2,678 4.85 5.35
Sembawang Shopping Centre 126.0 118.0 8.0 882 5.05 5.55
JCube 288.0 288.0 - 1,392 5.00 5.50
Lot One Shoppers’ Mall 531.0 512.0 19.0 2,415 4.85 5.35
Bukit Panjang Plaza 322.0 310.0 12.0 1,970 4.95 5.45
(1) Retail: 4.75 Retail: 5.25
The Atrium@Orchard 747.0 735.0 12.0 1,926
Office: 3.75 Office: 4.00
Clarke Quay 389.0 389.0 - 1,326 5.00 5.50
Bugis+ 344.0 340.0 4.0 1,602 5.30 5.70
Bedok Mall 780.0 780.0 - 3,506 4.75 5.20
Total CMT Portfolio excluding Funan, Raffles City
8,279.0 8,064.0 215.0
Singapore and Westgate
(3) (3) Retail: 4.85 Retail: 5.15
(2)
Funan 422.0 421.0 1.0 N.M. Office: 4.10 Office: 4.15
(4)
SR: 5.00 (4) SR: 5.00
Total CMT Portfolio including Investment
Properties Under Development and excluding 8,701.0 8,485.0 216.0
Raffles City Singapore and Westgate
Less additions during the period (8.5)
Net increase in valuations 207.5
Retail: 4.85 Retail: 5.25
(5)
Raffles City Singapore (40.0% interest) 1,300.0 1,267.6 32.4 N.M. Office: 4.10 Office: 4.25
Hotel: 4.75 Hotel: 5.11
(6)
Westgate (30.0% interest) 289.5 319.2 (29.7) 2,344 4.75 5.20
Share of Joint Ventures’ investment properties 1,589.5 1,586.8 2.7
Less additions during the period (6.8)
Net decrease in valuations (4.1)
(1) Reflects valuation of the property in its entirety.
(2) Funan, which is undergoing redevelopment into an integrated development, has been reclassified from Investment Properties to
Investment Properties Under Development in 2016.
(3) As the property is undergoing redevelopment into an integrated development, the value reflected is the total land value of the
integrated development.
(4) SR – serviced residences.
(5) Not meaningful because Raffles City Singapore comprises retail units, office units, hotels and convention centre.
(6) The decrease in the valuation of Westgate was largely due to lower rent reversions as well a lower market rental forecast in view of the
increased competition in the western region of Singapore.
12 Morgan Stanley 16th Annual Asia Pacific Summit *November 2017*Healthy Balance Sheet
As at 30 September 2017
S$’000
Non-current Assets 9,873,669 Net Asset Value/Unit
S$1.95
(as at 30 September 2017)
Current Assets 677,755
Adjusted Net Asset Value/Unit
Total Assets 10,551,424 S$1.92
(excluding distributable income)
Current Liabilities 754,367
Non-current Liabilities 2,884,274
Total Liabilities 3,638,641
Net Assets 6,912,783
Unitholders’ Funds 6,912,783
Units in Issue (’000 units) 3,545,794
13 Morgan Stanley 16th Annual Asia Pacific Summit *November 2017*Portfolio Updates
Bukit Panjang Plaza(1)
Shopper Traffic
YTD Sep 2017 Increased by 0.2% Y-o-Y
300
Shopper Traffic (million)
250
200
150
100
50
0
YTD Sep 2017 YTD Sep 2016
(1) For comparable basis, CMT portfolio excludes Funan which was closed in July 2016 for redevelopment.
15 Morgan Stanley 16th Annual Asia Pacific Summit *November 2017*(1)
Tenants’ Sales Psf Per Month
YTD Sep 2017 Held Steady Y-o-Y
100
Tenants’ Sales ($ psf/mth)
75
50
YTD Sep 2017 YTD Sep 2016
(1) For comparable basis, CMT portfolio excludes Funan which was closed in July 2016 for redevelopment.
16 Morgan Stanley 16th Annual Asia Pacific Summit *November 2017*Tenants’ Sales by Trade Categories in YTD Sep 2017
Cautious Consumer Spending
30 27.5
25
Y-o-Y Variance of Tenants’ Sales $ psf/mth (%)
20 15.5 14.5
15
10 8.2
4.4 3.9
5 2.0 1.2 0.3
0
-5 (0.3)
(2.0) (2.7) (2.7)
(4.2)
-10 (7.4)
-15 (12.9) (13.3)
-20
(1)
(2)
Jewellery & Watches
Shoes & Bags
Home Furnishing
Department Store
Sporting Goods
Beauty & Health
IT & Telecommunications
Toys & Hobbies
Gifts & Souvenirs
Food & Beverage
Leisure & Entertainment
Fashion
Music & Video
Books & Stationery
Services
Supermarket
Electrical & Electronics
(1) Includes convenience stores, bridal shops, optical shops, film processing shops, florists, magazine stores, pet
shops, travel agencies, cobblers/ locksmiths, laundromats and clinics.
(2) ‘Information Technology’ and ‘Telecommunications’ have been reclassified into ‘IT & Telecommunications’
due to similar product offerings.
17 Morgan Stanley 16th Annual Asia Pacific Summit *November 2017*Rental Reversions
From 1 January to 30 September 2017 (Excluding Newly Created and Reconfigured Units)
Net Lettable Area Increase in Current
Rental Rates vs
Number of Retention Preceding Rental
Percentage
Property Renewals / Rate Area Rates
of Property
New Leases (%) (sq ft) (typically committed
(%)
three years ago)
(%)
Tampines Mall 31 77.4 53,974 15.2 (4.3)
Junction 8 46 69.6 81,526 32.2 3.3
IMM Building(1) 27 81.5 99,523 23.5 0.9
Plaza Singapura 55 90.9 98,407 20.4 0.3
Bugis Junction 53 84.9 50,342 12.7 2.5
Raffles City Singapore(1) 37 86.5 52,626 12.4 (1.5)
Lot One Shoppers’ Mall 57 86.0 57,241 26.0 0.8
Bukit Panjang Plaza 17 88.2 17,939 11.0 1.8
The Atrium@Orchard(1) 7 71.4 6,641 4.9 5.1
Clarke Quay 10 90.0 31,285 10.7 0.3
Bugis+ 9 88.9 22,744 10.6 0.4
Westgate 70 72.9 69,859 17.0 (10.5)
Bedok Mall 74 74.3 97,706 43.9 (6.0)
Other assets(2) 53 77.4 29,859 8.5 (1.9)
CMT Portfolio(3) 546 80.2 769,672 17.7 (1.7)
(1) Based on retail leases only.
(2) Includes Sembawang Shopping Centre and JCube.
(3) Excludes Funan which was closed in July 2016 for redevelopment.
18 Morgan Stanley 16th Annual Asia Pacific Summit *November 2017*Portfolio Lease Expiry Profile(1)
as at 30 September 2017
Weighted Average Expiry by Gross Rental Income 2.0 Years
Gross Rental Income per Month(2)
Number of Leases S$’000 % of Total
(3)
2017 139 1,777 3.1
2018 1,015 17,423 30.0
2019 918 17,486 30.1
2020 706 13,623 23.4
2021 79 3,510 6.0
2022 and beyond 42 4,297 7.4
Total 2,899 58,116 100.0
(1) Based on committed leases. Includes CMT’s 40.0% interest in Raffles City Singapore (excluding hotel
lease), CMT’s 30.0% interest in Westgate and excludes Funan which was closed in July 2016 for
redevelopment.
(2) Based on the month in which the lease expires and excludes gross turnover rent.
(3) Of which 108 leases are retail leases.
19 Morgan Stanley 16th Annual Asia Pacific Summit *November 2017*Portfolio Lease Expiry Profile for 2017 (1)
Net Lettable Area Gross Rental Income
Number of
As at 30 September 2017 Leases % of Property NLA(2) % of Property Income(3)
Tampines Mall 1 10.9 5.1
Junction 8 6 1.3 2.7
IMM Building(4) 42 5.1 3.0
Plaza Singapura 7 1.3 2.5
Bugis Junction 2 2.4 1.6
Raffles City Singapore(4) 8 3.1 3.8
Lot One Shoppers’ Mall 8 1.1 2.4
Bukit Panjang Plaza 15 4.5 8.5
The Atrium@Orchard(4) 4 4.3 5.9
Clarke Quay 1 0.3 0.1
Bugis+ 1 0.9 1.5
Westgate 15 4.3 3.3
Bedok Mall 3 0.8 0.5
Other assets(5) 26 2.6 3.6
CMT Portfolio 139(6) 3.4 3.1
(1) Based on committed leases. Includes CMT’s 40.0% interest in Raffles City Singapore (excluding hotel lease),
CMT’s 30.0% interest in Westgate and excludes Funan which was closed in July 2016 for redevelopment.
(2) As a percentage of net lettable area for each respective property as at 30 September 2017.
(3) As a percentage of gross rental income for each respective property and excludes gross turnover rent.
(4) Includes non-retail leases for IMM Building, Raffles City Singapore and The Atrium@Orchard.
(5) Includes Sembawang Shopping Centre and JCube.
(6) Of which 108 leases are retail leases.
20 Morgan Stanley 16th Annual Asia Pacific Summit *November 2017*High Occupancy Maintained
31 Dec 31 Dec 31 Dec 31 Dec 31 Dec 31 Dec 31 Dec 31 Dec 31 Dec 30 Sep
(%, As at)
2008 2009 2010 2011 2012 2013 2014 2015 2016 2017
Tampines Mall 100.0 100.0 100.0 100.0 100.0 100.0 99.5 100.0 99.2 100.0
Junction 8 100.0 100.0 100.0 100.0 99.6 99.4 100.0 100.0 99.9 99.9
(1)
Funan 99.8 99.3 100.0 100.0 100.0 98.2 97.9 95.3 NA NA(1)
(3)
IMM Building(2) 100.0 99.7 100.0 100.0 98.1 99.0 96.0 96.0 97.9 97.9
Plaza Singapura 99.8 100.0 100.0 100.0 91.3 100.0 100.0 99.7 100.0 99.7
Bugis Junction 100.0 100.0 100.0 100.0 100.0 100.0 100.0 99.7 99.9 100.0
(4) (3)
Other assets 100.0 99.8 99.8 80.9 99.8 100.0 98.1 92.6 95.3 97.8
(2)
Raffles City Singapore 100.0 100.0 99.6 100.0 100.0 100.0 100.0 99.6 99.7 99.8
Lot One Shoppers' Mall 99.3 99.9 99.6 99.7 99.8 100.0 100.0 99.8 99.9 99.7
Bukit Panjang Plaza 100.0 99.8 100.0 100.0 100.0 99.8 100.0 97.8 99.9 99.6
(5) (3)
The Atrium@Orchard 98.0 99.1 93.5 65.5 95.3 99.5 99.9 98.2 97.6 98.6
Clarke Quay 100.0 100.0 97.9 100.0 95.9 88.2 90.7 96.6
Bugis+ 99.5 100.0 100.0 99.2 100.0 100.0
Westgate 85.8 97.7 97.6 99.6 98.5
Bedok Mall 99.9 100.0 98.7
CMT Portfolio 99.7 99.8 99.3 94.8 98.2 98.5 98.8 97.6 98.5 99.0
(3.6)
(1) Not applicable because Funan was closed in July 2016 for redevelopment.
(2) Based on retail leases only.
(3) Lower occupancy rates were mainly due to AEI.
(4) Other assets include:
a) Sembawang Shopping Centre, except for 2008 when it underwent an AEI;
b) Rivervale Mall, until it was sold in 2015;
c) Hougang Plaza, until it was sold in 2012;
d) JCube, except from 2008 to 2011 when it underwent an AEI; and
e) Bugis+, which was acquired in 2011 and subsequently underwent an AEI from November 2011 to July 2012.
The asset was classified separately from 2012 onwards.
(5) Includes retail and office leases.
21 Morgan Stanley 16th Annual Asia Pacific Summit *November 2017*Average Occupancy Cost (1)
19.0% 18.5%
(1,2) (1,3)
FY 2016 FY 2015
(1) Occupancy cost is defined as a ratio of gross rental (inclusive of service charge, advertising & promotional charge
and gross turnover rent) to tenants’ sales.
(2) FY 2016 includes the entire portfolio and excludes Funan.
(3) FY 2015 includes the entire portfolio including Bedok Mall; and excludes Bugis Junction as well as Rivervale Mall.
On a comparable mall basis (includes Bugis Junction and excludes Funan), the occupancy cost was 19.2% for FY
2015.
22 Morgan Stanley 16th Annual Asia Pacific Summit *November 2017*Asset Enhancement Initiatives (‘AEI’)
WestgateOn-going AEI
*Artist’s impression of proposed integrated development
Malls Funan Raffles City Singapore
Target Completion Date 4Q 2019 1Q 2018
Area of work Funan will undergo three years of Raffles City Singapore will embark
redevelopment work. The new on interior rejuvenation works. The
integrated development will improvements will cover the main
comprise retail, office and serviced entrance and mall interiors,
residence components. including the Central Atrium at
Level 3.
24 Morgan Stanley 16th Annual Asia Pacific Summit *November 2017*AEI – Funan
Funan
*Artist’s impression of proposed integrated developmentFunan – A Creative Intersection
This iconic landmark offers unparalleled connectivity and convenience, enabling
Funan to actively host communities and catalyse creative collaborations
Artist’s
Artistimpression of proposed
Impression: Subjectintegrated
to Changesdevelopment.
26 Morgan Stanley 16th Annual Asia Pacific Summit *November 2017*Proposed Integrated Development(1)
Serviced
Residences Office Tower 1
Retail
Office Tower 2
(1) Subject to final development plan and approvals.
27 Morgan Stanley 16th Annual Asia Pacific Summit *November 2017*Redevelopment Details
Existing Proposed
Serviced
Retail Retail Office Total
Residences
Gross Plot Ratio 3.88 7.0
Gross Floor Area
482,097 503,900(2) 262,900 121,600 888,400(2)
(sq ft)(1)
Gross Floor Area
100% 57% 29% 14% 100%
Allocation
Net Lettable
298,814 325,000(2) 204,000 80,000 609,000(2)
Area (sq ft)(1)
Efficiency 62% 65% 78% 66% 69%
(1) Proposed areas are approximate figures.
(2) Includes Community/Sports Facilities Scheme (‘CSFS’) area of approximately 18,100 sq ft.
28 Morgan Stanley 16th Annual Asia Pacific Summit *November 2017*Funan Showsuite
One-of-a-Kind Experiential Showsuite Launched on 27 April 2017
29 Morgan Stanley 16th Annual Asia Pacific Summit *November 2017*Funan Leasing Update
– Strong Retail Leasing Interest
About 30% Committed Occupancy(1) Committed Tenants
Artist’s impression.
(1) As at 30 June 2017.
30 Morgan Stanley 16th Annual Asia Pacific Summit *November 2017*Divestment of Serviced Residences in Funan
Value Creation Through An Improved Risk-Return Profile
• Sale of all units in Victory SR Trust, which owns
the serviced residence component of Funan
- Agreed land value(1) of S$90.5 million
• Divestment Rationale
- Joint development with strong and reliable
partner
- Reduces development risks
- Reduces funding requirements
- Improves the return of investment for
Funan’s redevelopment
*Artist’s impression of proposed integrated development
(1) As at 1 August 2017, Savills – an independent property valuer appointed by CMTML – has valued the land component of Funan’s
serviced residence at S$86.5 million, while Knight Frank – an independent valuer appointed by CMT’s trustee, has valued the same land
component at S$75.0 million.
31 Morgan Stanley 16th Annual Asia Pacific Summit *November 2017*AEI - Raffles City Singapore
Raffles City SingaporeRejuvenation of Raffles City Shopping Centre
Raffles City Shopping Centre will undergo interior rejuvenation
works amounting S$54.0 million from 3Q 2016 to 1Q 2018.
Works include –
• Refreshing the main entrance
• Refurbishing the mall interiors and upgrading the lift
lobbies
• Revamping the Central Atrium at Level 3
Rationale:
To refresh the mall and enhance the shopping experience,
reinforcing Raffles City Shopping Centre’s position as one of
Singapore’s top shopping destinations
33 Morgan Stanley 16th Annual Asia Pacific Summit *November 2017*Refresh the Main Entrance
Creating a Strong Sense of Arrival with New Entrance and Extended Canopy
Artist’s impression.
34 Morgan Stanley 16th Annual Asia Pacific Summit *November 2017*Refurbish Mall Interiors
A New Look with Enhanced Ceiling, Flooring
Artist’s impression.
35 Morgan Stanley 16th Annual Asia Pacific Summit *November 2017*Refurbish Mall Interiors
New Finishes at Momentum Court and Upgraded Water Feature at Vitality Court
Artist’s impression.
36 Morgan Stanley 16th Annual Asia Pacific Summit *November 2017*Creation of Level 3 Centre-Piece
Revamp of Level 3 Central Atrium with New Centre-Piece as Focal Point
Artist’s impression.
37 Morgan Stanley 16th Annual Asia Pacific Summit *November 2017*Striving for Excellence
38 Morgan Stanley 16th Annual Asia Pacific Summit *November 2017*
Bedok MallFulfilling Shoppers’ Aspirations
Staying Ahead of Retail Trends with New Offerings
Haidilao Hot Pot at Ah Mah Homemade Cake at
Bedok Mall Bukit Panjang Plaza
Original Cake at TOG Flagship at
Westgate Bugis+
39 Morgan Stanley 16th Annual Asia Pacific Summit *November 2017*Fulfilling Shoppers’ Aspirations
Staying Ahead of Retail Trends with New Offerings
3INA at SEOUL BEAUTE at
Tampines Mall Bugis+
MDREAMS at Urban Revivo at
Raffles City Singapore Plaza Singapura
40 Morgan Stanley 16th Annual Asia Pacific Summit *November 2017*Going Beyond Shopping
Engaging Communities where Our Malls Operate
BigHearts Community
Carnival at
Lot One Shoppers’ Mall
Diversity Jamboree at
Bukit Panjang Plaza SmartParents Family Fun at
Bukit Panjang Plaza
41 Morgan Stanley 16th Annual Asia Pacific Summit *November 2017*Awards and Accolades
July 2017 September 2017
SILVER WINNER
Best Annual Report – Singapore Corporate Governance Award,
REITs & Business Trusts REITs & Business Trusts
Singapore Corporate Securities Investors Association (Singapore)
Awards August 2017 18th Investors’ Choice Awards
PLATINUM
Best of the Breeds REITs Award - Retail (SG)
The 4th Edition REITs Asia Pacific Conference 2017
September 2017
REGIONAL SECTOR LEADER
August 2017 Asia (Retail-Listed) September 2017
Global Real Estate Sustainability
Benchmark 2017 2ND RUNNER UP (WESTGATE)
WINNER
SGTI Award, REIT and Business Trust Energy Efficient Building Award,
Singapore Governance and Transparency New & Existing Category
Index (SGTI) Award 35th ASEAN Ministers on Energy Meeting
(AMEM)
42 Morgan Stanley 16th Annual Asia Pacific Summit *November 2017*Looking Forward
Clarke Quay
Ng Guan Shyh (Singapore), CapitaLand ‘Building People’ Photography Competition 2014Looking Forward
• The Singapore economy grew by 4.6%(1) on a year-on-year basis in 3Q 2017. Singapore Government narrowed
2017 GDP growth forecast to ‘2.0% to 3.0%’(2), from ‘1.0% to 3.0%’
• Focus on the active lease management for the remaining 139 leases due for renewal in 2017 and operational
excellence
• Create a seamless offline and online experience at Bugis+ and Plaza Singapura
• Unlock value through asset enhancement initiatives
• Focus on the asset enhancement works in Raffles City Singapore and target completion in 1Q 2018
• Focus on the redevelopment and leasing at Funan
• Focus on asset planning and identifying opportunities to unlock value
(1) Based on advance estimates published by the Ministry of Trade and Industry Singapore on 13 October 2017.
(2) Based on 2017 GDP growth forecast published by the Ministry of Trade and Industry Singapore on 11 August 2017.
44 Morgan Stanley 16th Annual Asia Pacific Summit *November 2017*Thank you
For enquiries, please contact: Ms Audrey Tan, Investor Relations,
Direct: (65) 6713 1507 Email: audrey.tan@capitaland.com
CapitaLand Mall Trust Management Limited (http://www.cmt.com.sg)
168 Robinson Road, #30-01 Capital Tower, Singapore 068912
Tel: (65) 6713 2888; Fax: (65) 6713 2999Annexes
46 Morgan Stanley 16th Annual Asia Pacific Summit *November 2017*
Bukit Panjang PlazaCapitaLand Mall Trust
– Major REIT in CapitaLand Group
• Regional Investments (1)
• CapitaLand Investment Management
CapitaLand CapitaLand CapitaLand The Ascott
China Mall Asia Singapore (2) Limited
CapitaLand CapitaLand CapitaLand Malaysia CapitaLand Ascott
Retail China Trust Mall Trust Mall Trust Commercial Trust Residence Trust
Group Managed Real Estate Assets* (as at 30 June 2017): S$80.2 billion
(1) Include StorHub and businesses in Vietnam, Indonesia, Japan and others
(2) Includes residential portfolio in Malaysia
* Refers to total value of all real estate managed by CapitaLand Group entities stated at 100% of property carrying value
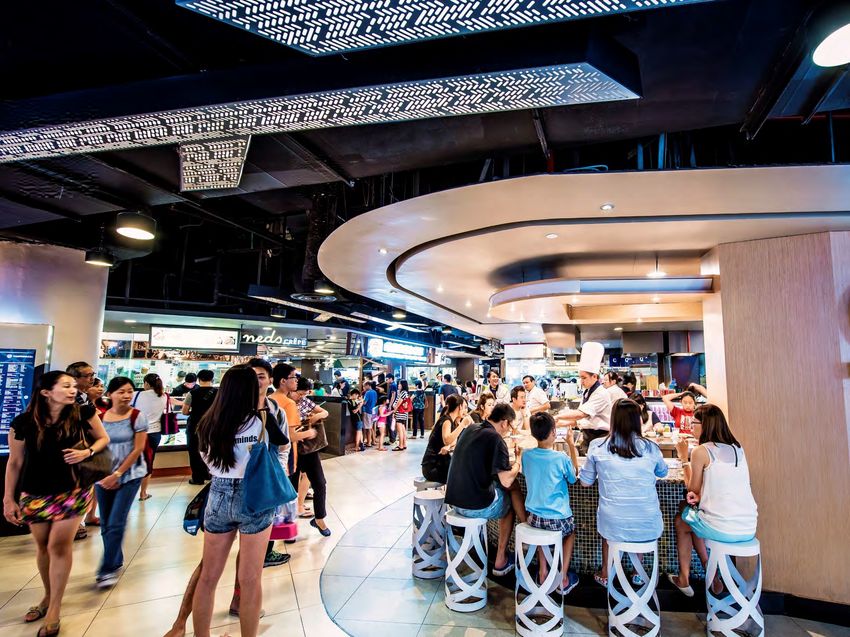
47 Morgan Stanley 16th Annual Asia Pacific Summit *November 2017*Singapore REIT Landscape
CMT: Largest Retail S-REIT by Market Capitalisation(1);
‘A2’ Issuer Rating
Total Assets
42 REITs and business trusts in Singapore (2)
(S$ million)
12,000
AREIT CMT
10,000
Suntec
8,000 CCT KREIT
Fortune
6,000 MCT MGCCT
MLT
ART
4,000 MINT Frasers Starhill OUECT
SPH FCT Hospitality
LippoMall FEHT CDREIT Indiabulls
Frasers
2,000 Keppel FCOT CRCT Parkway OUEHT
Logistic Ascendas Viva
Religare India DC ESR
EC FIRT
Soilbuild Industrial IREIT Cache
Health World Manulife BHG Sabana
US Retail Global
0
25% 30% 35% 40% 45%
Aggregate Leverage
Source: Bloomberg and companies data
(1) Size of bubble denotes market capitalisation and balance sheet data available as at 30 October 2017.
(2) Based on UBS Singapore Property SREIT valuation guide as at 23 October 2017.
48 Morgan Stanley 16th Annual Asia Pacific Summit *November 2017*Acquisitions & Development Track Record
– From 3 to 16 Assets(1)
Divestment
of Rivervale
27.2% stake in CRS (2) Mall
+
Acquisition
Divestment of
Remaining 72.8% of Hougang
Hougang stake in CRS (2) Plaza
Plaza(3)
2003 2005 2007 2010 2012 2015
2002 2004 2006 2008 2011 2013 2017
The Divestment
IPO Atrium@Orchard of Funan
(40.0% stake) Serviced
Residences
(30.0% stake)
(20.0% stake (4))
(1) 16 assets, after acquisition of Bedok Mall in October 2015 and divestment of Rivervale Mall in December 2015.
(2) Acquisition of Class ‘E’ bonds issued by CapitaRetail Singapore Limited (‘CRS’) which owned Lot One Shoppers’ Mall, Bukit Panjang
Plaza (90 out of 91 strata lots) and Rivervale Mall.
(3) 92.4% stake purchase; 100.0% of the strata area was acquired in June 2006.
(4) 13.6% stake as at 30 September 2017.
49 Morgan Stanley 16th Annual Asia Pacific Summit *November 2017*Market Leadership in Singapore Retail
S$7.1b 16 ~2,900 5.5m 15-year
Market Properties in Extensive Network sq ft NLA(2) Track Record
Capitalisation(1) Singapore of Tenants
Bugis+ Bukit Panjang Plaza Clarke Quay
Bedok Mall Bugis Junction
Funan (3) IMM Building JCube Junction 8 Lot One Shoppers’ Mall
Raffles City
Singapore
Plaza Singapura Sembawang SC Tampines Mall The Atrium@Orchard Westgate (30% stake)
(40% stake)
(1) Above information as at 30 September 2017.
(2) Based on total NLA, including retail, office and warehouse. This excludes Funan, which was closed for redevelopment on 1 July 2016.
(3) Artist’s impression of proposed integrated development.
50 Morgan Stanley 16th Annual Asia Pacific Summit *November 2017*Strategically Located Portfolio
- Close Proximity to Public Transport and Population Catchments
- Create and Offer Lifestyle Shopping Experiences
347.4 million annual shopper traffic(1)
(1) For year ended 31 December 2016. This excludes Funan, which was closed for redevelopment on 1 July 2016.
51 Morgan Stanley 16th Annual Asia Pacific Summit *November 2017*Steady Distributable Income Growth
S$ million
400 392.0 394.3
375.3
356.2
316.9
294.8 301.6
300 282.0
238.4
211.2
200
169.4
126.8
98.1
100
64.9
0
2004
2005
2003
2006
2007
2008
2009
2010
2011
2012
2013
2014
2015
2016
(1) Based on compounded annual growth rate (‘CAGR’).
52 Morgan Stanley 16th Annual Asia Pacific Summit *November 2017*Financial Highlights
Gross Revenue (S$ million)(1) Total Assets
787.2 807.5
774.2
729.2
118.2 117.8
661.6 115.3
91.6
689.7
88.4 637.6 658.9 669.0 10,355.7 10,326.7
573.2 9,858.3
9,159.7 9,220.0
2012 2013 2014 2015 2016
2012 2013 2014 2015 2016
(2) (3)
CMT Group Joint ventures (For information only)
Distributable Income (S$ million) Distribution Per Unit (cents)
11.25 11.13
10.84
375.3 392.0 394.3 10.27
356.2
316.9
9.46
2012 2013 2014 2015 2016 2012 2013 2014 2015 2016
(1) With the adoption of Financial Reporting Standards 111 Joint Arrangements from 1 January 2014, CMT’s 40.0% interest in RCS Trust and 30.0% interest in Infinity Mall Trust and Infinity Office Trust
(collectively, the Infinity Trusts) are accounted for as investments in joint ventures using equity method. For comparison purpose, 2012 to 2013 have been restated to exclude CMT’s 40.0%
interest in RCS Trust and CMT’s 30.0% interest in Infinity Trusts.
(2) On 1 October 2015, CMT acquired all the units in Brilliance Mall Trust (BMT) which holds Bedok Mall. Upon acquisition, BMT became a subsidiary. On 15 December 2015, the sale of Rivervale
Mall was completed. On 30 August 2016, three private trusts namely Victory Office 1 Trust, Victory Office 2 Trust and Victory SR Trust (collectively, the Victory Trusts, each wholly owned by CMT)
were constituted in relation to the redevelopment of Funan. CMT, together with the Victory Trusts jointly own and undertake to redevelop Funan which comprises a retail component (held
through CMT), two office towers and serviced residences.
(3) Joint ventures refer to CMT’s 40.0% interest in RCS Trust and CMT’s 30.0% interest in Infinity Trusts. Westgate, which is owned by Infinity Mall Trust, commenced operations on 2 December
2013.
53 Morgan Stanley 16 Annual Asia Pacific Summit *November 2017*
thPrudent Capital Management
Aggregate Leverage (%)(1,2)
39.0 38.4
38.0
36.7
37.0
35.9
36.0 35.3 35.4
34.8
35.0
33.8
34.0
33.0
32.0
31.0
2010 2011 2012 2013 2014 2015 2016
Net Debt / EBITDA (times)(3) Interest Coverage (times)(4)
7.0 6.3 6.0
6.0 5.0
6.0 5.4 5.4 5.4 4.8 4.8
5.1 5.0 4.5 4.5
4.9 4.2
5.0 3.6
4.0
4.0
3.0
3.0
2.0
2.0
1.0
1.0
0.0 0.0
2010 2011 2012 2013 2014 2015 2016 2010 2011 2012 2013 2014 2015 2016
(1) In accordance to Property Funds Appendix, CMT’s proportionate share of its joint ventures borrowings and total deposited property are included when
computing the aggregate leverage.
(2) Funds raised ahead of the maturity of the existing borrowings of CMT are excluded from both borrowings and total deposited property for the purpose
of computing the aggregate leverage as the funds are set aside solely for the purpose of repaying the existing borrowings of CMT.
(3) Net Debt comprises gross debt less temporary cash intended for refinancing and capital expenditure. EBITDA refers to earnings before interest, tax,
depreciation and amortisation.
(4) Ratio of net investment income at CMT Group before interest and tax over interest expense.
54 Morgan Stanley 16th Annual Asia Pacific Summit *November 2017*Necessity Shopping vs Discretionary Shopping
CMT PORTFOLIO(1)
By Gross Revenue By Asset Valuation
(For FY 2016) (As at 31 December 2016)
(1) Excludes Funan which was closed on 1 July 2016 for redevelopment.
(2) Includes Tampines Mall, Junction 8, IMM Building, Plaza Singapura, Bugis Junction, Sembawang Shopping
Centre, JCube, Lot One Shoppers’ Mall, Bukit Panjang Plaza, The Atrium@Orchard, Bedok Mall and CMT’s
30.0% interest in Westgate.
(3) Includes Clarke Quay, Bugis+ and CMT’s 40.0% interest in Raffles City Singapore.
55 Morgan Stanley 16th Annual Asia Pacific Summit *November 2017*Well-Diversified Trade Mix
CMT PORTFOLIO(1)
% of Gross Rental Income(2)
For the month of
December 2016
Food & Beverage 30.0
Fashion 13.4
Beauty & Health 10.8
Services 6.4
Department Store 6.1
Gifts & Souvenirs / Toys & Hobbies / Books & Stationery/ Sporting Goods 5.4
(3)
Leisure & Entertainment / Music & Video 4.6
Shoes & Bags 4.3
Supermarket 4.1
Office 3.1
Jewellery & Watches 2.7
Home Furnishing 2.6
Electrical & Electronics 1.8
Education 1.4
Warehouse 1.4
Information Technology 1.2
(4)
Others 0.7
Total 100.0
(1) Includes CMT’s 40.0% interest in Raffles City Singapore (excluding hotel lease), CMT’s 30.0% interest in Westgate and excludes Funan
(which was closed in July 2016 for redevelopment).
(2) Excludes gross turnover rent.
(3) Includes tenants approved as thematic dining, entertainment and a performance centre in Bugis+.
(4) Others include Art Gallery and Luxury.
56 Morgan Stanley 16th Annual Asia Pacific Summit *November 2017*Gross Revenue by Property
CMT PORTFOLIO(1)
% of Total Gross Revenue
For FY 2016
Tampines Mall 9.8
Junction 8 7.3
(2)
Funan 1.4
IMM Building 10.0
Plaza Singapura 11.2
Bugis Junction 10.4
Lot One Shoppers' Mall 5.5
Bukit Panjang Plaza 3.5
The Atrium@Orchard 6.1
Clarke Quay 4.5
Bugis+ 4.0
Bedok Mall 7.2
Other assets(3) 4.5
Raffles City Singapore 11.6
Westgate 3.0
Total 100.0
(1) Includes CMT’s 40.0% interest in Raffles City Singapore and CMT’s 30.0% interest in Westgate.
(2) Funan was closed in July 2016 for redevelopment.
(3) Includes Sembawang Shopping Centre and JCube.
57 Morgan Stanley 16th Annual Asia Pacific Summit *November 2017*Top 10 Tenants
10 Largest Tenants Contribute About 19.7% of Total Gross Rental Income(1)
No Single Tenant Contributes More Than 4.0% of Total Gross Rental Income
% of Gross Rental
Tenant Trade Sector
Income
RC Hotels (Pte) Ltd Hotel 3.2
Temasek Holdings (Private) Limited Office 2.6
Supermarket/ Beauty & Health /
Cold Storage Singapore (1983) Pte Ltd 2.5
Services/ Warehouse
Robinson & Co. (Singapore) Pte Ltd Department Store / Beauty & Health 2.5
Supermarket / Beauty & Health /
NTUC Enterprise 2.0
Food & Beverage/ Services
Wing Tai Clothing Pte Ltd Fashion / Sporting Goods 1.6
BHG (Singapore) Pte. Ltd Department Store 1.6
Auric Pacific Group Limited Food & Beverage 1.3
Isetan (Singapore) Limited Department Store / Supermarket 1.2
BreadTalk Pte Ltd Food & Beverage 1.2
Total 19.7
(1) Based on gross rental income for the month of December 2016 and excludes gross turnover rent.
58 Morgan Stanley 16th Annual Asia Pacific Summit *November 2017*Available Retail Floor Space
Retail Space at end-2016: 65.9 million sq ft, of which 49.1%
is estimated to be shopping centre floor space
59 Morgan Stanley 16th Annual Asia Pacific Summit *November 2017*Share of Major Shopping Malls Floor Space by Owner(1)
CMT is the largest shopping mall owner in Singapore owning
14.0% of malls greater than 100,000 sq ft NLA
(2)
(1) Malls greater than 100,000 sq ft NLA as at end-2016. Share of floor space takes into account ownership stake.
(2) CapitaLand’s share only accounts for malls directly owned by CapitaLand and does not include those owned through CMT.
(3) Fund manager treated as a single owner.
60 Morgan Stanley 16th Annual Asia Pacific Summit *November 2017*Fairly Resilient Retail Rentals
Suburban Retail Rentals Are Especially Resilient to Economic Downturns
Singapore Retail Rentals and Quarterly GDP Growth
8.0% $40.00
6.0% $35.00
4.0% $30.00
2.0% $25.00
0.0% $20.00
Q1 2004
Q2 2004
Q3 2004
Q4 2004
Q1 2005
Q2 2005
Q3 2005
Q4 2005
Q2 2006
Q3 2006
Q4 2006
Q1 2007
Q2 2007
Q4 2007
Q1 2008
Q2 2008
Q3 2008
Q4 2008
Q1 2009
Q2 2009
Q3 2009
Q4 2009
Q1 2010
Q3 2010
Q4 2010
Q1 2011
Q2 2011
Q3 2011
Q1 2012
Q2 2012
Q3 2012
Q4 2012
Q1 2013
Q3 2013
Q4 2013
Q1 2014
Q2 2014
Q3 2014
Q4 2014
Q1 2015
Q2 2015
Q3 2015
Q4 2015
Q2 2016
Q3 2016
Q4 2016
Q1 2017
Q2 2017
Q1 2006
Q3 2007
Q2 2010
Q4 2011
Q2 2013
Q1 2016
-2.0% $15.00
-4.0% $10.00
-6.0% $5.00
-8.0% $0.00
GDP Q/Q growth Orchard Suburban
Sources: CBRE and Singapore Department of Statistics
61 Morgan Stanley 16th Annual Asia Pacific Summit *November 2017*Population Growth Drives Local Consumption
Singapore’s Population Estimated to Reach ~ 6.5 - 6.9 Million by 2030(1)
Singapore Population
'000 YoY change
6,000 6%
5%
5,000
4%
4,000
3%
3,000 2%
1%
2,000
0%
1,000
-1%
0 -2%
1983
1984
1985
1986
1987
1988
1989
1990
1991
1992
1993
1994
1995
1996
1997
1998
1999
2000
2001
2002
2003
2004
2005
2006
2007
2008
2009
2010
2011
2012
2013
2014
2015
2016
Singapore Residents Non-Residents % Growth Rate of Total Population
Source: Singapore Department of Statistics
(1) Singapore Population White Paper, January 2013
62 Morgan Stanley 16th Annual Asia Pacific Summit *November 2017*63
0.0%
1.0%
2.0%
3.0%
4.0%
5.0%
6.0%
Jun-89
Dec-89
Jun-90
Dec-90
Jun-91
Dec-91
Source: Bloomberg
Jun-92
Dec-92
Jun-93
Dec-93
Jun-94
Dec-94
Jun-95
Dec-95
Jun-96
Dec-96
Jun-97
Dec-97
Jun-98
Dec-98
Jun-99
Dec-99
Average (2001 – 3Q 2017): 2.5%
Jun-00
Dec-00
Jun-01
Dec-01
Jun-02
Dec-02
Jun-03
Dec-03
Jun-04
Dec-04
Low Unemployment Rate
Jun-05
Dec-05
Jun-06
Dec-06
Jun-07
Dec-07
Jun-08
Dec-08
Singapore’s Overall Unemployment Rate
Jun-09
Dec-09
Jun-10
Dec-10
Morgan Stanley 16th Annual Asia Pacific Summit *November 2017*
Jun-11
Dec-11
Jun-12
Dec-12
Jun-13
Dec-13
Jun-14
Dec-14
Jun-15
Dec-15
Jun-16
Singapore Has One of the Lowest Unemployment Rates Internationally
Dec-16
Jun-17Singapore Households Have Strong Balance Sheets
Singaporeans Have One of the Highest Percentages of
Home Ownership in the World
Household Assets & Liabilities
S$’bill
2,000
1,800
1,600
1,400
1,200
1,000
800
600
400
200
0
2007 2008 2009 2010 2011 2012 2013 2014 2015 2016
Shares & Securities Insurance Funds CPF Balances
Cash & Deposits Property Total Liabilities
Source: Household Sector Balance Sheet by Department of Statistics, Ministry of Trade & Industry, Republic of Singapore
64 Morgan Stanley 16th Annual Asia Pacific Summit *November 2017*Singapore Tourism Industry to get
S$700 million boost over next five years
Singapore Tourist Arrivals Upcoming
Developments
million
18 15.6 15.1 15.2
16.4
14.5
16
14 Ethnobotany Garden (2018*)
12
10
8
Global
6 Financial
SARS Project Jewel (2019*)
Crisis
4
2
-
2010
2014
2002
2003
2004
2005
2006
2007
2008
2009
2011
2012
2013
2015
2016
Mandai Makeover (2021*)
Source: Singapore Tourism Board (STB).
* Subject to change.
65 Morgan Stanley 16th Annual Asia Pacific Summit *November 2017*Shopping and Population Density Comparison
Lower shopping density in Singapore compared to United States and Hong Kong
Higher population density in Singapore compared to United States and Hong Kong
Shopping Density(1) Population Density(2)
2,500 2,183 10,000
7,804
2,000 8,000 6,683
1,500 938 6,000
1,000 539 4,000
500 2,000
33
-
GLA sqm / 1,000 habitants Population / km 2
United States Singapore Hong Kong United States Singapore Hong Kong
(1) Source: Cistri.Shopping density data: United States (2015), Singapore (2016), Hong Kong (2015). It is based on shopping centre floor space
(2) Source: Wikipedia
66 Morgan Stanley 16th Annual Asia Pacific Summit *November 2017*More Experiential Shopping in our Malls
More Experiential and less Department Stores in our Malls compared to United States
Department Store(1) Dining & Entertainment(1)
50 46%
40 35 29%
30
30 25
20
20
9% 15 8%
10 10
5
0 0
United States CMT Portfolio United States CMT Portfolio
(1) Source: Cistri and CMT Portfolio (as at 31December 2014). It is expressed as a percentage of GLA/NLA.
Tampines Mall Westgate
67 Morgan Stanley 16th Annual Asia Pacific Summit *November 2017*Strategies for an Evolving Retail Landscape
A more millennial friendly and
experiential tenant mix
Enhancing the shopping experience
Reinvesting in malls to keep them
relevant
* Bird’s eye view of Funan along North Bridge Road
68 Morgan Stanley 16th Annual Asia Pacific Summit *November 2017*Jurong Lake District
Jurong Lake District is strategically located It also offers convenient connections to the
near: city and Malaysia. The High Speed Rail line to
• High-value industries Kuala Lumpur, will open new markets and
• The future Tuas Port opportunities in a metropolitan region of
• Two world-class research universities more than 10 million people.
Source: Urban Redevelopment Authority.
69 Morgan Stanley 16th Annual Asia Pacific Summit *November 2017*Jurong Lake District Source: Urban Redevelopment Authority. 70 Morgan Stanley 16th Annual Asia Pacific Summit *November 2017*
YTD Sep 2017 Gross Revenue
                   decreased by 2.0% versus YTD Sep 2016
       On Comparable Mall Basis(1), YTD Sep 2017 Gross Revenue Up 0.2% Y-o-Y

               CMT Portfolio                                                                                    510.1
                                                                                                                 520.4
                                          59.5                                                                                2.0%
              Tampines Mall               59.8
                                       43.9
                  Junction 8           44.3
                                          62.4
               IMM Building               60.3
                                           66.4
           Plaza Singapura                 67.7
                                          63.5
             Bugis Junction               63.1
                                                                                       Mainly due to closure of Funan for
     Lot One Shoppers' Mall           33.1
                                     33.2                                              redevelopment
                                    21.6
        Bukit Panjang Plaza         21.5
                                      37.0
       The Atrium@Orchard             37.3
                                     28.7
               Clarke Quay           26.8
                                    24.6
                      Bugis+        24.5
                                       40.2
                 Bedok Mall            43.6                                                  YTD Sep 2017      YTD Sep 2016
                              (2)     29.2
                Other Assets           38.3                                                                                     S$ million

       (1) Excludes Rivervale Mall which was sold in December 2015 and Funan which was closed in July 2016 for redevelopment.
       (2) Includes Sembawang Shopping Centre, JCube, Rivervale Mall which was sold in December 2015 and Funan which was
           closed in July 2016 for redevelopment.

71                                            Morgan Stanley 16th Annual Asia Pacific Summit *November 2017*
YTD Sep 2017 Operating Expenses
decreased by 3.7% versus YTD Sep 2016
On Comparable Mall Basis(1), YTD Sep 2017 OPEX Down 1.4% Y-o-Y
CMT Portfolio 151.1
156.9 2.0%
Tampines Mall 15.7
15.1 3.7%
12.3
Junction 8 12.6
IMM Building 18.8
19.8
17.1
Plaza Singapura 17.0
Bugis Junction 17.7
17.1
9.6 Mainly due to closure of Funan for
Lot One Shoppers' Mall 9.9 redevelopment and lower utilities expenses
7.5
Bukit Panjang Plaza 7.4
The Atrium@Orchard 8.5
8.8
Clarke Quay 11.0
10.5
Bugis+ 7.0
7.9
Bedok Mall 10.7
11.3 YTD Sep 2017 YTD Sep 2016
Other Assets
(2) 15.2
19.5 S$ million
(1) Excludes Rivervale Mall which was sold in December 2015 and Funan which was closed in July 2016 for redevelopment.
(2) Includes Sembawang Shopping Centre, JCube, Rivervale Mall which was sold in December 2015 and Funan which was
closed in July 2016 for redevelopment.
72 Morgan Stanley 16th Annual Asia Pacific Summit *November 2017*YTD Sep 2017 Net Property Income
decreased by 1.2% versus YTD Sep 2016
On Comparable Mall Basis(1), YTD Sep 2017 NPI Up 0.9% Y-o-Y
CMT Portfolio 359.0
363.5
43.8 1.2%
Tampines Mall 44.7
Junction 8 31.6
31.7
IMM Building 43.6
40.5
49.3
Plaza Singapura 50.7
Bugis Junction 45.8
46.0
23.5 Mainly due to closure of Funan for
Lot One Shoppers' Mall 23.3
14.1 redevelopment
Bukit Panjang Plaza 14.1
The Atrium@Orchard 28.5
28.5
Clarke Quay 17.7
16.3
Bugis+ 17.6
16.6
Bedok Mall 29.5
32.3 YTD Sep 2017 YTD Sep 2016
Other Assets
(2) 14.0
18.8
S$ million
(1) Excludes Rivervale Mall which was sold in December 2015 and Funan which was closed in July 2016 for redevelopment.
(2) Includes Sembawang Shopping Centre, JCube, Rivervale Mall which was sold in December 2015 and Funan which was
closed in July 2016 for redevelopment.
73 Morgan Stanley 16th Annual Asia Pacific Summit *November 2017*(1)
YTD Sep 2017 Performance of Joint Ventures
YTD Sep 2017 Net Property Income Down 3.3% Y-o-Y
Gross Revenue (S$ million)
84.6
Total Total
88.6
4.5%
Raffles City Singapore 68.8
70.5
Westgate 15.8
18.1
Operating Expenses (S$ million)
20.9
Total Total
22.7 8.0%
16.2
Raffles City Singapore
17.5
4.7
Westgate
5.2
Net Property Income (S$ million)
63.7 Total
Total 3.3%
65.9
Raffles City Singapore 52.6
53.0
Westgate 11.1
12.9
YTD Sep 2017 YTD Sep 2016
(Charts are of different scales)
(1) This relates to CMT’s 40.0% interest in Raffles City Singapore and 30.0% interest in Westgate.
74 Morgan Stanley 16th Annual Asia Pacific Summit *November 2017*You can also read