CAPITALAND MALL TRUST - Singapore's First & Largest Retail REIT Presentation for Investor Meetings in Hong Kong - Singapore's First & ...
←
→
Page content transcription
If your browser does not render page correctly, please read the page content below
CAPITALAND MALL TRUST
    Singapore’s First & Largest Retail REIT

Presentation for Investor Meetings in Hong Kong
                           15 – 17 May 2019
              CapitaLand Mall Trust Presentation *May 2019*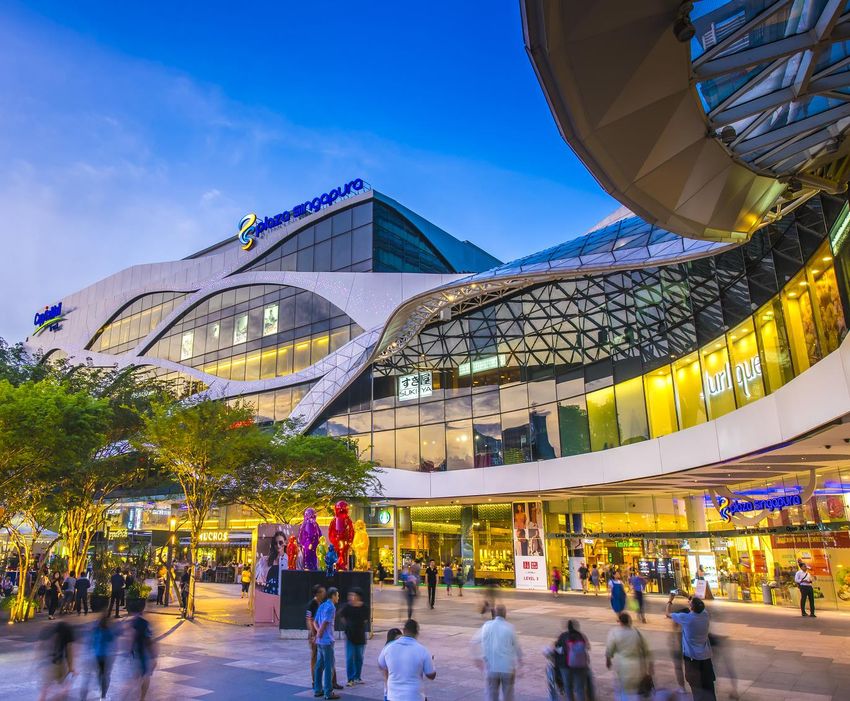
Disclaimer
    This presentation may contain forward-looking statements that involve assumptions, risks and uncertainties. Actual future
    performance, outcomes and results may differ materially from those expressed in forward-looking statements as a result
    of a number of risks, uncertainties and assumptions. Representative examples of these factors include (without
    limitation) general industry and economic conditions, interest rate trends, cost of capital and capital availability,
    competition from other developments or companies, shifts in expected levels of occupancy rate, property rental
    income, charge out collections, changes in operating expenses (including employee wages, benefits and training
    costs), governmental and public policy changes and the continued availability of financing in the amounts and the
    terms necessary to support future business. You are cautioned not to place undue reliance on these forward-looking
    statements, which are based on the current view of management on future events.

    The information contained in this presentation has not been independently verified. No representation or warranty
    expressed or implied is made as to, and no reliance should be placed on, the fairness, accuracy, completeness or
    correctness of the information or opinions contained in this presentation. Neither CapitaLand Mall Trust Management
    Limited (the ‘Manager’) or any of its affiliates, advisers or representatives shall have any liability whatsoever (in
    negligence or otherwise) for any loss howsoever arising, whether directly or indirectly, from any use, reliance or
    distribution of this presentation or its contents or otherwise arising in connection with this presentation.

    The past performance of CapitaLand Mall Trust (‘CMT’) is not indicative of the future performance of CMT. Similarly, the
    past performance of the Manager is not indicative of the future performance of the Manager.

    The value of units in CMT (‘Units’) and the income derived from them may fall as well as rise. Units are not obligations of,
    deposits in, or guaranteed by, the Manager or any of its affiliates. An investment in Units is subject to investment risks,
    including the possible loss of the principal amount invested.

    Investors should note that they will have no right to request the Manager to redeem or purchase their Units for so long as
    the Units are listed on the Singapore Exchange Securities Trading Limited (the ‘SGX-ST’). It is intended that unitholders of
    CMT may only deal in their Units through trading on the SGX-ST. Listing of the Units on the SGX-ST does not guarantee a
    liquid market for the Units.

    This presentation is for information only and does not constitute an invitation or offer to acquire, purchase or subscribe
    for Units.

2
                                            CapitaLand Mall Trust Presentation *May 2019*
Contents

    ▪ 1Q 2019 Overview

    ▪ 1Q 2019 Financial Highlights

    ▪ Portfolio Updates

    ▪ Redefining Retail Experience

    ▪ Singapore Retail Landscape

    ▪ Going Forward

3
                   CapitaLand Mall Trust Presentation *May 2019*
1Q 2019 Overview
        Operational Performance

            1.2%              2.0%                              98.8%                        0.4%
                               Y-o-Y                            as at end-Mar                  Y-o-Y
                                                                     2019

            Rental            Shopper                     Portfolio Occupancy              Tenants’ Sales
           Reversion           Traffic                             Rate                   Per Square Foot

        Asset Update                                            Proactive Capital Management
    •    Funan                                              •    Issued 7-year S$100.0 million fixed rate
         ✓ About 90% leased                                      notes at interest rate of 3.15%
         ✓ Opening mid-2019
                                                            •    Issued 10-year US$300.0 million fixed
                                                                 rate notes swapped to S$407.1 million at
                                                                 interest rate of 3.223%

4
                               CapitaLand Mall Trust Presentation *May 2019*
1Q 2019 Financial Highlights

 CapitaLand Mall Trust Presentation *May 2019*   Westgate
1Q 2019 Distributable Income Up 7.4% Y-o-Y
     Distributable Income                                Distribution Per Unit (DPU)
                                                                                                                                   (1)

                                   (1)

        S$106.3                                                 2.88
                                                                                                                                                              (2)

        million                                                 cents
               7.4% Y-o-Y                                             3.6% Y-o-Y

      Annualised DPU                                        Annualised Distribution
                                                                    Yield

        11.68                                                 5.03
        cents                                                 %
                                                              (Based on closing unit price of
               3.6% Y-o-Y                                     S$2.320 on 23 April 2019)

    (1) In 1Q 2019, CMT had retained S$9.2 million of its taxable income available for distribution to Unitholders for distribution in FY 2019. Capital distribution
        and tax-exempt income distribution of S$5.9 million received from CapitaLand Retail China Trust (‘CRCT’) in 1Q 2019 had also been retained for
        general corporate and working capital purposes.
    (2) In 1Q 2018, CMT had retained S$9.1 million of its taxable income available for distribution to Unitholders for distribution in FY 2018. Capital distribution
        and tax-exempt income distribution of S$1.0 million received from CRCT in 1Q 2018 had also been retained for general corporate and working
        capital purposes.

6
                                                          CapitaLand Mall Trust Presentation *May 2019*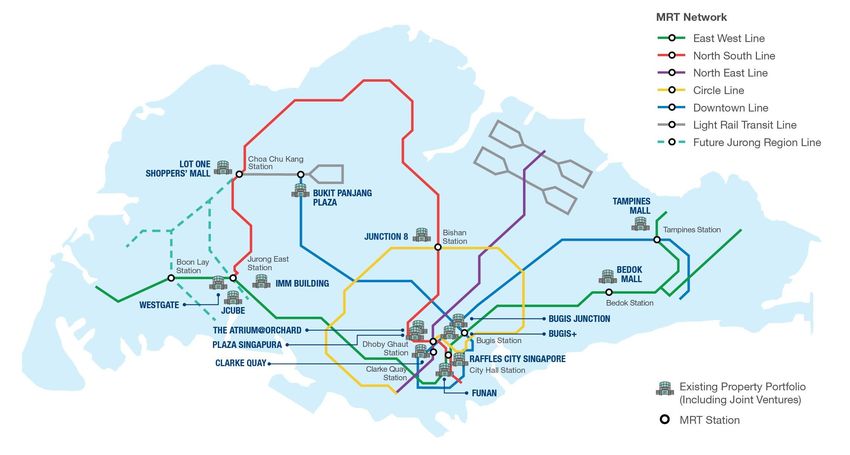
1Q 2019 Financial Performance
       Gross Revenue                               Net Property Income                            Distributable Income

          S$192.7                                       S$140.1                                         S$106.3                   (1)

          million                                       million                                         million
                10.0% Y-o-Y                                   11.5% Y-o-Y                                     7.4% Y-o-Y

    S$ million

                                                                                                               (1)
                                                                                                                            (2)

    (1) In 1Q 2019, CMT had retained S$9.2 million of its taxable income available for distribution to Unitholders for distribution in FY 2019.
        Capital distribution and tax-exempt income distribution of S$5.9 million received from CRCT in 1Q 2019 had also been retained for
        general corporate and working capital purposes.
    (2) In 1Q 2018, CMT had retained S$9.1 million of its taxable income available for distribution to Unitholders for distribution in FY 2018.
        Capital distribution and tax-exempt income distribution of S$1.0 million received from CRCT in 1Q 2018 had also been retained for
        general corporate and working capital purposes.

7
                                                CapitaLand Mall Trust Presentation *May 2019*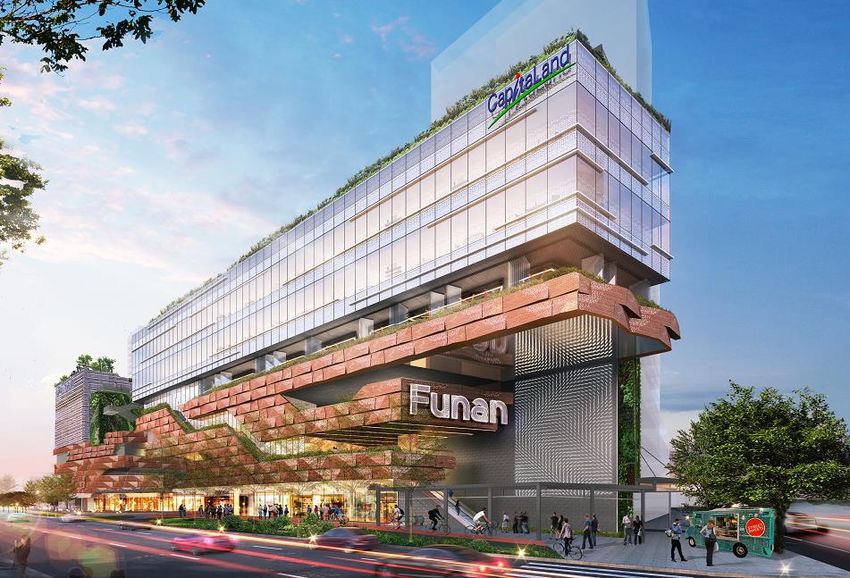
Proforma Debt Maturity Profile(1) as at 31 March 2019
                   (adjusted for repayment using proceeds from 10-year US$300.0 million notes issued on 4 April 2019)

                 700
                                                                                                 570.0
                                                                                      590.0
                 600        360.1                                                                20.0
                                                                                                 40.0
                                                                                           (4)          (4)

                                                        484.0                         120.0
                 500
                                                                                                         (4)
                                                                                                 60.0          467.1
                                 (2)
                                          327.1
                           202.5                         72.0
                                                              (4)
                                                                                                                   (4)

                 400                                                  201.1           130.0                    110.0
    S$ million

                                          123.2
                                                                            (4)
                                                                       11.0
                                                                                                                   (10)     299.0         292.8
                 300                       48.0
                                                 (4)
                                                                                                 300.0         98.8
                                 (2)                                                  100.0
                           202.5          53.1                                                                              100.0
                                                       350.0           81.4                                                                100.0                              (14)
                                                                                           (8)
                 200                                                                  100.0                    150.0
                                                                                                                                                                        407.1
                                          100.0                                                                                  (12)
                                                                                                                             99.0
                                                                            (7)                                                                 (13)
                 100              (3)
                                                 (5)                  190.1                (9)                                            192.8
                            157.6                                                     140.0      150.0             (11)
                                                                                                                                                                                                150.0
                                          126.0               (6)                                              108.3        100.0
                                                         62.0
                   0
                           2019          2020          2021          2022             2023       2024          2025        2026           2027           2028           2029         2030       2031
                       Unsecured Bank Loans - 40.0% interest in RCS Trust                                           Notes issued under RCS Trust EMTN Programme (Unsecured) - 40.0% interest in RCS Trust
                       Unsecured Bank Loans                                                                         Retail Bonds due 2021 at fixed rate of 3.08% p.a. (Unsecured)
                       Notes issued under Multicurrency Medium Term Note ('MTN') Programme (Unsecured)              Notes issued under Euro-Medium Term Note ('EMTN') Programme (Unsecured)

                  (1)    Includes CMT’s share of borrowings in RCS Trust (40.0%).
                  (2)    S$405.0 million secured bank loans by Infinity Mall Trust due in October 2019.
                  (3)    ¥10.0 billion 1.309% fixed rate notes ('EMTN Series 4') were swapped to approximately S$157.6 million at a fixed rate of 2.79% p.a. in October 2012.
                  (4)    S$1.15 billion unsecured bank loans and notes by RCS Trust. CMT’s 40.0% share thereof is S$461.0 million.
                  (5)    ¥10.0 billion 1.039% fixed rate notes ('MTN Series 10') were swapped to S$126.0 million at a fixed rate of 3.119% p.a. in November 2013.
                  (6)    ¥5.0 billion floating rate (at 3 months JPY LIBOR + 0.48% p.a.) notes ('MTN Series 12') were swapped to S$62.0 million at a fixed rate of 3.148% p.a. in February 2014.
                  (7)    HK$1.15 billion 3.76% fixed rate notes ('EMTN Series 3') were swapped to S$190.1 million at a fixed rate of 3.45% p.a. in June 2012.
                  (8)    ¥8.6 billion floating rate (at 3 months JPY LIBOR + 0.25% p.a.) notes ('MTN Series 16') were swapped to S$100.0 million at a fixed rate of 2.85% p.a. in February 2015.
                  (9)    HK$885.0 million 3.28% fixed rate notes ('EMTN Series 5') were swapped to S$140.0 million at a fixed rate of 3.32% p.a. in November 2012.
                  (10)   HK$555.0 million 3.836% fixed rate notes (‘MTN Series 24’) were swapped to S$98.8 million at a fixed rate of 3.248% p.a. in November 2018.
                  (11)   HK$650.0 million 3.25% fixed rate notes ('MTN Series 14') were swapped to S$108.3 million at a fixed rate of 3.25% p.a. in November 2014.
                  (12)   HK$560.0 million 2.71% fixed rate notes (‘MTN Series 18’) were swapped to S$99.0 million at a fixed rate of 2.928% p.a. in July 2016.
                  (13)   HK$1.104 billion 2.77% fixed rate notes ('MTN Series 15') were swapped to S$192.8 million at a fixed rate of 3.25% p.a. in February 2015.
                  (14)   US$300.0 million 3.609% fixed rate notes ('MTN Series 26') were swapped to S$407.1 million at a fixed rate of 3.223% p.a. in April 2019.
8
                                                                                  CapitaLand Mall Trust Presentation *May 2019*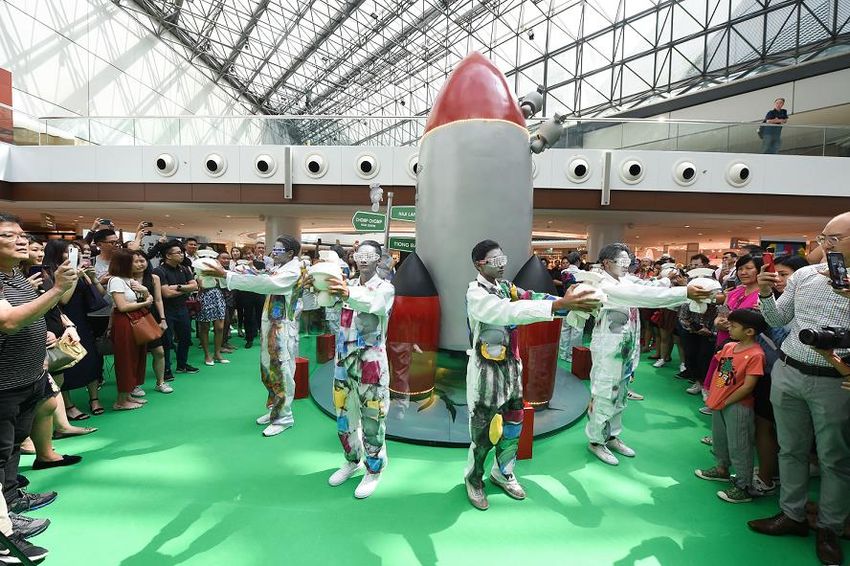
Key Financial Indicators
                                                                                As at                          As at
                                                                           31 March 2019(1)              31 December 2018

     Unencumbered Assets as % of Total Assets                                       89.8%                          89.8%

     Aggregate Leverage(2)                                                          34.4%                          34.2%

     Net Debt / EBITDA(3)                                                             6.5x                           6.8x

     Interest Coverage(4)                                                             4.9x                           5.2x

     Average Term to Maturity (years)                                                 4.2                            4.4

     Average Cost of Debt(5)                                                          3.2%                           3.1%
     CMT’s Issuer Rating(6)                                                                                         ‘A2’

    (1) Except for Aggregate Leverage, all key financial indicators exclude the effect of FRS 116 Leases which was effective from
        1 January 2019.
    (2) In accordance with Property Funds Appendix, CMT’s proportionate share of its joint ventures’ borrowings and deposited property
        values are included when computing aggregate leverage. Correspondingly, the ratio of total gross borrowings to total net assets
        is 55.2%.
    (3) Net Debt comprises Gross Debt less temporary cash intended for refinancing and capital expenditure and EBITDA refers to net
        income of CMT Group before fair value changes, non-operational gain and/or loss, finance cost (net of interest income), tax,
        depreciation and amortisation.
    (4) Ratio of net income of CMT Group before fair value changes, non-operational gain and/or loss, finance cost (net of interest
        income) and tax over interest expense from 1 January 2019 to 31 March 2019.
    (5) Ratio of interest expense over weighted average borrowings.
    (6) Moody’s Investors Service has affirmed the ‘A2’ issuer rating of CMT on 28 August 2018.

9
                                             CapitaLand Mall Trust Presentation *May 2019*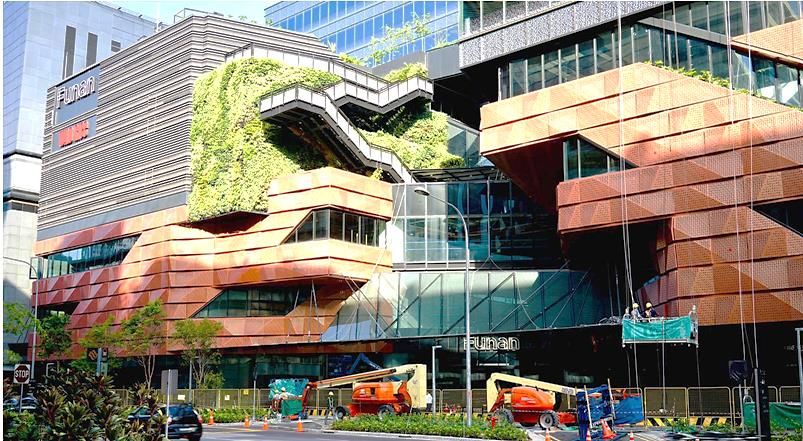
Valuations and Valuation Cap Rates
                                                    Valuation            Valuation             Variance              Valuation       Valuation Cap Rate Valuation Cap Rate
                                                 as at 31 Dec 18       as at 30 Jun 18                            as at 31 Dec 18      as at 31 Dec 18       as at 30 Jun 18
                                                    S$ million            S$ million           S$ million         S$ per sq ft NLA            %                     %
     Tampines Mall                                   1,059.0               1,051.0                 8.0                 2,973                 4.70                  4.70
     Junction 8                                         743.0                740.0                 3.0                 2,930                 4.70                  4.70
                                                                                                                               (1)       Retail: 6.15          Retail: 6.15
     IMM Building                                      649.0                 644.0                 5.0                   674
                                                                                                                                       Warehouse: 7.00      Warehouse: 7.00
     Plaza Singapura                                 1,296.0               1,293.0                 3.0                 2,687                 4.40                  4.40
     Bugis Junction                                  1,089.0               1,086.0                 3.0                 2,746                 4.70                  4.70
     JCube                                             288.0                 288.0                  -                  1,392                 4.85                  4.85
     Lot One Shoppers’ Mall                            536.0                 535.0                 1.0                 2,438                 4.70                  4.70
     Bukit Panjang Plaza                               327.0                 325.0                 2.0                 1,999                 4.80                  4.80
                                                                                                                               (1)       Retail: 4.65          Retail: 4.65
     The Atrium@Orchard                                757.0                 757.0                     -               1,960
                                                                                                                                         Office: 3.75          Office: 3.75
     Clarke Quay                                       401.0                 396.0                 5.0                 1,367                 4.85                  4.85
     Bugis+                                            354.0                 351.0                 3.0                 1,649                 5.20                  5.20
     Bedok Mall                                        784.0                 782.0                 2.0                 3,524                 4.60                  4.60
     Westgate (2)                                    1,128.0                  N.A.                 N.M.                2,747                 4.50                 N.M.
     Total CMT Portfolio excluding Funan and
                                                     9,411.0               8,248.0                35.0
     Raffles City Singapore
             (3)                                                                                                                         Retail: 4.85          Retail: 4.85
     Funan                                             360.0                 360.0                 -                   N.M.
                                                                                                                                         Office: 4.00          Office: 4.00

     Total CMT Portfolio including Investment
     Properties Under Development and                9,771.0               8,608.0                35.0
     excluding Raffles City Singapore

     Less additions / adjustments during the
                                                                                                  (11.3)
     period
     Net increase in valuations                                                                   23.7
     Share of Joint Venture’s investment property
                                                                                                                           (4)
                                                                                                                                         Retail: 4.70          Retail: 4.70
     Raffles City Singapore (40.0% interest)         1,328.8               1,319.2                 9.6                 N.M.              Office: 4.00          Office: 4.00
                                                                                                                                         Hotel: 4.75           Hotel: 4.75
     Less additions during the period                                                              (6.5)
     Net increase in valuation                                                                     3.1
       (1) Reflects valuation of the property in its entirety.
       (2) Westgate is held through Infinity Mall Trust, which is wholly-owned by CMT with effect from 1 November 2018.
       (3) As at 31 December 2018, Funan is held through CMT, Victory Office 1 Trust and Victory Office 2 Trust (each of Victory Office 1 Trust and Victory Office 2 Trust
           are wholly-owned by CMT). As the property is undergoing redevelopment into an integrated development, the value reflected in this table is the total land
           value of the retail and office components of the integrated development.
       (4) Not meaningful because Raffles City Singapore comprises retail units, office units, hotels and convention centre.

      N.A. : Not applicable
      N.M. : Not meaningful
10
                                                           CapitaLand Mall Trust Presentation *May 2019*
Healthy Balance Sheet
As at 31 March 2019
S$’000
Non-current Assets 11,185,071 Net Asset Value/Unit
S$2.04
(as at 31 March 2019)
Current Assets 428,425
Adjusted Net Asset Value/Unit
Total Assets 11,613,496 S$2.01
(excluding distributable income)
Current Liabilities 812,654
Non-current Liabilities 3,283,031
Total Liabilities 4,095,685
Net Assets 7,517,811
Unitholders’ Funds 7,517,811
Units in Issue (’000 units) 3,688,308
11
CapitaLand Mall Trust Presentation *May 2019*Portfolio Updates
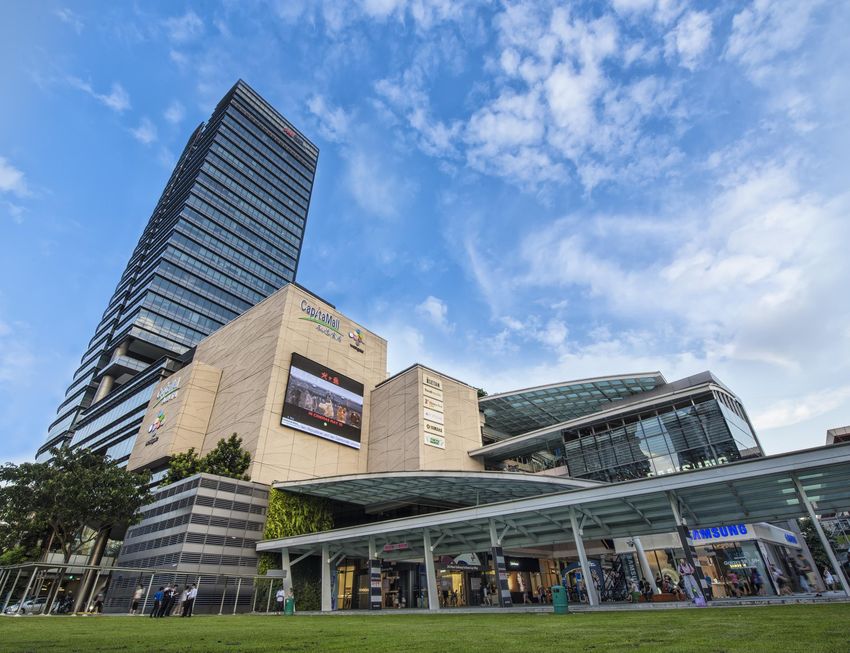
CapitaLand Mall Trust Presentation *May 2019* Plaza SingapuraShopper Traffic and Tenants’ Sales Psf/Month
100 2.0% Y-o-Y
Shopper Traffic(1)
(million)
50
0
1Q 2019 1Q 2018
100
0.4% Y-o-Y
Tenants’ Sales(1)
($ psf/month)
75
50
1Q 2019 1Q 2018
(1) For comparable basis, CMT portfolio excludes Funan which was closed in July 2016 for redevelopment and
Sembawang Shopping Centre which was divested in June 2018.
13
CapitaLand Mall Trust Presentation *May 2019*Tenants’ Sales by Trade Categories in 1Q 2019
Cautious consumer sentiment
40 36.5
30
Y-o-Y Variance of Tenants’ Sales $ psf/mth (%)
20
10.7
10 5.0 3.7 3.0 0.7
0
(0.2) (1.8) (2.0) (2.3)
-10 (4.4) (4.9) (6.7)
(9.0)
-20 (12.5)
(18.5)
-30
-40 (30.5)
(1)
(2)
Electrical & Electronics
Food & Beverage
Services
Fashion
Music & Video
Toys & Hobbies
Home Furnishing
Supermarket
Jewellery & Watches
Beauty & Health
Books & Stationery
Sporting Goods
Gifts & Souvenirs
Department Store
Shoes & Bags
Leisure & Entertainment
IT & Telecommunications
(1) Includes hypermarket sales.
(2) Includes convenience stores, bridal shops, optical shops, film processing shops, florists, magazine stores, pet
shops, travel agencies, cobblers/locksmiths, laundromats and clinics.
14
CapitaLand Mall Trust Presentation *May 2019*Rental Reversions
From 1 January to 31 March 2019 (Excluding Newly Created and Reconfigured Units)
Net Lettable Area
Increase/(decrease)
in Current Rental
Number of Retention Rates vs Preceding
Percentage
Property Renewals / Rate Area Rental Rates
of Property
New Leases (%) (sq ft) (typically committed
(%)
three years ago)
(%)
Tampines Mall 12 91.7 42,231 11.9 1.7
Junction 8 22 77.3 32,509 12.8 1.9
IMM Building(1) 11 100.0 20,319 4.8 4.2
Plaza Singapura 23 82.6 46,299 9.6 0.5
Bugis Junction 16 93.8 13,160 3.3 1.6
Raffles City Singapore(1) 12 91.7 16,340 3.8 (3.1)
Lot One Shoppers’ Mall 12 100.0 26,393 12.0 0.2
The Atrium@Orchard(1) 11 100.0 24,865 18.5 0.9
Clarke Quay 8 100.0 29,902 10.2 3.0
Bugis+ 10 80.0 12,960 6.0 0.1
Bedok Mall 14 85.7 18,056 8.1 1.5
Westgate 16 87.5 37,017 9.0 1.7
Other assets(2) 23 87.0 16,261 4.4 1.5
CMT Portfolio(3) 190 88.9 336,312 8.0 1.2
(1) Based on retail leases only.
(2) Includes JCube and Bukit Panjang Plaza.
(3) Excludes Funan which was closed in July 2016 for redevelopment and Sembawang Shopping
Centre which was divested in June 2018.
15
CapitaLand Mall Trust Presentation *May 2019*(1)
Portfolio Lease Expiry Profile
as at 31 March 2019
Weighted Average Expiry by Gross Rental Income 1.9 Years
Gross Rental Income per Month(2)
Number of Leases S$’000 % of Total
2019 614(3) 11,617 19.1
2020 868 16,827 27.7
2021 841 17,863 29.4
2022 402 11,487 18.9
2023 30 1,521 2.5
2024 and beyond 22 1,430 2.4
Total 2,777 60,745 100.0
(1) Based on committed leases. Includes CMT’s 40.0% interest in Raffles City Singapore (excluding hotel
lease) and excludes Funan which was closed in July 2016 for redevelopment.
(2) Based on the month in which the lease expires and excludes gross turnover rent.
(3) Of which 510 leases are retail leases.
16
CapitaLand Mall Trust Presentation *May 2019*Portfolio Lease Expiry Profile for 2019 (1)
Net Lettable Area Gross Rental Income
Number of
As at 31 March 2019 Leases % of Property NLA(2) % of Property Income(3)
Tampines Mall 24 9.8 12.2
Junction 8 34 23.4 22.4
IMM Building(4) 143 28.5 27.3
Plaza Singapura 48 17.3 16.8
Bugis Junction 77 49.4 37.7
Raffles City Singapore(4) 96 28.6 27.5
Lot One Shoppers’ Mall 28 9.4 13.9
The Atrium@Orchard(4) 13 5.6 9.1
Clarke Quay 12 13.0 14.8
Bugis+ 8 6.3 7.7
Bedok Mall 19 6.5 8.1
Westgate 27 22.3 15.0
Other assets(5) 85 13.7 19.9
CMT Portfolio 614(6) 21.0 19.1
(1) Based on committed leases. Includes CMT’s 40.0% interest in Raffles City Singapore (excluding hotel lease) and
excludes Funan which was closed in July 2016 for redevelopment.
(2) As a percentage of net lettable area for each respective property as at 31 March 2019.
(3) As a percentage of gross rental income for each respective property and excludes gross turnover rent.
(4) Includes non-retail leases for IMM Building, Raffles City Singapore and The Atrium@Orchard.
(5) Includes JCube and Bukit Panjang Plaza.
(6) Of which 510 leases are retail leases.
17
CapitaLand Mall Trust Presentation *May 2019*High Occupancy Maintained
31 Dec 31 Dec 31 Dec 31 Dec 31 Dec 31 Dec 31 Dec 31 Dec 31 Dec 31 Mar
(%, As at)
2010 2011 2012 2013 2014 2015 2016 2017 2018 2019
Tampines Mall 100.0 100.0 100.0 100.0 99.5 100.0 99.2 100.0 100.0 100.0
Junction 8 100.0 100.0 99.6 99.4 100.0 100.0 99.9 100.0 100.0 100.0
(1) (1) (1) (1)
Funan 100.0 100.0 100.0 98.2 97.9 95.3 N.A. N.A. N.A. N.A.
(3)
IMM Building(2) 100.0 100.0 98.1 99.0 96.0 96.0 97.9 99.5 99.7 97.9
Plaza Singapura 100.0 100.0 91.3 100.0 100.0 99.7 100.0 100.0 99.9 99.5
Bugis Junction 100.0 100.0 100.0 100.0 100.0 99.7 99.9 99.3 99.8 98.6
(4) (3)
Other assets 99.8 80.9 99.8 100.0 98.1 92.6 95.3 96.4 94.8 95.1
(2)
Raffles City Singapore 99.6 100.0 100.0 100.0 100.0 99.6 99.7 99.9 99.4 99.5
Lot One Shoppers' Mall 99.6 99.7 99.8 100.0 100.0 99.8 99.9 100.0 99.8 99.4
(5) (3)
The Atrium@Orchard 93.5 65.5 95.3 99.5 99.9 98.2 97.6 98.6 99.1 98.9
Clarke Quay 100.0 100.0 97.9 100.0 95.9 88.2 90.7 98.8 98.3 96.9
Bugis+ 99.5 100.0 100.0 99.2 100.0 100.0 100.0 100.0
Westgate 85.8 97.7 97.6 99.6 98.0 99.4 99.7
Bedok Mall 99.9 100.0 99.2 100.0 99.6
CMT Portfolio 99.3 94.8 98.2 98.5 98.8 97.6 98.5 99.2 99.2 98.8
(1) Not applicable as Funan was closed on 1 July 2016 for redevelopment.
(2) Based on retail leases only.
(3) Lower occupancy rates were mainly due to Asset Enhancement Initiatives (AEI).
(4) Other assets include:
a) Sembawang Shopping Centre, until it was divested in 2018;
b) Rivervale Mall, until it was divested in 2015;
c) Hougang Plaza, until it was divested in 2012;
d) JCube, except from 2008 to 2011 when it underwent an AEI and from 2012 to 2015 when it was classified separately;
e) Bugis+, which was acquired in 2011 and subsequently underwent an AEI from November 2011 to July 2012.
The asset was classified separately from 2012 onwards; and
f) Bukit Panjang Plaza, from 2018 onwards.
(5) Includes retail and office leases.
18
CapitaLand Mall Trust Presentation *May 2019*Average Occupancy Cost (1), (2), (3)
18.4% 18.5%
FY 2018 FY 2017
(1) Occupancy cost is defined as a ratio of gross rental (inclusive of service charge, advertising & promotional charge and gross
turnover rent) to tenants’ sales.
(2) For comparable basis, CMT portfolio excludes Funan which was closed in July 2016 for redevelopment and Sembawang
Shopping Centre which was sold in June 2018.
(3) Includes Hypermarket sales from January 2018. For comparable basis, sales in FY 2017 were rebased accordingly.
19
CapitaLand Mall Trust Presentation *May 2019*Redefining Retail
Experience
CapitaLand Mall Trust Presentation *May 2019* Bedok MallEvolving Retail Landscape
Omnichannel
Retailing
Changing
Experiential
Convenience Consumer Concepts
Preferences
Customised
Experiences
21
CapitaLand Mall Trust Presentation *May 2019*Combining Physical and Digital Experiences
Singapore’s first phygital store NomadX, launched by CapitaLand at Plaza
Singapura, is a 11,000 sq ft experiential, multi-label concept store
► Targeted product
recommendations based
on shopper profile
► Automated store
assistance through intuitive
sensor technology
Gamified Onboarding Process Interactive TV/Projections
► Interactive wayfinding
displays
► Digital displays to improve
brand awareness
► Cashless payment
experience
Product Directory Smart Mirror
22
CapitaLand Mall Trust Presentation *May 2019*Creating a Consumption Ecosystem
Most widely accepted shopping voucher with a
network of over 2,000 stores across our malls.
As at 31 December 2018, membership exceeded 940,000.
CapitaStar App and StarPay CapitaCard eCapitaVoucher
23
CapitaLand Mall Trust Presentation *May 2019*Curating Unique Shopper Activities
The Ultimate eGift Event at Bugis Junction Street Fest at Clarke Quay
Warner Bros “Get Animated” Invasion Tour
Nickelodeon Fiesta at Clarke Quay at Raffles City Singapore
24
CapitaLand Mall Trust Presentation *May 2019*Singapore Retail Landscape
CapitaLand Mall Trust Presentation *May 2019* Bugis JunctionMarket Share by Owner
CMT is the largest shopping mall owner in Singapore owning
14.6% of malls greater than 100,000 sq ft NLA
Share of Major Shopping Mall Floor Space by Owner1,2
Singapore, 2018
Source: Cistri
(1) Malls with NLA of 100,000 sq ft and above as at end 2018. Share of floor space takes into account ownership stakes.
(2) Fund manager treated as a single owner.
(3) Includes ownership stakes in malls owned by CapitaLand
26
CapitaLand Mall Trust Presentation *May 2019*Available Retail Floor Space
Retail Space at end-2018: 65.5 million sq ft,
Three large-scale malls opening in 2019
Retail Floor Space Supply
Singapore, 2008 – 2023 (million sq ft)
Name of Mall Project Type of Centre Owner Retail NLA Opening
(sq ft)
Jewel Changi Airport Major transport CapitaLand, 576,000 17 April 2019
hub Changi Airport Group
Funan Sub-regional CapitaLand Mall Trust 325,000 Mid-2019
Paya Lebar Quarter Sub-regional Lendlease 341,000 2019
Sources: URA, Developers’ Announcements, Cistri
27
CapitaLand Mall Trust Presentation *May 2019*Fairly Resilient Retail Rents
Suburban retail rents are especially resilient to economic downturns
Singapore Retail Rents and Quarterly GDP Growth
10.0% $40.00
8.0% $35.00
$30.00
6.0%
$25.00
4.0%
$20.00
2.0%
$15.00
0.0%
$10.00
-2.0% $5.00
-4.0% $0.00
GDP Q/Q growth Orchard Suburban
Sources: CBRE and Singapore Department of Statistics
28
CapitaLand Mall Trust Presentation *May 2019*Shopping Centre Floor Space Per Capita
Lower provision of shopping centre floor space in Singapore
compared to other developed markets
Shopping Centre Floor Space Per Capita
Sq ft NLA
25 23.6
20
15
10.1
10
5.9
5 4.4
0
United States (2017) Singapore (2018) Hong Kong (2015) Japan (2016)
Source: International Council of Shopping Centres, Cistri.
29
CapitaLand Mall Trust Presentation *May 2019*Going Forward
CapitaLand Mall Trust Presentation *May 2019* Funan (artist’s impression)Funan – An Exciting Addition
Redeveloping Funan into an integrated development –
Six-storey retail mall, two office towers and one block of serviced residence
Artist’s impression
Facade view from North Bridge Road
Redevelopment of Funan
Gross floor area: ~766,000 sq ft
(excluding serviced residence divested on 31 Oct 2017)
Lease commitment: About 90%
Target opening: Mid-2019 Artist’s impression
31
CapitaLand Mall Trust Presentation *May 2019*Next Lap
Positioned for growth
• Completed the acquisition of the balance 70.0% interest in Westgate
✓ 100% contribution in 2019
• Funan on track to open in mid-2019
✓ About 90% leased
✓ Progressively contribute to earnings from 2H 2019
Staying ahead of competition
• Identify growth opportunities through asset enhancement/acquisition/
redevelopment
• Stay nimble and updated - keep abreast of retail trends to meet evolving
customer needs
• Deepen collaboration - work with business partners and tenants to test new retail
concepts
• Leverage technology - promote seamless retail experience
• Innovate marketing efforts - strengthen customer loyalty and attract new visitors
32
CapitaLand Mall Trust Presentation *May 2019*Supplementary
Information
CapitaLand Mall Trust Presentation *May 2019* Clarke QuaySingapore REIT Landscape
CMT: largest retail S-REIT by market capitalisation(1);
Credit rating: ‘A2’ issuer rating
Total Assets
14,000
(S$ million)
42 REITs and business trusts in Singapore (2)
12,000
CMT AREIT
10,000
CCT Suntec
8,000 MLT
KREIT
Fortune MNACT
MCT
6,000
ART
MINT OUECT
4,000
SPH FLT Starhill
FCT
CDREIT CRCT ESR
FEHT
Ascendas India ASCHT FHT Cromwell Manulife
2,000 FCOT KeppelDC LippoMall OUEHT
Parkway
Sasseur RHT EC World Dasin Retail
AIMS AMPFIRST KeppelKBS
Cache Soilbuild
BHG Retail Sabana IREIT
Aggregate Leverage
0
20% 25% 30% 35% 40% 45%
Source: Bloomberg and companies data
(1) Size of bubble denotes market capitalisation and balance sheet data available as at 2 May 2019.
(2) Based on UBS Singapore Property report as at 2 April 2019.
34
CapitaLand Mall Trust Presentation *May 2019*Market Leadership in Singapore Retail Space
S$8.8b 15 ~2,800 5.4m
Market Properties in Extensive Network sq ft NLA(2)
Capitalisation(1) Singapore of Tenants
Bedok Mall Bugis Junction Bugis+ Bukit Panjang Plaza Clarke Quay
Funan(3) IMM Building JCube Junction 8 Lot One Shoppers’ Mall
Raffles City Singapore
Plaza Singapura (40% stake) Tampines Mall The Atrium@Orchard Westgate
(1) Information as at 31 March 2019.
(2) Based on total NLA, including retail, office and warehouse. This excludes Funan which was closed for redevelopment on 1 July 2016.
(3) Artist’s impression of proposed integrated development.
35
CapitaLand Mall Trust Presentation *May 2019*Strategically Located Portfolio
- Comprises a good mix of downtown and suburban malls
- Close proximity to public transport and population catchments
36
CapitaLand Mall Trust Presentation *May 2019*Growth Strategies
Identify value-adding Unlock potential value of malls to
acquisitions, investments, Active Asset propel growth by enhancing the retail
greenfield development projects Management environment and improving the
and redevelopment opportunities attractiveness of malls to shoppers
to add to the portfolio and further and retailers.
enhance its value.
Proactive
Portfolio CMT Capital
Reconstitution Management
Address all key operational Optimise returns to Unitholders
issues to ensure optimal while maintaining a strong
performance in the day-to- capital base and credit rating to
day running of the malls. Operational support CMT’s growth.
Excellence
37
CapitaLand Mall Trust Presentation *May 2019*CMT Track Record
From 3 to 15 assets(1) since inception
(1) 15 assets, after the divestment of Sembawang Shopping Centre on 18 June 2018.
(2) Acquisition of Class ‘E’ bonds issued by CapitaRetail Singapore Limited (‘CRS’) which owned Lot One Shoppers’ Mall, Bukit Panjang
Plaza (90 out of 91 strata lots) and Rivervale Mall.
(3) Acquired 92.40% stake. Balance 7.6% acquired in June 2006.
(4) 12.50% stake as at 31 March 2019.
(5) The divestment of Sembawang Shopping Centre was completed on 18 June 2018.
(6) The acquisition of the remaining 70.0% interest in Infinity Mall Trust which holds Westgate was completed on 1 November 2018.
38
CapitaLand Mall Trust Presentation *May 2019*2018 Value Creation Journey
1. Portfolio Reconstitution
Divested Sembawang Shopping Centre and redeployed the proceeds into the
acquisition of the balance 70.0% interest in Westgate, a high quality asset with better
fundamentals
Divested Sembawang Shopping Centre Acquired Westgate (Balance 70.0% interest)
Net lettable area: 143,631 sq ft Net lettable area: 410,753 sq ft
Price: S$248.0 million Agreed value: S$1,128.0 million
(above valuation of S$126.0 million as at (partially funded through a private placement
31 December 2017) which was 2.7 times covered)
Completion: 18 June 2018 Completion: 1 November 2018
39
CapitaLand Mall Trust Presentation *May 2019*2018 Value Creation Journey
2a. Portfolio Enhancement – Tampines Mall
Completion of rejuvenation works amounting to S$8.2 million
Before: Single-storey structure After: New state-of-the-art duplex
After: Enhanced facade and new external
Before: Existing facade and flooring flooring
40
CapitaLand Mall Trust Presentation *May 2019*2018 Value Creation Journey
2b. Portfolio Enhancement - Westgate
Improvement in shopper experience: Completion of works to improve shopper accessibility
and visibility of shops in B1
Before: Alfresco F&B outlets without air After: Enclosed selected alfresco F&B New: Entrance point from existing taxi
conditioning outlets with air conditioning stand
Before: Through-block link with no After: New escalators to connect L1 & New: Glass vestibule at L1 to improve
connectivity between L1 & L2 L2 visibility of shops in B1
41
CapitaLand Mall Trust Presentation *May 2019*2018 Value Creation Journey
3. Redevelopment – Funan
• From an IT retail mall into an innovation-focused integrated development
• Gross floor area expanded from 482,097 sq ft to 887,000 sq ft encompassing offices, retail
space and serviced residence(1) which was divested on 31 October 2017
• Introducing experiential retail concepts with the integration of online, offline, data and
logistics offerings
Before: Funan DigitaLife Mall After: Funan (artist's impression)
(1) Gross floor area excluding serviced residence is 766,000 sq ft.
42
CapitaLand Mall Trust Presentation *May 2019*2018 Value Creation Journey
FY 2018: Total asset value and net asset value per unit
increased 9.5% and 4.2% YoY respectively
(1) Includes gross revenue of Sembawang Shopping Centre (SSC).
(2) The divestment of SSC was completed on 18 June 2018. With effect from 1 November 2018, Infinity Mall Trust which holds
Westgate became a wholly owned subsidiary of CMT and its financials are consolidated at CMT Group.
(3) Includes SSC, CMT’s 40.0% interest in Raffles City Singapore and 30.0% interest in Westgate.
(4) Includes CMT’s 40.0% interest in Raffles City Singapore and 100% interest in Westgate.
43
CapitaLand Mall Trust Presentation *May 2019*Attractive Yield versus Other Investments
As at 31 March 2019
6 Net Yield for:
Individual: 4.9% (0% tax)
Corporate Overseas: 4.4% (10% tax)
4.9
Corporate Local: 4.1% (17% tax)
4.2 4.1
4
280 bps yield spread
2.5
2.1
1.9
2
0.6
0
CMT 10Y Govt Bond 5Y Govt Bond CPF Ordinary 12-mth (S$) Straits Times FTSE Straits Times
1Q 2019 Yield Yield Account Fixed Deposit Index 12-mth Real Estate
(1)
DPU Yield Savings Yield Index 12-mth
Yield
Sources: Bloomberg, Central Provident Fund Board (CPF) and Monetary Authority of Singapore
(1) Based on the annualised DPU of 11.68 cents for the period 1 January 2019 to 31 March 2019 and the closing unit price of S$2.380 on
29 March 2019.
44
CapitaLand Mall Trust Presentation *May 2019*Steady Distributable Income Growth
(1) Based on compounded annual growth rate (‘CAGR’).
45
CapitaLand Mall Trust Presentation *May 2019*Historical Financial Performance
Gross Revenue (S$ million) Total Assets
787.2 807.5 795.4 807.6
774.2 11,501.7
118.2 117.8 113.0 110.1
115.3
689.7 682.4 697.5
658.9 669.0
10,504.4
10,355.7 10,326.7
9,858.3
2014 2015 2016 2017 2018 2014 2015 2016 2017 2018
(1) (2)
CMT Group Joint ventures (For information only)
Distributable Income (S$ million) Distribution Per Unit (cents)
410.7
394.3 395.8
392.0 11.50
11.25
11.13 11.16
375.3
10.84
2014 2015 2016 2017 2018 2014 2015 2016 2017 2018
(1) On 1 October 2015, CMT acquired all the units in Brilliance Mall Trust (BMT) which holds Bedok Mall. Upon acquisition, BMT became a wholly owned subsidiary of CMT. On 15 December 2015, the
divestment of Rivervale Mall was completed. On 30 August 2016, three private trusts namely Victory Office 1 Trust, Victory Office 2 Trust and Victory SR Trust (collectively, the Victory Trusts, each
wholly owned by CMT) were constituted in relation to the redevelopment of Funan. CMT, together with the Victory Trusts jointly own and undertake to redevelop Funan which comprises a retail
component (held through CMT), two office towers and serviced residences. On 31 October 2017, CMT divested all of the units held in Victory SR Trust, which holds the serviced residence
component of Funan, to Victory SR Pte. Ltd., a wholly owned subsidiary of Ascott Serviced Residence (Global) Fund Pte. Ltd.. On 18 June 2018, the divestment of Sembawang Shopping Centre
was completed. On 1 November 2018, the acquisition of the balance 70.00% of the units in Infinity Mall Trust (IMT) was completed. Upon the completion, IMT became a wholly owned subsidiary
of CMT and its financials are consolidated to CMT Group’s financial results with effect from 1 November 2018.
(2) Joint ventures refer to CMT’s 40.0% interest in RCS Trust and CMT’s 30.00% interest in IMT (until 31 October 2018) and Infinity Office Trust.
46
CapitaLand Mall Trust Presentation *May 2019*Prudent Capital Management
Aggregate Leverage (%)(1)
39.0 38.4
38.0
36.7
37.0
36.0 35.3 35.4
34.8
35.0 34.2 34.2
33.8
34.0
33.0
32.0
31.0
2011 2012 2013 2014 2015 2016 2017 2018
Net Debt / EBITDA (times)(2) Interest Coverage (times)(3)
8.0 6.0
6.8 5.0 5.2
7.0 6.3 6.4 4.8 4.8 4.8
6.0 5.0 4.5
6.0 5.4 5.4 4.2
4.9 5.1 3.6
4.0
5.0
4.0 3.0
3.0
2.0
2.0
1.0
1.0
0.0 0.0
2011 2012 2013 2014 2015 2016 2017 2018 2011 2012 2013 2014 2015 2016 2017 2018
(1) In accordance with Property Funds Appendix, CMT’s proportionate share of its joint ventures’ borrowings and total deposited
property value are included when computing the aggregate leverage.
(2) Net Debt comprises Gross Debt less temporary cash intended for refinancing and capital expenditure and EBITDA refers to net
income of CMT Group before fair value changes, non-operational gain and/or loss, interest, tax, depreciation and amortisation.
(3) Ratio of net income of CMT Group before fair value changes, non-operational gain and/or loss, interest and tax over interest
expense.
47
CapitaLand Mall Trust Presentation *May 2019*1Q 2019 Gross Revenue
increased by 10.0% versus 1Q 2018
On Comparable Mall Basis(1), 1Q 2019 Gross Revenue Up 1.2% Y-o-Y
10.0%
Mainly due to acquisition of the balance
70.0% interest in Westgate
(2)
(1) Excludes Funan which was closed in July 2016 for redevelopment, Sembawang Shopping Centre which was divested in
June 2018 and Westgate which was accounted under the performance of joint ventures prior to the acquisition of the
balance 70.0% interest in November 2018.
(2) Includes JCube, Bukit Panjang Plaza, Funan which was closed in July 2016 for redevelopment and Sembawang
Shopping Centre which was divested in June 2018.
48
CapitaLand Mall Trust Presentation *May 2019*1Q 2019 Operating Expenses
increased by 6.3% versus 1Q 2018
On Comparable Mall Basis(1), 1Q 2019 OPEX Down 0.1% Y-o-Y
2.0%
6.3%
Mainly due to acquisition of the balance 70.0%
interest in Westgate, partially offset by the
divestment of Sembawang Shopping Centre
(2)
(1) Excludes Funan which was closed in July 2016 for redevelopment, Sembawang Shopping Centre which was divested in
June 2018 and Westgate which was accounted under the performance of joint ventures prior to the acquisition of the
balance 70.0% interest in November 2018.
(2) Includes JCube, Bukit Panjang Plaza, Funan which was closed in July 2016 for redevelopment and Sembawang
Shopping Centre which was divested in June 2018.
49
CapitaLand Mall Trust Presentation *May 2019*1Q 2019 Net Property Income
increased by 11.5% versus 1Q 2018
On Comparable Mall Basis(1), 1Q 2019 NPI Up 1.7% Y-o-Y
11.5%
(2)
(1) Excludes Funan which was closed in July 2016 for redevelopment, Sembawang Shopping Centre which was divested in
June 2018 and Westgate which was accounted under the performance of joint ventures prior to the acquisition of the
balance 70.0% interest in November 2018.
(2) Includes JCube, Bukit Panjang Plaza, Funan which was closed in July 2016 for redevelopment and Sembawang
Shopping Centre which was divested in June 2018.
50
CapitaLand Mall Trust Presentation *May 2019*1Q 2019 Performance of Joint Ventures
(1)
NPI decreased by 14.4% versus 1Q 2018
On Comparable Mall Basis(2), 1Q 2019 NPI Up 3.9% Y-o-Y
Gross Revenue (S$ million)
Total 23.7
28.6 Total
17.1%
23.7
Raffles City Singapore
23.4
Westgate -
5.2
Operating Expenses (S$ million)
Total 5.2
7.0 Total
5.2 25.5%
Raffles City Singapore
5.6
Westgate -
1.4
Net Property Income (S$ million)
Total 18.5
21.6 Total
14.4%
Raffles City Singapore 18.5
17.8
Westgate -
3.8
1Q 2019 1Q 2018
(Charts are of different scales)
(1) This relates to CMT’s 40.0% interest in Raffles City Singapore and 30.0% interest in Westgate (for the period
1 January 2018 to 31 March 2018).
(2) Excludes Westgate which was accounted under the performance of joint ventures prior to the acquisition
of the balance 70.0% interest in November 2018.
51
CapitaLand Mall Trust Presentation *May 2019*Gross Revenue by Property
CMT PORTFOLIO(1)
% of Total Gross Revenue
For FY 2018
Tampines Mall 10.1
Junction 8 7.5
IMM Building 10.6
Plaza Singapura 11.3
Bugis Junction 10.5
Lot One Shoppers' Mall 5.5
The Atrium@Orchard 6.2
Clarke Quay 4.8
Bugis+ 4.2
Bedok Mall 7.1
Westgate(2) 3.6
Other assets(3) 7.2
Raffles City Singapore 11.4
Total 100.0
(1) Includes CMT’s 40.0% interest in Raffles City Singapore and excludes Funan which was closed in July 2016 for
redevelopment.
(2) Includes CMT’s 30.0% and 100.0% interest in Westgate for period 1 January 2018 to 31 October 2018 and 1
November to 31 December 2018 respectively.
(3) Includes Bukit Panjang Plaza, JCube and Sembawang Shopping Centre which was sold in June 2018.
52
CapitaLand Mall Trust Presentation *May 2019*Well-Diversified Trade Mix
CMT PORTFOLIO(1)
% of Gross Rental Income(2)
For the month of
December 2018
Food & Beverage 31.3
Fashion 12.3
Beauty & Health 11.8
Department Store 6.6
Leisure & Entertainment / Music & Video(3) 4.5
Gifts & Souvenirs / Toys & Hobbies / Books & Stationery / Sporting Goods 4.4
Services 4.4
Shoes & Bags 3.9
Supermarket 3.8
IT & Telecommunications 3.3
Office 3.3
Home Furnishing 3.0
Jewellery & Watches 2.3
Electrical & Electronics 1.7
Education 1.4
Warehouse 1.3
(4)
Others 0.7
Total 100.0
(1) Includes CMT’s 40.0% interest in Raffles City Singapore (excluding hotel lease) and excludes Funan which was closed in
July 2016 for redevelopment and Sembawang Shopping Centre which was sold in June 2018.
(2) Excludes gross turnover rent.
(3) Includes tenants approved as thematic dining, entertainment and a performance centre in Bugis+.
(4) Others include Art Gallery and Luxury.
53
CapitaLand Mall Trust Presentation *May 2019*Top 10 Tenants
10 largest tenants contribute about 19.8% of total gross rental income(1)
No single tenant contributes more than 4.0% of total gross rental income
% of Gross Rental
Tenant Trade Sector
Income
RC Hotels (Pte.) Ltd Hotel 3.3
Temasek Holdings (Private) Limited Office 2.9
Supermarket / Beauty & Health /
Cold Storage Singapore (1983) Pte Ltd 2.4
Services / Warehouse
Supermarket / Beauty & Health / Services /
NTUC Enterprise 2.2
Food & Beverage
Robinson & Co. (Singapore) Pte Ltd Department Store / Beauty & Health 2.0
BHG (Singapore) Pte. Ltd. Department Store 1.7
Wing Tai Retail Management Pte. Ltd. Fashion / Sporting Goods / Shoes & Bags 1.5
Auric Pacific Group Limited Food & Beverage 1.3
BreadTalk Group Limited Food & Beverage 1.3
Isetan (Singapore) Limited Department Store 1.2
Total 19.8
(1) Based on gross rental income for the month of December 2018 and excludes gross turnover rent.
54
CapitaLand Mall Trust Presentation *May 2019*Necessity Shopping vs Discretionary Shopping
CMT PORTFOLIO(1)
By Gross Revenue By Asset Valuation
(For FY 2018) (As at 31 December 2018)
(1) Excludes Funan which was closed on 1 July 2016 for redevelopment and Sembawang Shopping Centre which was divested
on 18 June 2018. Gross revenue includes CMT’s 30.00% and 100.00% interest in Westgate for period 1 January 2018 to
31 October 2018 and 1 November 2018 to 31 December 2018 respectively.
(2) Includes Tampines Mall, Junction 8, IMM Building, Plaza Singapura, Bugis Junction, JCube, Lot One Shoppers’ Mall, Bukit
Panjang Plaza, The Atrium@Orchard, Bedok Mall and Westgate.
(3) Includes Clarke Quay, Bugis+ and CMT’s 40.0% interest in Raffles City Singapore.
55
CapitaLand Mall Trust Presentation *May 2019*Population Growth Drives Local Consumption
Singapore’s population estimated to reach 6.5 - 6.9 million by 2030(1)
Singapore Population
'000 YoY change
6,000 6%
5%
5,000
4%
4,000
3%
3,000 2%
1%
2,000
0%
1,000
-1%
0 -2%
1983
1984
1985
1986
1987
1988
1989
1990
1991
1992
1993
1994
1995
1996
1997
1998
1999
2000
2001
2002
2003
2004
2005
2006
2007
2008
2009
2010
2011
2012
2013
2014
2015
2016
2017
2018
Singapore Residents Non-Residents % Growth Rate of Total Population
Source: Singapore Department of Statistics
(1) Singapore Population White Paper, January 2013
56
CapitaLand Mall Trust Presentation *May 2019*57
0.0%
1.0%
2.0%
3.0%
4.0%
6.0%
5.0%
Jun-89
Dec-89
Jun-90
Dec-90
Jun-91
Dec-91
Jun-92
Source: Bloomberg
Dec-92
Jun-93
Dec-93
Jun-94
Dec-94
Jun-95
Dec-95
Jun-96
Dec-96
Jun-97
Dec-97
Jun-98
Dec-98
Jun-99
Dec-99
Jun-00
Dec-00
Singapore’s Overall Unemployment Rate
Jun-01
Dec-01
Jun-02
Dec-02
Jun-03
Dec-03
Jun-04
Dec-04
Jun-05
Low Unemployment Rate
Dec-05
Jun-06
Dec-06
Jun-07
Dec-07
CapitaLand Mall Trust Presentation *May 2019*
Jun-08
Dec-08
Jun-09
Dec-09
Jun-10
Dec-10
1Q 2019 unemployment rate: 2.2%
Jun-11
Dec-11
Jun-12
Dec-12
Jun-13
Dec-13
Jun-14
Dec-14
Jun-15
Dec-15
Jun-16
Dec-16
Jun-17
Dec-17
Jun-18
Singapore has one of the lowest unemployment rates internationally;
Average (2001 – 2018): 2.5%
Dec-18Strong Household Balance Sheets
Singaporeans have one of the highest percentages of
home ownership in the world
Household Assets & Liabilities
S$’bill
2,000
1,800
1,600
1,400
1,200
1,000
800
600
400
200
0
2007 2008 2009 2010 2011 2012 2013 2014 2015 2016 2017 2018
Shares & Securities Life Insurance CPF Balances
Currency & Deposits Property Total Liabilities
Source: Household Sector Balance Sheet by Department of Statistics, Ministry of Trade & Industry, Republic of Singapore
58
CapitaLand Mall Trust Presentation *May 2019*Singapore International Visitor Arrivals
up 6.2% in 2018
Singapore Tourist Arrivals
million
20 18.5
17.4
18 16.4
15.6 15.2
16 14.5 15.1
13.2
14
11.6
12
9.7
10
8
6
4
2
0
2009 2010 2011 2012 2013 2014 2015 2016 2017 2018
Source: Singapore Tourism Board (STB)
59
CapitaLand Mall Trust Presentation *May 2019*You can also read