ASCENDAS REIT Citi-REITAS-SGX C-Suite Singapore REITS & Sponsors Forum - 25 August 2020
←
→
Page content transcription
If your browser does not render page correctly, please read the page content below
ASCENDAS REIT
Citi-REITAS-SGX C-Suite Singapore REITS & Sponsors Forum
25 August 2020
Disclaimers

•   This presentation may contain forward-looking statements. Actual future performance, outcomes and results may differ materially from
    those expressed in forward-looking statements as a result of a number of risks, uncertainties and assumptions. Representative examples
    of these factors include (without limitation) general industry and economic conditions, interest rate trends, cost of capital and capital
    availability, availability of real estate properties, competition from other developments or companies, shifts in customer demands, shifts in
    expected levels of occupancy rate, property rental income, charge out collections, changes in operating expenses (including
    employee wages, benefits and training, property operating expenses), governmental and public policy changes and the continued
    availability of financing in the amounts and the terms necessary to support future business.

•   You are cautioned not to place undue reliance on these forward-looking statements, which are based on the current view of
    management regarding future events. No representation or warranty expressed or implied is made as to, and no reliance should be
    placed on, the fairness, accuracy, completeness or correctness of the information or opinions contained in this presentation. Neither
    Ascendas Funds Management (S) Ltd (“Manager”) nor any of its affiliates, advisers or representatives shall have any liability whatsoever
    (in negligence or otherwise) for any loss howsoever arising, whether directly or indirectly, from any use, reliance or distribution of this
    presentation or its contents or otherwise arising in connection with this presentation.

•   The past performance of Ascendas Real Estate Investment Trust (“Ascendas Reit”) is not indicative of future performance. The listing of
    the units in the Ascendas Reit (“Units”) on the Singapore Exchange Securities Trading Limited (the “SGX-ST”) does not guarantee a liquid
    market for the Units. The value of the Units and the income derived from them may fall as well as rise. Units are not obligations of,
    deposits in, or guaranteed by, the Manager. An investment in the Units is subject to investment risks, including the possible loss of the
    principal amount invested. Investors have no right to request that the Manager redeem or purchase their Units while the Units are listed
    on the SGX-ST. It is intended that holders of Units may only deal in their Units through trading on the SGX-ST.

•   This presentation is for information only and does not constitute an invitation or offer to acquire, purchase or subscribe for the Units.

                                                                                                                                                    2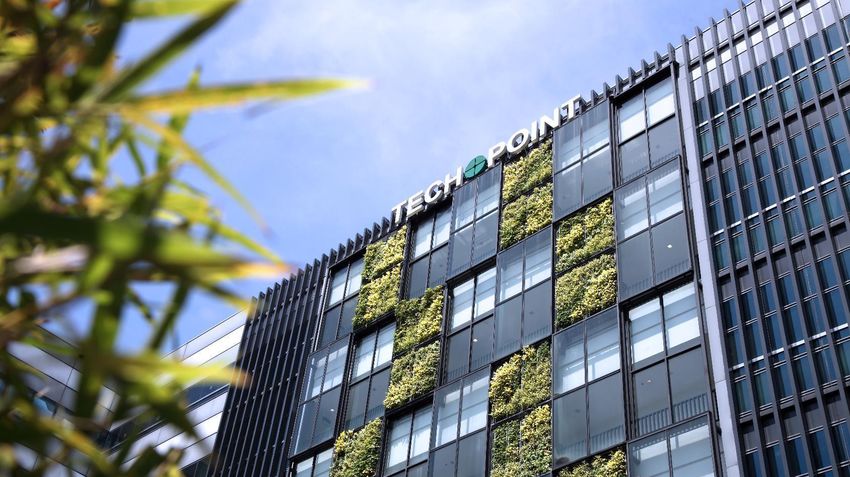
Key Highlights:
1H FY2020
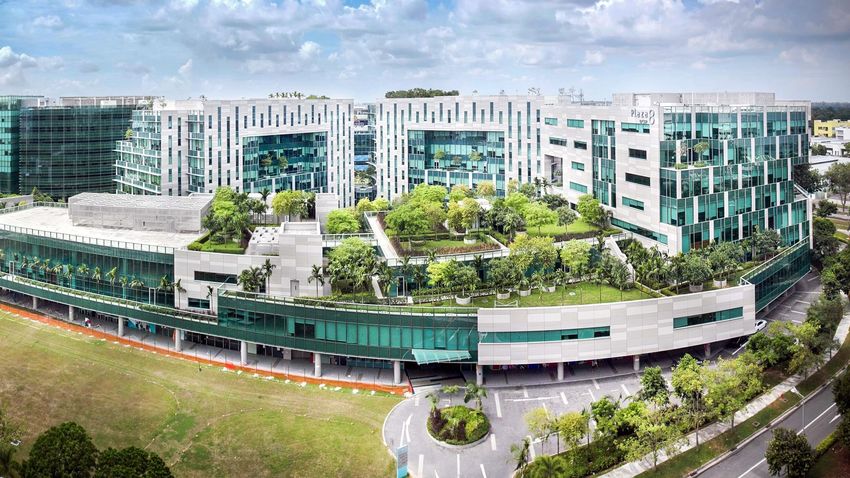
Nexus @one-north, Singapore
Key Highlights for 1H FY2020
Financial Highlights

                   Distributable Income                                          Distribution per Unit                                            Investment Properties

                        S$263.2 m                                                  7.270 cents                                                            S$12.75 b
                       +3.7% y-o-y                                                -10.8% y-o-y

Asset Management                                                                                 Capital Management

  Stable Portfolio                             Positive Portfolio                                    Healthy Aggregate                               High Level of
    Occupancy                                  Rental Reversion#                                        Leverage to                                 Natural Hedge
      91.5 %                                            +5.4%                                                    36.1%                                    >77.0%
  As at 30 June 2020                                                                             From 35.1% as at 31 Dec 2020

# Percentage change of the average gross rent over the lease period of the renewed leases against the preceding average gross rent from lease start date. Takes into account renewed
leases in multi-tenant buildings that were signed 1H FY2020 and average gross rents are weighted by area renewed.                                                                      4
Investment Highlights – 1H FY2020
▪     Completed one acquisition (S$104.6 m(1)) and four asset enhancement initiatives (S$22.9 m)
▪     Three properties divested for sales proceeds of S$125.3 m

                                                                                                                              Purchase Consideration        Completion
1H FY2020                                               Country                        Sub-segment
                                                                                                                                      (S$m)                   Date
Acquisition                                                                                                                             104.6
25% stake in Galaxis                                  Singapore                Business & Science Park                                 104.6(1)             31 Mar 2020
                                                                                                                                                            Completion
1H FY2020                                                Country                         Sub-segment                          Total Cost/Sale Price (S$m)
                                                                                                                                                              Date
Asset Enhancement Initiatives                                                                                                            22.9
The Capricorn                                          Singapore                 Business & Science Park                                  6.0               20 Feb 2020
Plaza 8                                                Singapore                 Business & Science Park                                  8.5                5 Mar 2020
The Galen                                              Singapore                 Business & Science Park                                  7.0                6 Apr 2020
484-490 & 494-500                                       Sydney,
                                                                                             Logistics                                    1.4                29 Apr 2020
Great Western Highway                                   Australia
Divestments                                                                                                                             125.3
Wisma Gulab                                            Singapore                    High-Specs Industrial                                88.0                23 Jan 2020
202 Kallang Bahru                                      Singapore                        Light Industrial                                 17.0                4 Feb 2020
25 Changi South Street 1                               Singapore                        Light Industrial                                 20.3                6 Mar 2020
(1) Purchase consideration adjusted from estimated purchase consideration of $102.9m based on the final completion accounts                                       5
Acquisition (3Q FY2020) :
Lot 7 Kiora Crescent, Yennora, Sydney, Australia
 Purchase Consideration (1)                                  S$21.1 m (A$23.5 m)(2)

 Acquisition Fee, Stamp Duty and
                                                             S$1.29 m (A$1.43 m)
 Other Transaction Costs

 Total Acquisition Cost                                      S$22.39 m (A$24.93 m)

 Vendor                                                      Larapinta Project Pty Ltd

 Valuation as at 30 June 20 (as if
                                                             S$26.4 m (A$29.3 m)(3)
 complete basis)

 Land Area                                                   26,632 sq m                                              Land Parcel at Lot 7 Kiora Crescent, Yennora, Sydney,
                                                                                                                                             Australia
 Land Tenure                                                 Freehold                                              The Property:
                                                                                                                   ▪ The Property to be developed, is a logistics warehouse
 Net lettable area                                           13,100 sq m                                             with an approximate lettable floor area of 13,100 sqm.
                                                                                                                     It is designed to be functional and efficient for a wide
 Initial Net Property Income Yield                           6.2% (5.8% post transaction cost)
                                                                                                                     range of users.
                                                             2Q 2021                                               ▪ The Property will sit on a vacant parcel of freehold
 Development Completion Date
                                                                                                                     land (26,632 sqm).

(1) Includes 9.5 months of rental guarantee provided by the Vendor.                                                Well-Located:
(2) All conversions from Australian Dollar amounts into Singapore Dollar amounts is based on the 31 May 2020
                                                                                                                   ▪ The Property is well located in the established inner-
    exchange rate of A$1.00: S$0.89957
(3) The valuation was commissioned by Ascendas Funds Management (Australia) Pty Ltd and Perpetual                    western Sydney industrial precinct of Yennore, an
    Corporate Trust Limited (in its capacity as trustee of Ascendas Longbeach Trust No. 10), and was carried out     area that enjoys renewed growth given its proximity to
    by Knight Frank NSW Valuation & Advisory Pty Ltd using the capitalisation and discounted cash flow methods.
                                                                                                                     central western Sydney and the trend towards last
                                                                                                                     mile logistics.
                                                                                                                                                                       6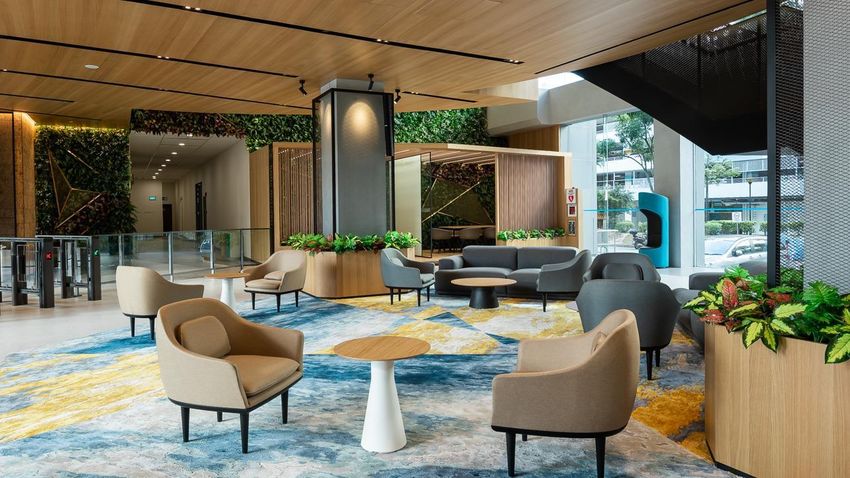
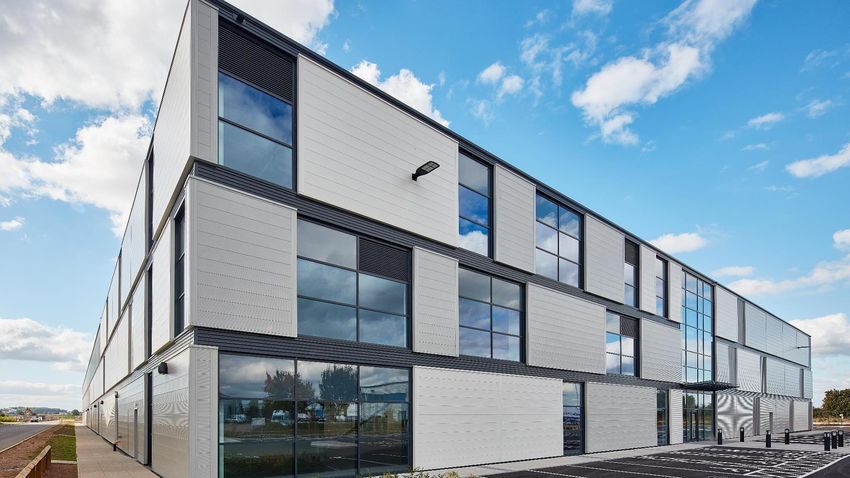
Capital Management

                     1,3 & 5 Changi Business Park Crescent, Singapore
                                             7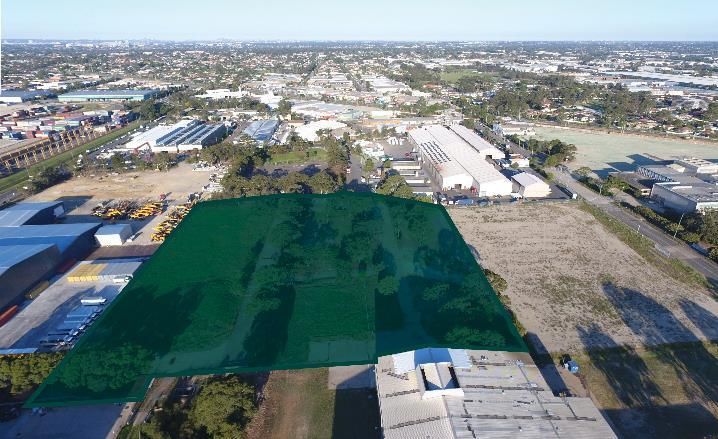
Healthy Balance Sheet
  ▪ Aggregate leverage is healthy at 36.1% (1)(2)
  ▪ Available debt headroom of ~S$3.8 b (1)(2) to reach 50.0% aggregate leverage
  ▪ Total assets include cash and equivalent of ~ S$361 m to meet current financial and operational
    obligations

                                                                                               As at                                     As at                                       As at
                                                                                            30 Jun 2020                               31 Dec 2019                                 30 Jun 2019

 Total Debt (S$m) (1)(3)                                                                        4,963 (2)                                    4,653                                      4,258
 Total Assets (S$m) (1)                                                                        13,739 (2)                                   13,246                                     11,431
 Aggregate Leverage (1)                                                                         36.1%       (2)                              35.1%                                      37.2%
 Unitholders' Funds (S$m)                                                                         7,956                                      7,810                                      6,516
 Net Asset Value (NAV) per Unit                                                               220 cents                                  216 cents                                  209 cents
 Adjusted NAV per Unit (4)                                                                    213 cents                                  213 cents                                  205 cents
 Units in Issue (m)                                                                               3,620                                      3,613                                      3,113
(1) Excludes the effects of FRS 116.
(2) Includes interests in JV
(3) Excludes fair value changes and amortised costs. Borrowings denominated in foreign currencies are translated at the prevailing exchange rates except for JPY/HKD-denominated debt issues, which are
    translated at the cross-currency swap rates that Ascendas Reit has committed to.
(4) Adjusted for the amount to be distributed for the relevant period after the reporting date.                                                                                                           8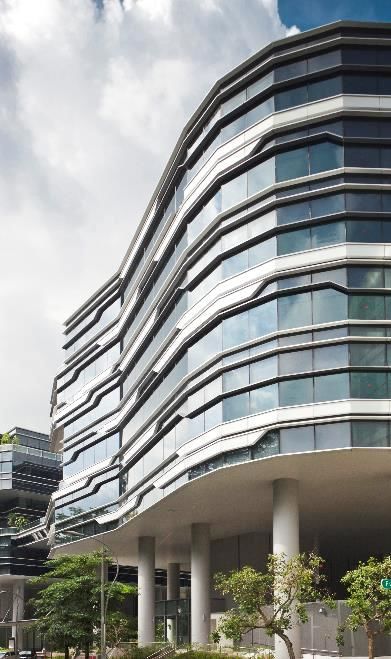
Well-spread Debt Maturity Profile
               ▪ Well-spread debt maturity with the longest debt maturing in FY2029
               ▪ Average debt maturity is stable at 3.6 years
               ▪ S$200m of committed and ~S$1.1b of uncommitted facilities are unutilised

               1000
                                                                       910
                900                                           839               866                           4%
                                                  808                                                              7%
                                                                       154
                800
                                                              200                                  39%
                700                                                             325
                        557                       350
                600
S$ (million)

                                                                       400
                500     100
                                                                                                                     50%
                400                   325                                                                                    350
                300     258                                   639                          254
                                                                                541
                200                   192         458
                                                                       357                                                   350
                100     199                                                                254
                                      132
                  0                    --          --           --      -         --        --          --            --       --
                      FY2020        FY2021      FY2022       FY2023   FY2024   FY2025    FY2026      FY2027        FY2028   FY2029

                               Revolving Credit Facilities                     Committed Revolving Credit Facilities
                                                                                                                                   9
                               Term Loan Facilities                            Medium Term Notes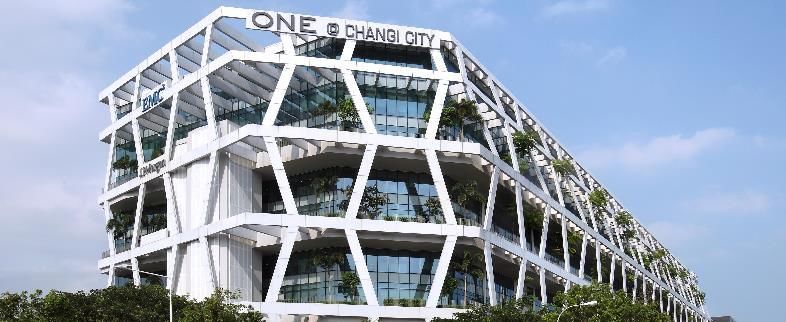
Key Funding Indicators
  ▪ Robust financial metrics that exceed bank loan covenants by a healthy margin
  ▪ A3 credit rating facilitates good access to wider funding options at competitive rates
                                                                                                                               As at                                                    As at
                                                                                                                            30 Jun 2020                                              31 Dec 2019
 Aggregate Leverage (1)(2)                                                                                                      36.1%        (3)                                           35.1%
 Unencumbered Properties as % of Total Investment
                                                                                                                                  92.0%                                                    91.8%
 Properties (4)
 Interest Cover Ratio (5)                                                                                                          4.2 x                                                  4.3 x (6)
 Net Debt (7) / EBITDA                                                                                                             7.6 x                                                    8.1 x
 Weighted Average Tenure of Debt (years)                                                                                             3.6                                                      4.0
 Fixed rate debt as % of total debt                                                                                               80.9%                                                    75.8%
 Weighted Average all-in Debt Cost                                                                                                 2.9%                                                     2.9%
 Issuer Rating by Moody’s                                                                                                            A3                                                       A3
(1) Based on total gross borrowings divided by total assets. Correspondingly, the ratio of total gross borrowings (including perpetual securities) to unitholders’ funds is 63.1%.
(2) Exclude the effects of FRS 116.
(3) Computation includes interests in JV.
(4) Total investment properties exclude properties reported as finance lease receivable.
(5) Based on the trailing 12 months EBITDA (excluding effects of any fair value changes of derivatives and investment properties, and foreign exchange translation), divided by the trailing 12 months interest
    expense and borrowing-related fees.
(6) Restated to include the effects of FRS 116.
(7) Net debt includes lease liabilities arising from FRS 116, 50% of perpetual securities, offset by cash and fixed deposits.
                                                                                                                                                                                                                  10
High Natural Hedge
▪ Maintained high level of natural hedge for Australia (77%), the United Kingdom (100%) and United States
(100%) to minimise the effects of adverse exchange rate fluctuations
AUD GBP USD
Natural Hedge Natural Hedge Natural Hedge
77% 100% 100%
1.8 A$1.7 b
(S$ 1.6 b) US$1.0 b US$1.0 b
1.6
(S$ 1.4 b) (S$ 1.4 b)
1.4 A$1.3 b
(S$ 1.2 b)
S$ (billion)
1.2
1.0
£0.5 b £0.5 b
(S$ 0.8 b) (S$ 0.8 b)
0.8
0.6
0.4
0.2
0.0
Total Australia Total Australia Total United Total United Total United States Total United States
Assets Borrowings Kingdom Assets Kingdom Assets Borrowings
Borrowings
11Asset
Management
Infineon Building , Singapore
12Overview of Portfolio Occupancy
98.4% 97.3% 97.5% 97.5% 100.0%
92.3% 92.1% 92.9% 91.5% 91.7% 91.1%
87.9% 88.6% 88.9%
N.A.
Singapore Australia United Kingdom United States Total
Jun-20 Mar-20 Jun-19
Gross Floor
3,001,471 810,536(2) 509,907 (3) 313,059 4,634,973
Area (sqm) (1)
(1) Gross Floor Area as at 30 Jun 2020.
(2) Gross Floor Area for Australia portfolio refers to the Gross Lettable Area/Net Lettable Area.
(3) Gross Floor Area for United Kingdom portfolio refers to the Gross Internal Area. 13Portfolio Rental Reversions
▪ Average portfolio rent reversion for leases renewed in 2Q FY2020 and 1H FY2020 was 4.3% and 5.4% respectively
▪ Expect to achieve a low single digit positive rent reversion in FY2020 in view of the current uncertainties
% Change in Renewal Rates for Multi-tenant Buildings (1) 2Q FY2020 1Q FY2020 2Q 2019
Singapore 4.0% 7.7% 3.0%
Business & Science Parks 16.3% 7.0% 3.7%
High-Specifications Industrial and Data Centres (30.6%) 12.2% 3.3%
Light Industrial and Flatted Factories 5.1% 4.2% 2.2%
Logistics & Distribution Centres 0.5% 0.3% 2.6%
Integrated Development, Amenities & Retail 19.8% 15.6% 0.0%
Australia 16.6% 13.7% 0.2% (2)
Suburban Offices - (2) 15.7% 1.9% (2)
Logistics & Distribution Centres 16.6% 13.2% -9.9% (2)
United Kingdom - (2) - (2) - (2)
Logistics & Distribution Centres - (2) - (2) - (2)
United States 16.2% 7.4% N.A.
Business Parks 16.2% 7.4% N.A.
Total Portfolio : 4.3% 8.0% 2.7%
(1) Percentage change of the average gross rent over the lease period of the renewed leases against the preceding average gross rent from lease start date. Takes into account renewed leases
that were signed in their respective periods and average gross rents are weighted by area renewed. 14
(2) There were no renewals signed in the period for the respective segments.Ongoing Projects:
Improving Portfolio Quality
▪ Commenced three new AEIs at 21 Changi South Avenue 2, 100 & 108 Wickham Street and 197 – 201
Coward Street for a total sum of S$16.3 m
Estimated
Country Land & Development Cost (S$m)
Completion Date
Acquisition (under development) 104.4
254 Wellington Road Melbourne, Australia 104.4 3Q 2020(1)
Estimated
Country Estimated Value (S$m)
Completion Date
Development 181.2
Built-to-suit business park
Singapore 181.2 2Q 2021(2)
development for Grab
Redevelopment 119.3
UBIX (formerly 25 & 27 Ubi Road 4) Singapore 35.0 4Q 2021(3)
iQuest@IBP Singapore 84.3 1Q 2023(4)
Asset Enhancement Initiatives 26.0
Aperia Singapore 1.2 3Q 2020
52 & 53 Serangoon North Avenue 4 Singapore 8.5 3Q 2020(5)
21 Changi South Avenue 2 (New) Singapore 4.7 1Q 2021
100 & 108 Wickham Street (New) Brisbane, Australia 10.1 4Q 2020
197 – 201 Coward Street (New) Sydney, Australia 1.5 3Q 2020
(1) Delayed from 2Q 2020
(2) Delayed from 1Q 2021
(3) Delayed from 2Q 2021
(4) Delayed from 3Q 2022
(5) Works are completed but Temporary Occupancy Permit (TOP) delayed from 2Q 2020.
15COVID-19 Updates
Nordic European Centre, Singapore
16COVID-19 Country Update
Singapore Australia
Government • Government assistance: • Mandatory code of conduct (for SMEs): landlords unable to
Measures ✓ Property tax rebate (Retail/F&B/amenities: 100%, Industrial: terminate leases/draw on deposits and to offer reductions in
Implemented 30%) rent (as waivers or deferrals) based on the tenant’s
✓ For SMEs: additional cash grant (Retail/F&B/amenities: 0.8 reduction in trade during COVID-19, tenants to honour
months, Industrial: 0.64 months) leases
• Landlord assistance, for qualifying SMEs(1): • Jobkeeper wage subsidy extended by 6 months to Mar 2021
✓ Additional rent waiver (previously to terminate in Sep 2020), but reduced from
✓ Instalment repayment scheme for rental arrears; interest A$1,500 to A$1,200 per fortnight
capped at 3% p.a. • Jobseeker supplement will continue for another 3 months to
• Further S$8b government stimulus announced on 17 Aug 2020 Dec 2020 but eligibility requirements tightened
including extension of Jobs Support Scheme up to Mar 2021
Impact • Qualifying retail/F&B/amenities SME tenants will receive 4 • Suspended rent collection from F&B tenants (COVID-19 Country Update
United Kingdom United States
Government • Up until 30 September 2020, landlords are not allowed to • Landlords are not allowed to evict tenants due to non-
Measures terminate leases for any missed payments. The UK payment of rents in Portland, Oregon (until 31 Mar 2021),
Implemented government has the option to extend this if needed. Tenants San Diego, California (until 30 Dec 2020) and Raleigh, North
will still be liable to pay rent i.e. no rent holiday Carolina (until 20 Dec 2020)
• Deferment of VAT payments for Mar – Jun 2020 to the end of
the financial year
Impact • No rent rebates given to date • Provided rental rebate to one small café operator in
• Allowed some tenants to change their rental payment from Portland
quarterly to monthly in advance and some to defer rent
payments to the latter part of the year, to help them with their
cashflow management
• Defer the VAT payment by one year to Mar-21
• Extending available space for short-term leases
Outlook • 2020 GDP forecast: -9.5% (source: Bloomberg) • 2020 GDP forecast: -5.0% (source: Bloomberg)
• To date, no tenants have pre-terminated due to COVID-19 • To date, no tenants have pre-terminated due to COVID-19
• More leasing challenges expected as many interests have • Majority of our tenants are operating with skeleton crew
been aborted or put on hold. However, leases in the final serving essential functions on site, with rest of staff working
stages are continuing to progress remotely
• Slowdown in leasing activity as tenants hold back
expansion plans; trend towards shorter-term extensions for
near-term expiries
18Key Policy
New Measures ▪ Higher aggregate leverage (gearing) limit to 50% (from 45%)
(By Monetary Authority
▪ Extension to distribute at least 90% of S-REIT’s taxable income for FY ending in
of Singapore, Ministry 2020 from 3 months (after the end of the FY) to 31 Dec 2021 to qualify for tax
of Finance and Inland
Revenue Authority of
transparency
Singapore) ▪ Banks’ assurance that there will be no automatic enforcement of loan
covenant breaches for landlords impacted by the requirements under the
rental relief framework for SMEs(1)
Ascendas Reit
Aggregate ▪ Healthy aggregate leverage at ~36% with available debt headroom of
Leverage ~S$3.8 b(2)(3) before reaching 50.0% aggregate leverage
Distribution ▪ Whilst Ascendas Reit has been distributing 100% of taxable Income available
Policy for distribution, its policy is to distribute at least 90% of the taxable income
(1) Please refer to Ministry of Law Singapore’s news release “New Rental Relief Framework for SMEs” dated 3 June for details on the framework.
(2) Excludes the effects of FRS 116.
(3) Includes interests in JV. 19Prudent Capital Management
Robust Financial ▪ Healthy aggregate leverage at ~36%
Metrics ▪ Financial metrics exceed key bank covenant thresholds
▪ Sufficient cashflow to meet financial and operational obligations
currently
▪ Has reserves of S$561m, comprising of S$361m in cash and S$200m in
committed facilities
Strategy For prudent capital management, we will continue to be selective in:
▪ Acquisitions
▪ Asset Enhancement & Asset Transformation Initiatives projects
20Market Outlook
7 Grevillea Street, Sydney, AustraliaMarket Outlook
▪ The International Monetary Fund (IMF) lowered global growth further for 2020 to -4.9% (from -3% in April 2020) as recent
data releases have indicated deeper downturns in various economies. (source: IMF)
▪ The Singapore economy contracted 13.2% y-o-y in 2Q 2020, and is expected to shrink between -7.0% to -5.0% in 2020.
(source: Ministry of Trade and Industry)
• Companies are expected to put their business and expansion plans on hold until there is greater clarity on the COVID-19
situation in Singapore and globally. Coupled with excess supply in some segments of the industrial market, rental growth and
demand for industrial space may remain subdued.
▪ The Australian economy slowed to a growth of 1.4% y-o-y in 1Q 2020 and is expected to contract by -3.6% in 2020.
(source: Bloomberg)
• The Australian portfolio continues to deliver stable performance due to their good locations in the key cities of Sydney,
Melbourne and Brisbane, long WALE of 4.3 years and average rent escalations of ~3% per annum.
▪ In 2Q 2020, the UK economy contracted by 21.7% y-o-y. 2020 GDP forecast is -9.5%. (source: Bloomberg)
• The high e-commerce penetration rate in the UK is expected to continue to benefit the logistics sector. Ascendas Reit’s UK
portfolio has a long WALE of 9.2 years, which will help to mitigate the on-going uncertainties.
▪ The US economy contracted 9.5% y-o-y in 2Q 2020. Consensus GDP growth forecast for 2020 is -5.0%. (source:
Bloomberg)
• Ascendas Reit’s business park properties, located in US tech cities are well-positioned to benefit from the growing
technology and healthcare sectors.
▪ The COVID-19 situation remains fluid. The economic outlook will be challenging for some time to come and this could
impact the performance of Ascendas Reit. The Manager will work closely with its tenants through these difficult times.
We will continue to keep a close eye on the changing situation so that we will be able to respond accordingly to
protect Unitholders’ interests. Ascendas Reit’s well-diversified portfolio and tenant base should help us to mitigate the
challenges ahead. 22Sustainability
Techpoint, SingaporeSustainability Achievements
Aug 2020: Overwhelming response (>6.5x oversubscribed) to our first S$100m Green Bond
under a newly established Green Finance Framework(1)
Largest no. of BCA Green Mark Properties amongst S-REITs – 34 Properties
1st industrial building in Largest no. of public Electrical Largest combined solar farm
Singapore awarded Green Vehicle (EV) charging points in by a real estate company in
Mark Platinum Super Low Singapore by S-REIT Singapore
Energy (SLE) status by BCA(2)
LogisTech, Singapore 80 Bendemeer Road, Singapore 40 Penjuru Lane, Singapore
>21,000 solar panels across 6 properties
40 lots across 8 properties providing
Best-in-class energy efficient building generating over 10,000 MWh of
high-speed charging
solar energy
(1) Please refer to https://ir.ascendas-reit.com/green_financing.html for Ascendas Reit’s Green Finance Framework.
(2) Building and Construction Authority, Singapore
24Powering Properties with Renewable Energy
Common facilities' electricity usage at three buildings located at one-north will be 100%
powered with renewable energy generated from Ascendas Reit’s solar farms by 2022
Neuros & Immunos Nexus @one-north Nucleos
By 2020 By 2021 By 2022
Power 1,300 four-room Avoid 2.4 mil
HDB flats for a year kg of CO2
25Moving Towards a Green and Sustainable Portfolio
34 Properties with BCA Green Mark Certifications Incorporating Green and Community Spaces
New Developments Existing Properties
Sky Terrace @ Grab’s HQ Fustal courts @ Plaza 8
Collaborative spaces @ Nordic
Sky Deck @ iQuest@IBP
European Centre
26Appendix – Overview of
Ascendas Reit
Unit 2 Wellesbourne Distribution Park,
West Midlands, United KingdomLargest Singapore Industrial Reit
▪ First and largest business space and industrial REIT listed on the Singapore Exchange
▪ Largest Singapore Industrial Reit by AUM and Market Capitalisation
▪ A constituent of many indices such as MSCI, FTSE, EPRA/NAREIT, Straits Times Index
Ave: S$4.0b Ave: S$4.7b Ave: S$3.1b Ave: S$1.7b
Ave: S$4.0b
Source: Bloomberg 28Largest Singapore Industrial Reit
▪ Ascendas Reit is the largest Singapore industrial REIT by AUM and market Investment Properties
capitalisation
▪ Its business space and industrial properties are located across 4 developed ~ S$13 b
markets – Singapore, Australia, the United Kingdom (UK) and the United
States (US)
United Kingdom
Market Capitalisation
United States
> S$10 b
Singapore
Australia
As at 31 March 2020
As at 31 March 2020 29AUM and DPU Growth
▪ Third party acquisitions: 48%
▪ Acquisitions from Sponsor: 40%
▪ Development: 12%
Investment Properties (S$ b) Distribution per Unit (cents)
12.8 12.8
15.638
8.050
7.270
0.6
31 DEC 2003 31 DEC 2019 30 JUN 2020 2003 2019 2020
(JAN - DEC) (JAN - DEC) (JAN - JUN)
30Well Diversified Portfolio
By Value of Investment Properties Australia,
13%
United
▪ As at 30 Jun 2020, total investment properties Kingdom, 6% United States,
stood at S$12.75 b Logistics and 11%
Distribution
Centres Australia Suburban
Logistics and 10% Offices
▪ Well-diversified geographically: Distribution
Centres United
Australia
3%
Kingdom
▪ Singapore portfolio: S$9.03 b Logistics &
6% Business Park US
Distribution
11%
▪ Australia portfolio: S$1.56 b Centres
Singapore
9%
▪ United Kingdom portfolio: S$0.78 b
Integrated
▪ United States portfolio: S$1.38 b Development, Total Investment
Amenities &
Retail Properties
6% ~S$12.75 b
▪ Well-diversified by asset class: Light industrial
and Flatted
Factories
▪ Business & Science Park/ Suburban office: 46% 7%
Business &
Science Parks
▪ Industrial: 29% 32%
High-
▪ Logistics & Distribution Centre: 25% Specifications
Industrial and
Data Centres
Singapore, 16%
70%
Notes:
Multi-tenant buildings account for 71.2% of Ascendas Reit’s portfolio by asset value as at 30 Jun 2020.
Within Hi-Specs Industrial, there are 3 data centres (4.3% portfolio), of which 2 are single-tenant buildings.
Within Light Industrial, there are 2 multi-tenant flatted factories (2.6% of portfolio). 31Customers’ Industry Diversification
(By Monthly Gross Revenue)
▪ Well-diversified customer base across more than 20 industries
More than
20 industries
Note: Customers’ Industry classifications have been updated to better reflect the organisation’s primary industry sector. Previous industry classifications were based on the
32
Singapore Standard Industrial Classification (SSIC) which may be outdated due to changes in business activities.Quality and Diversified Customer Base ▪ Total customer base of more than 1,460 tenants ▪ Top 10 customers (as at 30 Jun 20) account for about 17.4% of monthly portfolio gross revenue* ▪ On a portfolio basis, weighted average security deposit is about 5.1 months of rental income. * Monthly gross revenue has been adjusted to exclude the government grant related to property tax and rent relief support provided to tenants amid the COVID-19 pandemic. 33
Additional Information

  1    Historical Quarterly Results

  2    Ascendas Reit’s Singapore Occupancy vs Industrial Average

  3    Singapore Industrial Property Market

  4    Singapore New Supply

                                                                   34
Historical Quarterly Results
Financial Highlights FY2019 FY2020
1Q 2Q 3Q 1H
(S$ m) Total*
(Apr-Jun) (Jul-Sep) (Oct-Dec) (Jan-Jun)
Gross Revenue 230 230 239 699 521
Net Property Income 178 178 182 538 388
Total Amount Available for
124 124 127 375 263
Distribution
No. of Units in Issue (m) 3,113 3,113 3,613 3,613 3,620
Distribution Per Unit (cents) 4.005 3.978 3.507 11.490 7.270
* Ascendas Reit changed its financial year end from 31 March to 31 December. Therefore, FY2019 is a nine-month period from 1 April 2019 to 31 December 2019. Please refer to the
announcement dated 24 July 2019 for more information.
35Ascendas Reit’s
Singapore Occupancy vs Industrial Average
100%
95% 92.2%
90% 88.3%
86.9% 87.5% 86.7% 87.5%
85.2%
85% 82.9%
Occupancy Rate
80%
75%
70%
65%
60%
55%
50%
Business and Science Park High-Specifications Industrial Light Industrial Logistics
Ascendas Reit JTC Statistics
Source :
Ascendas Reit’s Singapore portfolio as at 30 Jun 2020. Market: : JTC’s Second Quarter 2020 Quarterly Market Report
JTC statistics do not breakdown High-Specifications Industrial and Light Industrial, i.e. they are treated as one category with occupancy of 87.5%.
36Average Market Rents (Singapore)
by Segment
120
2020Q1, 90.9
Rental Index (4Q 2012 =
100
80
100)
60 2019Q4, 91.0 2020Q2, 90.3
40
20
Source : JTC’s Second Quarter 2020 Quarterly Market Report
$6.50 Business Park (City Fringe):
$5.85 psf pm
Average Monthly Gross Rents
$5.50
Business Park (Rest of Island):
$4.50 $3.75 psf pm
$3.50
($psf)
High-Specifications: $3.30 psf pm
$2.50
Logistics: $1.56 psf pm
$1.50
Light Industrial: $1.49 psf pm
$0.50
High-Specifications Light Industrial Logistics Business Park (City Fringe) Business Park (Rest of Island)
37
Source : CBRE Market View Report 2Q 2020 for Business Park (City Fringe), Business Park (Rest of Island), High-Specifications, Light Industrial and Logistics.Singapore Industrial Market:
New Supply
▪ Potential new supply of about 2.6 m sqm (~5.4% of existing stock) over next 3 years, of which 33% are pre-
committed
▪ Island-wide occupancy increased to 89.4% as at 30 Jun 20 (from 89.2% in 31 Mar 20)
New
Existing Supply % of New/
Sector ('000 sqm) 2020 2021 2022 2023 Supply
(Total) Existing supply
(Total)
Business & Science Park 29 185 18 222 455
2195 20.7%
% of Pre-committed (est) 56% 67% 100% 0% 35%
High-Specifications
32 114 105 120 372
Industrial
% of Pre-committed (est) 100% 64% 0% 100% 61%
36,678 4.3%
Light Industrial 341 223 646 0 1,209
% of Pre-committed (est) 4% 36% 27% 0% 22%
Logistics & Distribution
246 83 200 117 646
Centres 11,057 5.8%
% of Pre-committed (est) 43% 70% 40% 0% 38%
Total 648 605 970 459 2,681 49,930 5.4%
% Pre-committed (est) 26% 55% 28% 26% 33% -
Note: Excludes projects under 7,000 sqm. Based on gross floor area
Source: JTC’s Second Quarter 2020 Quarterly Market Report & Ascendas Reit internal research
38Singapore Business & Science Parks:
New Supply
Expected % Pre-committed
Location Developer GFA (sqm)
Completion (Estimated)
2020 One-north Crescent Snakepit-BP LLP 16,320 100%
2020 Cleantech Loop JTC Corporation 12,780 0%
2021 Cleantech Loop JTC Corporation 61,640 0%
2021 Cleantech Loop Surbana Jurong Capital (JID) Pte Ltd 41,350 100%
2021 One-north Avenue Ascendas REIT 36,240 100%
2021 International Business Park Pension Real Estate Singapore Pte Ltd 18,870 100%
2021 Cleantech Heights PBA Innovation Centre Pte Ltd 26,490 100%
2022 Biopolis Road Wilmar International Limited 18,410 100%
2023 Punggol Way JTC Corporation 222,410 0%
454,510 35%
Note: Excludes projects under 7,000 sqm. Based on gross floor area
39Singapore
High-Specifications & Light Industrial:
New Supply
Expected % Pre-committed
Location Developer GFA (sqm)
Completion (Estimated)
2020 Sungei Kadut Street 2 Redwood Interior Pte Ltd 15,000 100%
Digital Singapore 2 Pte
2020 Loyang Drive 32,090 100%
Ltd
2020 Defu South Street 1 JTC Corporation 325,770 0%
2021 Ang Mo Kio Street 64 United Engineers Limited 60,180 100%
2021 Kranji Loop JTC Corporation 133,040 0%
2022 Kallang Way Mapletree Industrial Trust 80,420 0%
SB(Ipark) Investment Pte
2022 Tai Seng Avenue 105,250 0%
Ltd
2022 Ang Mo Kio street 64/65 JTC Corporation 116,940 0%
2022 Bulim Lane 1/2 JTC Corporation 159,400 0%
2022 Sunview Way Malkoha Pte Ltd 171,340 100%
2023 Lok Yang Way Google Asia Pacific Pte Ltd 120,070 100%
1,319,500 30%
Note: Projects that are above 50,000 sqm
40Singapore Logistics:
New Supply
Expected % Pre-committed
Location Developer GFA (sqm)
Completion (Estimated)
2020 Tembusu Crescent S H Cogent Logistics 86,010 100%
2020 Gul Circle JTC Corporation 140,090 0%
2022 Sunview Road NTUC Fairprice Co-operative Ltd 69,610 100%
2022 Tuas South Avenue 14 LOGOS SE Asia Pte Ltd 80,130 100%
Pandan Crescent Pte Ltd
2022 Pandan Crescent 120,200 0%
(Logos)
2023 Sunview Road Allied Sunview Pte Ltd 116,810 0%
614,340 39%
Note: Projects that are above 50,000 sqm 41Thank You
You can also read