Spatiotemporal dynamics of hemorrhagic fever with renal syndrome in Jiangxi province, china - Nature
←
→
Page content transcription
If your browser does not render page correctly, please read the page content below
www.nature.com/scientificreports
OPEN Spatiotemporal dynamics
of hemorrhagic fever with renal
syndrome in Jiangxi province,
China
Shu Yang1,4, Yuan Gao2,4, Xiaobo Liu2, Xiaoqing Liu1, Yangqing Liu1, Soeren Metelmann3,
Chenying Yuan1, Yujuan Yue2, Shengen Chen1* & Qiyong Liu2*
Historically, Jiangxi province has had the largest HFRS burden in China. However, thus far, the
comprehensive understanding of the spatiotemporal distributions of HFRS is limited in Jiangxi. In this
study, seasonal decomposition analysis, spatial autocorrelation analysis, and space–time scan statistic
analyses were performed to detect the spatiotemporal dynamics distribution of HFRS cases from
2005 to 2018 in Jiangxi at the county scale. The epidemic of HFRS showed the characteristic of bi-peak
seasonality, the primary peak in winter (November to January) and the second peak in early summer
(May to June), and the amplitude and the magnitude of HFRS outbreaks have been increasing. The
results of global and local spatial autocorrelation analysis showed that the HFRS epidemic exhibited
the characteristic of highly spatially heterogeneous, and Anyi, Fengxin, Yifeng, Shanggao, Jing’an
and Gao’an county were hot spots areas. A most likely cluster, and two secondary likely clusters
were detected in 14-years duration. The higher risk areas of the HFRS outbreak were mainly located
in Jiangxi northern hilly state, spreading to Wuyi mountain hilly state as time advanced. This study
provided valuable information for local public health authorities to design and implement effective
measures for the control and prevention of HFRS.
Hemorrhagic fever with renal syndrome (HFRS) is a rodent-borne infectious disease caused by hantaviruses in
the Bunyaviridae family1. Transmission of hantavirus to humans occurs via inhalation of aerosolized viral par-
ticles present in the urine, feces, and saliva excreted into the environment by rodents infected with it2. In China,
the major causative agents of HFRS are Hantaan virus (HTNV) and Seoul virus (SEOV), whose natural rodents
hosts are respectively striped field mice (A. agrarius) and Norway rats (R. norvegicus)3,4. So far, China remains
the most endemic country, and there were more than 11,000 HFRS cases reported annually from 2016 to 20185.
Jiangxi province, which is located in the southern bank of the middle and lower reaches of the Yangzi River, is
one of the most serious HFRS endemic areas of China. Since the first case of HFRS was reported in Pengze county
in 1961, the HFRS epidemic has rapidly spread to 6 counties in the 1960s, 39 counties in the 1970s, 65 counties in
the 1980s, and 88 counties in the 1990s. The number of HFRS cases has also risen sharply, and reached a peak in
1985, with an incidence of 21/100,000 persons. The epidemic of HFRS has expanded throughout the central and
northern Jiangxi and reached Ningdu county, Ganzhou city, in the s outh6. Jiangxi currently remains one of the
provinces with the highest HFRS incidence during recent years according to the national HFRS surveillance d ata7.
The susceptible population of HFRS is heterogeneous in space, socioeconomic status, and the geographical
difference between different regions8. Furthermore, infectious disease outbreaks can occur in very short time
periods and infect a large number of i ndividuals9,10. As a result, the adequate distinction between incidence classes
can play a significant role in the accurate mapping and risk assessment of regional disease spread during the time
period of interest11–13. Spatiotemporal analysis has the power of quantitative statistics and mapping visualization,
1
The Collaboration Unit for Field Epidemiology of State Key Laboratory of Infectious Disease Prevention and
Control, Nanchang Center for Disease Control and Prevention, Nanchang 330038, China. 2State Key Laboratory of
Infectious Disease Prevention and Control, National Institute for Communicable Disease Control and Prevention,
Chinese Center for Disease Control and Prevention, Beijing 102206, China. 3Institute of Infection and Global
Health, University of Liverpool, Liverpool L69 7BE, UK. 4These authors contributed equally: Shu Yang and Yuan
Gao. *email: chen903@126.com; liuqiyong@icdc.cn
Scientific Reports | (2020) 10:14291 | https://doi.org/10.1038/s41598-020-70761-0 1
Vol.:(0123456789)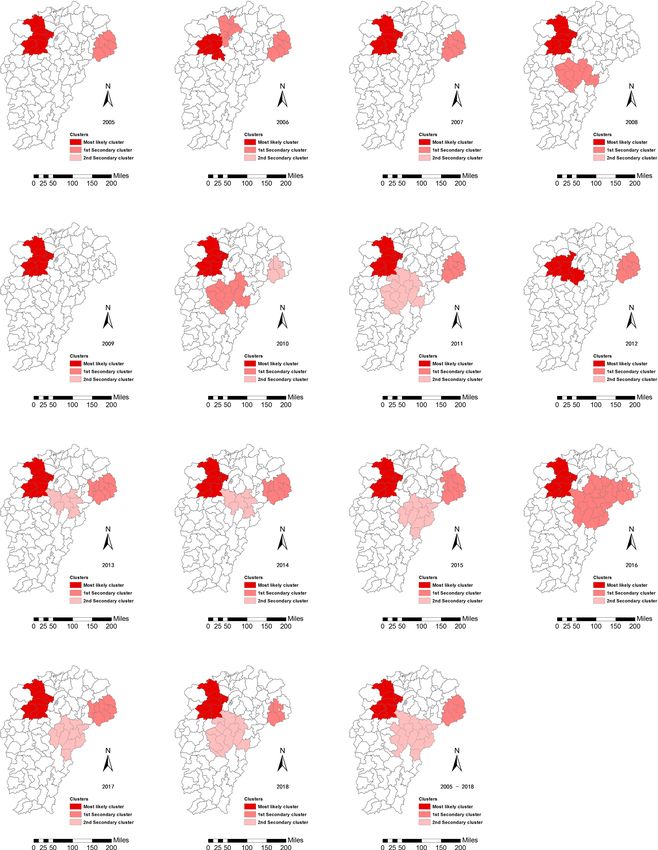
www.nature.com/scientificreports/
Figure 1. The location of the study area. (A) Location of Jiangxi province, in China. (B) Administrative division
of the study area(1. Donghu; 2. Xihu; 3. Qingyunpu; 4. Nanchang county). (C) The geographic distribution of
three zoogeographic regions. (D) The geographic distribution of five zoogeographic states. These maps were
generated by ArcGIS software (Version 10.4 ESRI, Redlands, CA, USA, https://www.esri.com/software/arcgis/
arcgis-for-desktop).
and has been also widely conformed to characterize spatial epidemiology of diseases14–19. However, the dynamics
spatiotemporal distributions of HFRS in Jiangxi have not yet been explored systematically. So this study aims to
explore the dynamics of spatiotemporal distributions based on the case surveillance data from 2005 to 2018 at
the county scale in Jiangxi, and providing valuable scientific support for HFRS monitoring and control.
Materials and methods
Study areas. Jiangxi (24°29′14″–30°04′44″ N, 113°34′36″–118°28′58″ E) lies in southeastern China, with
an approximate area of 16.5 thousand k m2, and population of 44.56 million in 2010, including 11 cities and
100 counties (Fig. 1). Jiangxi belongs to a humid subtropical climate, with annual rainfall, annual average
temperature, and annual average sunshine ranging from 1,341 to 1,943 mm, 16.2 to 19.7 °C, 1,473 to 2,077 h,
respectively20.
Jiangxi is surrounded by mountains on three sides and facing the Yangtze River on the other. The southern
half of the province is hills with ranges and valleys interspersed; while the middle and northern half is flatter
and lower in altitude. Stretching from south to north, the whole land is generally sloping towards Poyang lake,
which has formed a huge basin opening to the north20. In historical literatures, Jiangxi was often divided into
three zoogeographic regions and five zoogeographic states: Jiangxi northern plain region (including the plain
state bordering on rivers and lakes and Jiangxi northern hilly state), Jiangxi central mountainous hilly region
Scientific Reports | (2020) 10:14291 | https://doi.org/10.1038/s41598-020-70761-0 2
Vol:.(1234567890)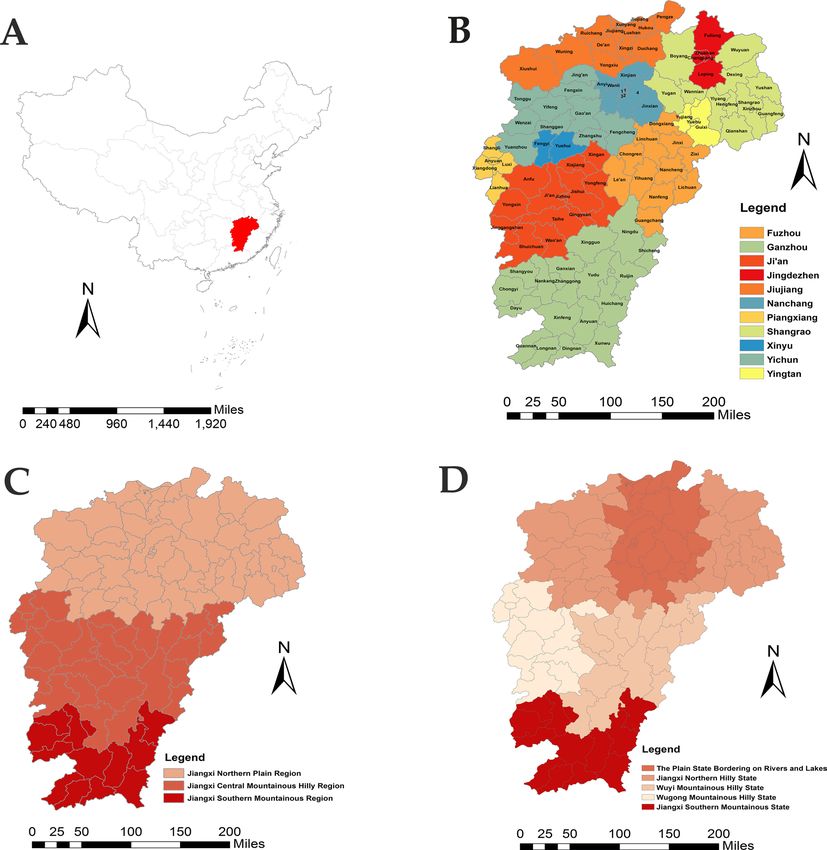
www.nature.com/scientificreports/
(including Wuyi mountainous hilly state and Wugong mountainous hilly state), and Jiangxi southern mountain-
ous region (including Jiangxi southern mountainous state) (Fig. 1).
Data source. Reported daily HFRS data for the period of 2005 to 2018 were extracted from CISDCP in the
Chinese Center for Disease Control and Prevention (China CDC). The gathered information about individual
HFRS cases included the age, occupation onset and confirmation date, case category, and residential address. The
diagnosis of HFRS cases referred to the ‘Diagnostic criteria for epidemic hemorrhagic fever’ (WS278–2008) of
China (https://www.nhc.gov.cn/wjw/s9491/200802/39043.shtml). HFRS cases were aggregated and geocoded to
the corresponding county in ArcGIS (Version 10.4, ESRI Inc., Redlands, CA, USA). The base map was acquired
from the geospatial data cloud (https://www.gscloud.cn/). The population size in every county was issued by the
National Bureau of Statistics of the People’s Republic of China (https://www.stats.gov.cn/tjsj/ndsj/). Clinically
diagnosed and laboratory-confirmed cases were included in our study. And 148 cases were excluded due to
invalid addresses (incomplete, incorrect or outside study area) or suspected cases.
Spatiotemporal cluster analysis. A seasonal-trend decomposition of time series analysis was performed
to explore the various characteristics of periodicity and seasonality in R software (Version 3.1 AT&T BellLabo-
ratories, Auckland, New Zealand). A global spatial autocorrelation analysis and a Local Indicators of Spatial
Association (LISA) analysis were conducted in ArcGIS software (Version 10.4, ESRI Inc., Redlands, CA, USA)
to visualize the global and local spatial clustering of HFRS cases in Jiangxi from 2005 to 2018. Global Moran’s
I Index (ranged from − 1 to 1) was used to analyze global spatial autocorrelation. Moran’s Index = 0 implied a
random spatial distribution. Moran’s I Index < 0 implied a dispersing spatial distribution, and Moran’s I Index > 0
implied a clustering spatial distribution. Local Moran’s I was calculated to explore significant hot spots (High–
High), cold spots (Low–Low), and outliers (High–Low and Low–High)21. A Kulldorff ’s spatiotemporal scan
statistical analysis was used to identify the spatiotemporal clusters of HFRS cases in Jiangxi in SaTScan Software
(Version 9.4, Martin Kulldorff, National Cancer Institute, Bethesda, MD, USA)22. The discrete Poisson probabil-
ity model by a circular window with a radius was used for scanning. The maximum of the spatial and temporal
size were all defined as 25%. A P < 0.05 was considered to be significant.
The maps were made in ArcGIS software (Version 10.4, ESRI Inc., Redlands, CA, USA).
Ethics approval. Ethical approval for the research was granted by the Chinese Center for Disease Control
and Prevention Ethics Committee (No. 2012CB955504). This study didn’t collect patients’ samples, and the data
obtained from the China Information System for Disease Control and Prevention (CISDCP) were anonymized
so that subjects could not be identified. Therefore, the ethics committee agreed that no informed consent was
needed from patients. All methods in our study were used in accordance with the relevant guidelines and regula-
tions.
Results
Descriptive statistics. A total of 7,203 HFRS cases with a case fatality rate of 1.34%, were reported in
Jiangxi from 2005 to 2018. The annual case number ranged from 335 in 2009 to 683 in 2018, and presented a total
uptrend during the 14-year period. Male cases were 4,950 (68.7%), and the male-to-female ratio (not significant)
ranged from 2.9:1 in 2008 to 1.9:1 in 2018. A total of 74.4% of HFRS cases occurred in individuals aged from 16
to 60 years old, and different age group ratios of different years were significantly different (χ2 = 217.0, p = 0.000).
The majority of HFRS cases were farmers (67.2%), followed by students (8.4%). Different occupational ratios of
different years existed significant differences (χ2 = 180.7, p = 0.000) (Table 1).
The cumulative number of HFRS cases in each county ranged from 0 to 1,060, among which Shanggao
county had the highest annual number of 284 cases. The cumulative incidence rate of HFRS varied between
counties (Fig. 2). The top ten counties with the highest HFRS incidence rates were Shanggao (324.46/100,000),
Yifeng (290.46/100,000), An’yi (135.41/100,000), Gao’an (120.87/100,000), Fengxin (88.40/100,000), Qianshan
(66.46/100,000), Hengfeng (63.47/100,000), Yushan (58.96/100,000) and Xingan (50.32/100,000), all of which
located in Jiangxi northern hilly state. No cases were reported from Jiangxi southern mountainous state.
Seasonal decomposition analyses. The seasonal trend was explored using a season-trend decomposi-
tion in R software (Fig. 3). There was a rhythmic vibration in the raw data from 2005 to 2018. Seasonality and
trend components were isolated from the raw data and also eliminated part of the random noise or reminder
component. The epidemic of HFRS showed a bi-peak seasonality characteristic each year, with the primary peak
occurring in winter (November to January) and the second peak happening in early summer (May to June). In
addition, the epidemic of HFRS collectively showed an upward trend and the variation characteristic of perio-
dicity with the amplitude and the magnitude of the periodical variation increasing.
Spatial autocorrelation analysis. The global spatial autocorrelation analysis was performed based on
county-level HFRS cases in Jiangxi (Table 2). The annual global Moran’s I indexes, which ranged from 0.14 to
0.38, all passed the significance level test (p < 0.05), indicating that the spatial distribution of the HFRS epidemic
was not random from 2005 to 2018, with t-shaped spatial autocorrelation characteristics at county-level scale.
Moran’s I indexes showed an uptrend from 2006 to 2010, and then stayed at a relatively stable level after 2011,
suggesting that the spatial aggregation increased first and then stabilized.
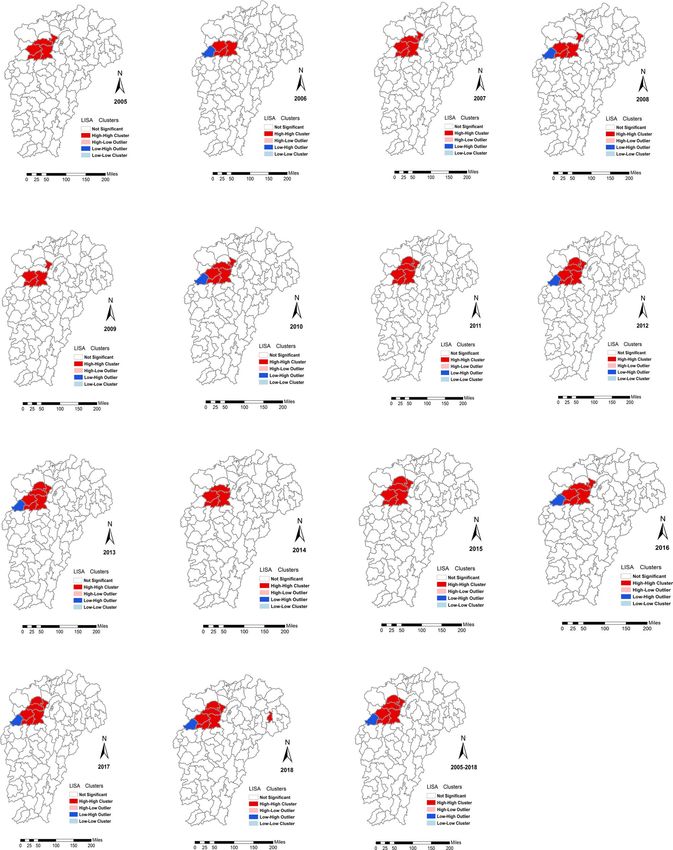
LISA was performed to detect local spatial clusters of the HFRS epidemic (Fig. 4). Three counties, Yifeng,
Shanggao and Gao’an, were hot spots (High–High cluster area) in the whole study period and An’yi was a
Scientific Reports | (2020) 10:14291 | https://doi.org/10.1038/s41598-020-70761-0 3
Vol.:(0123456789)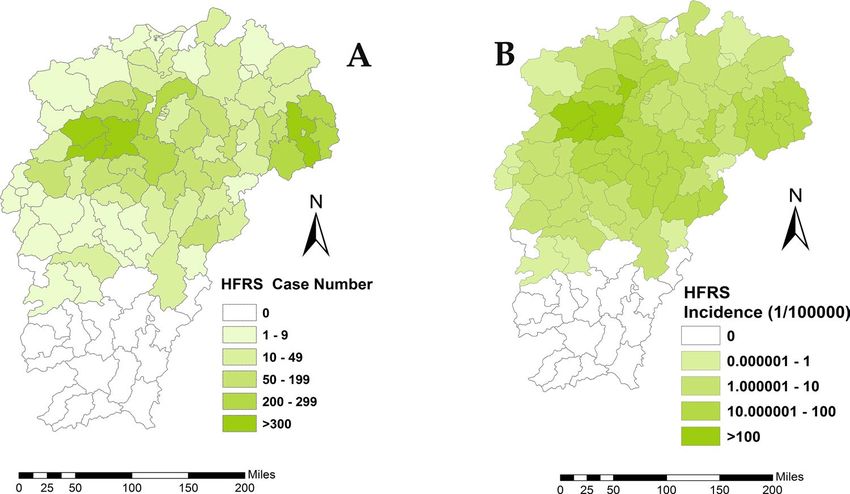
www.nature.com/scientificreports/
Gender Occupation Age
Year Male Female Students Farmers Workers Housework/unemployment Others < 16 16~ > 60
2005 308 (68.6) 141 (31.4) 53 (11.8) 289 (64.4) 21 (4.7) 25 (5.6) 61 (13.6) 40 (9.1) 374 (83.3) 35 (8.0)
2006 292 (71.0) 119 (29.0) 36 (8.8) 275 (66.9) 31 (7.5) 28 (6.8) 41 (10.0) 22 (5.4) 345 (83.9) 44 (10.8)
2007 271 (70.9) 111 (29.1) 33 (8.6) 285 (74.6) 24 (6.3) 9 (2.4) 31 (8.1) 20 (5.3) 320 (83.8) 42 (11.2)
2008 237 (67.5) 81 (29.1) 26 (7.4) 268 (76.4) 17 (4.8) 13 (3.7) 27 (7.7) 20 (5.7) 296 (84.3) 35 (10.0)
2009 244 (72.8) 91 (27.2) 28 (8.4) 235 (70.1) 16 (4.8) 20 (6.0) 36 (10.7) 18 (5.5) 277 (82.7) 40 (12.1)
2010 262 (68.6) 120 (31.4) 35 (9.2) 247 (64.7) 25 (6.5) 22 (5.8) 53 (13.9) 29 (7.6) 314 (82.2) 39 (10.3)
2011 356 (68.2) 166 (31.8) 38 (7.3) 361 (69.2) 21 (4.0) 32 (6.1) 70 (13.4) 36 (7.0) 410 (78.5) 76 (14.8)
2012 437 (73.0) 162 (27.0) 39 (6.5) 429 (71.6) 13 (2.2) 52 (8.7) 66 (11.0) 42 (7.0) 432 (72.1) 125 (20.9)
2013 454 (66.6) 228 (33.4) 65 (9.5) 461 (67.6) 21 (3.1) 67 (9.8) 68 (10.0) 65 (9.7) 479 (70.2) 138 (20.5)
2014 354 (69.7) 154 (30.3) 29 (5.7) 333 (65.6) 28 (5.5) 47 (9.3) 71 (14.0) 33 (6.5) 376 (74.0) 99 (19.6)
2015 447 (66.1) 229 (33.9) 61 (9.0) 439 (64.9) 22 (3.3) 43 (6.4) 111 (16.4) 63 (9.4) 471 (69.7) 142 (21.1)
2016 454 (67.9) 215 (32.1) 54 (8.1) 426 (63.7) 17 (2.5) 60 (9.0) 112 (16.7) 63 (9.4) 449 (67.1) 157 (23.5)
2017 389 (70.2) 165 (29.8) 52 (9.4) 334 (60.3) 21 (3.8) 60 (10.8) 87 (15.7) 57 (10.3) 376 (67.9) 121 (21.9)
2018 445 (65.2) 238 (34.8) 58 (8.5) 456 (66.8) 17 (2.5) 79 (11.6) 73 (10.7) 71 (10.4) 438 (64.1) 174 (25.5)
1,267
Total 4,950 (68.7) 2,253 (31.3) 607 (8.4) 4,838 (67.2) 294 (4.1) 557 (7.7) 907 (12.6) 579 (8.0) 5,357 (74.4)
(17.6)
Table 1. Characteristics of all 7,203 hemorrhagic fever with renal syndrome cases in the study areas, 2005–
2018.
Figure 2. Spatial distribution of hemorrhagic fever with renal syndrome cases in the study area. (A) Spatial
distribution of HFRS case. (B) Cumulative incidence of HFRS case. These maps were generated by ArcGIS
software (Version 10.4 ESRI, Redlands, CA, USA, https://www.esri.com/software/arcgis/arcgis-for-desktop).
relatively stable hot spot. Moreover, Fengxin became a stable hot spot after 2010, and Jing’an developed into a
relatively stable hot spot since 2011, and Hengfeng was identified as a hot spot in 2018, indicating that hot spots
areas expanded gradually. Wanzai was an outlier (Low–High cluster area). All of them were in the eastern part
of Jiangxi northern hilly state.
Spatiotemporal clusters analysis. The incidence of HFRS was aggregated through space and time using
Kulldorff ’s spatiotemporal scan statistics. The distribution of the HFRS epidemic existed significant heterogene-
ity in Jiangxi from 2005 to 2018. The most likely cluster was stable on the whole located in the western part of
the Jiangxi northern hilly state, and showed the trend of spreading to the periphery in 2006 and 2012. Second-
ary clusters formed a core area in the eastern part of Jiangxi northern hilly state, spread to Wuyi mountain hilly
state over time, firstly developed into two isolated parts in 2010, and merged into the largest one in 2016 (Fig. 5).
A most likely cluster, and two secondary likely clusters were detected in a 14-year duration (Table 3). The
most likely cluster included Jiujiang city (Wuning county), Nanchang city (An’yi and Wanli county), and Yichun
city (Jing’an, Yifeng, Shanggao, Gao’an and Fengxin county). Wanli was in the plain states bordering on rivers
and lakes, and the other counties attributed to Jiangxi northern hilly state. The expected case number was 85.05,
Scientific Reports | (2020) 10:14291 | https://doi.org/10.1038/s41598-020-70761-0 4
Vol:.(1234567890)www.nature.com/scientificreports/
5.0
4.0
data
3.0
2.0
0.5
seasonal
0.0
−0.5
3.8
trend
3.4
3.0
0.5
remainder
0.0
−0.5
−1.0
2006 2008 2010 2012 2014 2016 2018
time
Figure 3. Decomposed hemorrhagic fever with renal syndrome cases in the study area from 2005 to 2018.
These maps were generated by ArcGIS software (Version 10.4 ESRI, Redlands, CA, USA, https://www.esri.com/
software/arcgis/arcgis-for-desktop).
while the observed case number was 896. The relative risk for the analysis was 11.89 (LLR = 1,346.95, P < 0.05).
A total of 2,474,558 human beings were included with a time frame from 1/1/2013 to 31/12/2015. The first sec-
ondary cluster covered Shangrao city (Yushan, Shangrao, Xinzhou, Guangfeng, Hengfeng and Qianshan county)
in the eastern part of Jiangxi northern hilly state, and the second secondary cluster covered Yichun (Fengcheng
county), Ji’an (Yongfeng and Xingan county) and Fuzhou city (Linchuan, Jinxi, Zixi, Lichuan, Nancheng, Nan-
feng, Guangchang, Yihuang, Chongren and Le’an county), of these counties attributing to the plain state border-
ing on rivers and lakes, Jiangxi northern hilly state and Wuyi mountainous hilly state, separately.
Discussion
In recent years, though an obvious decline in HFRS cases followed intensified control campaigns in China,
HFRS would persist in China under the current control and prevention measures23. The results of this study
also revealed that the amplitude and the magnitude of HFRS outbreaks in Jiangxi increased from 2005 to 2018.
The susceptible population remained mainly in male farmers in the age groups of 16 to 60 years old, but the
proportion of female HFRS cases was increasing.
Consistent with several s tudies9,11,24, the results of this study showed that the incidence of HFRS in Jiangxi had
a major epidemic season (winter, November–January) and a minor seasonal peak (early summer, May–June) each
year, which is corresponded to the epidemic peak of HTNV-type HFRS and SEOV-type HFRS, respectively15.
Hereby, this study indicated that Jiangxi was a mixed epidemic area dominated by HTNV. The result differed
from that of a previous virology study in 2002, which indicated that Jiangxi was a mixed epidemic area domi-
nated by SEOV-type based on the amplification and sequencing results of hantavirus-positive m ice25. A possible
Scientific Reports | (2020) 10:14291 | https://doi.org/10.1038/s41598-020-70761-0 5
Vol.:(0123456789)www.nature.com/scientificreports/
Year Moran’s I Z-value P-value
2005 0.25 2.77 < 0.01
2006 0.14 2.01 < 0.05
2007 0.22 2.65 < 0.01
2008 0.29 3.15 < 0.01
2009 0.25 2.80 < 0.01
2010 0.38 3.78 < 0.001
2011 0.33 3.30 < 0.001
2012 0.33 3.41 < 0.001
2013 0.31 3.20 < 0.01
2014 0.30 3.49 < 0.001
2015 0.32 3.54 < 0.001
2016 0.27 3.22 < 0.01
2017 0.38 3.86 < 0.001
2018 0.34 3.58 < 0.001
2005–2018 0.35 3.62 < 0.001
Table 2. Global spatial autocorrelation analysis of reported hemorrhagic fever with renal syndrome in the
Jiangxi province of China, 2005–2018.
explanation was that environmental change, with the rapid urbanization process, could alter the composition of
rodent species and increase the number of striped field mice in urban area26, causing that Jiangxi developed into
a HTNV-type dominated mixed epidemic area. In addition, SEOV infections were more likely to be neglected
because of the mild symptoms causing low rates of visiting d octors27. However, SEOV infection should not be
ignored even though HTNV infection was dominated at present. Because unlike other hantaviruses, SEOV
could easily spread throughout the entire colony when they were introduced28,29. Moreover, the host of SEOV,
R. norvegicus, whose lifestyle differs greatly from that of A. agrarius, feeding on various food items from humans
instead of field crops, are widely distributed in Jiangxi30,31, which is more likely to transmit the virus to humans
compared with striped field mice. Unluckily, we are lack of the virus surveillance data until now. Therefore,
more research efforts should be undertaken in animal hosts surveillance, causative agents detection, and latent
infection investigation in the future in Jiangxi to implement targeted strategies of HFRS prevention and control.
The global model revealed that the distribution of HFRS cases in Jiangxi exhibited the characteristics of spatial
aggregation. Subsequently, the LISA model and spatiotemporal scan analysis showed that the higher risk areas of
the HFRS outbreak were mainly located in Jiangxi northern hilly state, spreading to Wuyi mountain hilly state as
time advanced, but no HFRS cases were reported in Jiangxi southern mountainous state. This phenomenon might
be affected by natural environmental factors, such as altitude. Some studies have revealed that HFRS occurrence
was restricted to areas of altitude of below 200 m15,32,33. The average altitude ranges from 300 to 500 m in Jiangxi
southern mountainous state, while it is flatter and lower in the middle and northern half. Moreover, though it
was difficult to collect available data of the rodent host for our study, a past study in 1985 in Jiangxi indicated
that A. agrarius was dominant rodent species in Jiangxi northern plain region, with no distribution in Jiangxi
southern mountainous region25. This suggested that the distribution of HFRS cases was consistent with that of
the rodent host. However, the higher incidence areas of HFRS were in Jiangxi northern hilly state instead of
the low-lying plain state of bordering rivers and lakes, which was also different from the results of neighboring
provinces34,35. This phenomenon might be explained by several factors. Firstly, the low-lying plain state was not
only the Poyang Lake eco-economic zone, but also the political, cultural, and economic center of Jiangxi prov-
ince with an urbanization process at an unprecedented pace over the past 15 years, which has reduced the risk
of human-rodent contact because of the better environment36–39. Secondly, in 1998, the Yangtze river flooding
occurred in the whole region, and then the project of “returning the farmland to the lake” was implemented in
2003, which caused the water level of Poyang lake to rise. The expansion of the wetland area might have induced
that the rodent host shifted to Jiangxi northern hilly state with higher altitude40,41. Finally, to protect the ecologi-
cal environment of Poyang lake, the implementation of “Mountain-River–Lake Program”, with the ecological
concept of “mountain as source, river as connection flow, and lake as storage” 20 years ago has accelerated the
local industrial transformation, and more and more local farmers worked in enterprises or engaged in technical
production42. All the above factors in the region provided human beings with fewer opportunities for exposure
to rodent hosts.
Some limitations should be considered when interpreting our findings. Firstly, the bias could exist in this
study because the HFRS cases did not differentiate HTNV from SEOV infections, and came from the passive
surveillance system called CISDCP. Secondly, social factors and urbanization level might have an important
impact on the epidemic process of HFRS but were not included in the analysis due to data unavailable. Finally,
specific species of rodent populations were not characterized in our study area.
In conclusion, this study has analyzed the spatiotemporal characteristics of HFRS comprehensively in Jiangxi
from 2005 to 2018. We found that HFRS cases were aggregated in Jiangxi northern hilly state, spreading to Wuyi
mountain hilly state as time advanced. Therefore, more interventions should be implemented for the preven-
tion and control of HFRS in the future, including animal hosts surveillance, causative agents detection, medical
Scientific Reports | (2020) 10:14291 | https://doi.org/10.1038/s41598-020-70761-0 6
Vol:.(1234567890)www.nature.com/scientificreports/
Figure 4. Local indicators of spatial association cluster maps for hemorrhagic fever with renal syndrome in the
study area from 2005 to 2018. These maps were generated by ArcGIS software (Version 10.4 ESRI, Redlands,
CA, USA, https://www.esri.com/software/arcgis/arcgis-for-desktop).
Scientific Reports | (2020) 10:14291 | https://doi.org/10.1038/s41598-020-70761-0 7
Vol.:(0123456789)www.nature.com/scientificreports/
Figure 5. Yearly spatiotemporal clusters of hemorrhagic fever with renal syndrome cases in the study area
from 2005 to 2018 using Kulldorff ’s space–time scan statistic. These maps were generated by ArcGIS software
(Version 10.4 ESRI, Redlands, CA, USA, https://www.esri.com/software/arcgis/arcgis-for-desktop).
Scientific Reports | (2020) 10:14291 | https://doi.org/10.1038/s41598-020-70761-0 8
Vol:.(1234567890)www.nature.com/scientificreports/
Most likely cluster 1st Secondary clusters 2nd Secondary clusters
Longitude (E) 28.71 28.49 27.39
Latitude (N) 115.18 118.04 116.24
Radius (km) 65.20 53.76 90.50
Time frame 2013/1/1 to 2015/12/31 2011/1/1 to 2013/12/31 2016/1/1 to 2018/12/31
Population 2,474,558 3,055,676 5,568,486
No. counties 8 6 13
Fengcheng, Linchuan, Jinxi, Zixi, Lichuan,
Wuning, Jingan, Anyi, Wanli, Fengxin, Yifeng, Yushan, Shangrao, Xinzhou, Guangfeng, Heng-
Cluster counties Nancheng, Nanfeng, Guangchang, Yihuang, Chon-
Shanggao, Gaoan feng, Qianshan
gren, Le’ an, Yongfeng, Xingan
Annual cases/100,000 12.10 4.20 1.80
Observed/expected 10.54 3.62 1.56
Relative risk 11.89 3.77 1.58
Log-likelihood ratio 1,346.95 220.18 26.09
P-value p < 0.05 p < 0.05 p < 0.05
Table 3. Spatiotemporal clusters of hemorrhagic fever with renal syndrome cases in Jiangxi at the county level,
2005–2018. Most likely cluster: p-value < 0.05; Secondary cluster: p-value < 0.05.
training, and health promotion. Most importantly, further research efforts should be undertaken to explore the
potentially influential factors and etiological surveillance in the next step to provide more scientific evidence
for the prevention and control of HFRS.
Data availability
All data involved in the study are available from Q. Liu and S.E.C.
Received: 31 January 2020; Accepted: 20 July 2020
References
1. Mittler, E. et al. Hantavirus entry: Perspectives and recent advances. Adv.. Virus Res. 104, 185–224. https: //doi.org/10.1016/bs.aivir
.2019.07.002 (2019).
2. Charbonnel, N. et al. Immunogenetic factors affecting susceptibility of humans and rodents to hantaviruses and the clinical course
of hantaviral disease in humans. Viruses 6, 2214–2241. https://doi.org/10.3390/v6052214 (2014).
3. Zhang, Y. Z., Yang, Z., Zhen, F. F. & Plyusnin, A. Hantavirus infections in humans and animals, China. Emerg. Infect. Dis. 16,
1195–1203 (2010).
4. Zou, L.-X., Chen, M.-J. & Sun, L. Haemorrhagic fever with renal syndrome: Literature review and distribution analysis in China.
Int. J. Infect. Dis. 43, 95–100 (2016).
5. Liu, Q. Epidemic profile of vector-borne diseases and vector control strategies in the new era. Chin. J. Vector Biol. Control 30, 1–11.
https://doi.org/10.11853/j.issn.1003.8280.2019.01.001 (2019).
6. Health Records of Jiangxi Province. http://www.jxsfzg.cn/id_153/chapter.shtml, Nanchang, Administration of Local Chronicles
of Jiangxi Province. Accessed 11 Jan 2020.
7. Liu, X., Zhang, T., Xie, C. & Xie, Y. Changes of HFRS incidence caused by vaccine intervention in Yichun City, China, 2005–2013.
Med. Sci. Monitor Int. Med. J. Exp. Clin. Res. 22, 295–301 (2016).
8. Tian, H. & Stenseth, N. C. The ecological dynamics of hantavirus diseases: From environmental variability to disease prevention
largely based on data from China. PLoS Neglect. Trop. Dis. 13, e0006901. https://doi.org/10.1371/journal.pntd.0006901 (2019).
9. He, J. et al. Probabilistic logic analysis of the highly heterogeneous spatiotemporal HFRS incidence distribution in Heilongjiang
province (China) during 2005–2013. PLoS Neglect. Trop. Dis. 13, e0007091. https://doi.org/10.1371/journal.pntd.0007091 (2019).
10. Ma, C. et al. Analysis of an outbreak of hemorrhagic fever with renal syndrome in college students in Xi’an, China. Viruses 6,
507–515. https://doi.org/10.3390/v6020507 (2014).
11. Wu, H. et al. Spatial-temporal characteristics and the epidemiology of haemorrhagic fever with renal syndrome from 2007 to 2016
in Zhejiang Province, China. Sci. Rep. 8, 10244. https://doi.org/10.1038/s41598-018-28610-8 (2018).
12. He, J. et al. Spatiotemporal variation of the association between climate dynamics and HFRS outbreaks in Eastern China during
2005–2016 and its geographic determinants. PLoS Neglect. Trop. Dis. 12, e0006554. https://doi.org/10.1371/journal.pntd.0006554
(2018).
13. Tian, H. Y. et al. Changes in rodent abundance and weather conditions potentially drive hemorrhagic fever with renal syndrome
outbreaks in Xi’an, China, 2005–2012. PLoS Neglect. Trop. Dis. 9, e0003530. https://doi.org/10.1371/journal.pntd.0003530 (2015).
14. Sun, J. et al. Spatiotemporal patterns of severe fever with thrombocytopenia syndrome in China, 2011–2016. Ticks Tick Borne Dis
9, 927–933. https://doi.org/10.1016/j.ttbdis.2018.03.026 (2018).
15. Li, S. et al. Spatiotemporal heterogeneity analysis of hemorrhagic fever with renal syndrome in china using geographically weighted
regression models. Int. J. Environ. Res. Public Health 11, 12129–12147 (2014).
16. Li, R. et al. Epidemiological characteristics and spatial–temporal clusters of mumps in Shandong Province, China, 2005–2014. Sci.
Rep. 7, 46328. https://doi.org/10.1038/srep46328 (2017).
17. Yue, Y. et al. Spatio-temporal patterns of scrub typhus in mainland China, 2006–2017. PLoS Neglect. Trop. Dis. 13, e0007916. https
://doi.org/10.1371/journal.pntd.0007916 (2019).
18. Gao, Y. et al. Epidemiological characteristics and spatiotemporal patterns of typhus group Rickettsiosis at the County level in
China, 2005–2017. Int. J. Infect. Dis. IJID https://doi.org/10.1016/j.ijid.2019.11.018 (2019).
19. Zhao, Y. et al. Analyzing hemorrhagic fever with renal syndrome in Hubei Province, China: A space-time cube-based approach.
J. Int. Med. Res. 47, 3371–3388. https://doi.org/10.1177/0300060519850734 (2019).
20. Jiangxi Statistical Yearbook 2018. http://www.jxstj.gov.cn/resource/nj/2018CD/indexeh.htm. Nanchang, Statistic Bureau of Jiangxi.
Accessed 10 Jan 2020.
Scientific Reports | (2020) 10:14291 | https://doi.org/10.1038/s41598-020-70761-0 9
Vol.:(0123456789)www.nature.com/scientificreports/
21. Yang, S. et al. Spatiotemporal distribution of tuberculosis during urbanization in the new urban area of Nanchang City, China,
2010–2018. Int. J. Environ. Res. Public Health https://doi.org/10.3390/ijerph16224395 (2019).
22. Kulldorff, M. A spatial scan statistic. Commun. Stat. 26, 1481–1496 (1997).
23. Li, L. et al. Hemorrhagic fever with renal syndrome in China: Mechanisms on two distinct annual peaks and control measures.
Int. J. Biomath. https://doi.org/10.1142/S1793524518500304 (2018).
24. Ke, G. et al. Epidemiological analysis of hemorrhagic fever with renal syndrome in China with the seasonal-trend decomposition
method and the exponential smoothing model. Sci. Rep. 6, 39350. https://doi.org/10.1038/srep39350 (2016).
25. S.W., W., C.S., H., H., W., Y.X., X. & B.J., M. Genotype and clade distribution of hantaviruses in China. Chin. J. Virol. 18, 211–216
(2002).
26. McKinney, M. Urbanization, biodiversity, and conservation. Bioscience 52, 883–890. https : //doi.org/10.1641/0006-
3568(2002)052[0883:UBAC]2.0.CO;2 (2009).
27. Zhang, X. et al. Comparison of Hantaan and Seoul viral infections among patients with hemorrhagic fever with renal syndrome
(HFRS) in Heilongjiang, China. Scand. J. Infect. Dis. 43, 632–641. https://doi.org/10.3109/00365548.2011.566279 (2011).
28. Mc, E. L. et al. High prevalence of Seoul hantavirus in a breeding colony of pet rats. Epidemiol. Infect. 145, 3115–3124. https://doi.
org/10.1017/s0950268817001819 (2017).
29. Kerins, J. L. et al. Outbreak of seoul virus among rats and rat owners—United States and Canada, 2017. MMWR Morb. Mortal
Wkly. Rep. 67, 131–134. https://doi.org/10.15585/mmwr.mm6704a5 (2018).
30. Feng, A. Y. T. & Himsworth, C. G. The secret life of the city rat: a review of the ecology of urban Norway and black rats (Rattus
norvegicusandRattus rattus). Urban Ecosyst. 17, 149–162 (2020).
31. Li, Y. et al. Intrinsic and extrinsic drivers of transmission dynamics of hemorrhagic fever with renal syndrome caused by Seoul
hantavirus. PLoS Neglect. Trop. Dis. 13, e0007757. https://doi.org/10.1371/journal.pntd.0007757 (2019).
32. Xiao, H. et al. Ecology and geography of hemorrhagic fever with renal syndrome in Changsha, China. BMC Infect. Dis. 13, 305.
https://doi.org/10.1186/1471-2334-13-305 (2013).
33. Ge, L. et al. Spatio-temporal pattern and influencing factors of hemorrhagic fever with renal syndrome (HFRS) in Hubei Province
(China) between 2005 and 2014. PLoS ONE 11, e0167836. https://doi.org/10.1371/journal.pone.0167836 (2016).
34. Liu, H. N. et al. Time-specific ecologic niche models forecast the risk of hemorrhagic fever with renal syndrome in Dongting Lake
district, China, 2005–2010. PLoS ONE 9, e106839. https://doi.org/10.1371/journal.pone.0106839 (2014).
35. Bi, P., Wu, X., Zhang, F., Parton, K. A. & Tong, S. Seasonal rainfall variability, the incidence of hemorrhagic fever with renal syn-
drome, and prediction of the disease in low-lying areas of China. Am. J. Epidemiol. 148, 276–281. https://doi.org/10.1093/oxfor
djournals.aje.a009636 (1998).
36. Michishita, R. Monitoring two decades of urbanization in the Poyang Lake area, China through spectral unmixing. Remote Sens.
Environ. https://doi.org/10.1016/j.rse.2011.06.021 (2012).
37. Zhong, Y., Lin, A. & Zhou, Z. Evolution of the pattern of spatial expansion of urban land use in the Poyang lake ecological economic
zone. Int. J. Environ. Res. Public Health https://doi.org/10.3390/ijerph16010117 (2019).
38. Xie, H., Wang, P. & Huang, H. Ecological risk assessment of land use change in the Poyang Lake Eco-economic Zone, China. Int.
J. Environ. Res. Public Health 10, 328–346. https://doi.org/10.3390/ijerph10010328 (2013).
39. Lv, T. W. L. et al. Coupling coordinated development and exploring its influencing factors in Nanchang, China: From the perspec-
tives of land urbanization and population urbanization. Land 8, 178 (2019).
40. Zhang, Y., Zou, Z. & Zhang, X. Wetland landscape pattern evolution of Poyang Lake ecological economic zone. Yangtze River 50,
65–69 (2019).
41. Huang, F. et al. Water regime evolution of large seasonal lakes: Indicators for characterization and an application in Poyang Lake,
China. Int. J. Environ. Res. Public Health https://doi.org/10.3390/ijerph15112598 (2018).
42. Chen, M., Wei, X., Huang, H. & Lü, T. Poyang Lake basin: A successful, large-scale integrated basin management model for devel-
oping countries. Water Sci. Technol. 63, 1899–1905. https://doi.org/10.2166/wst.2011.413 (2011).
Acknowledgements
This study was supported by the National Science and Technology Major Project (No. 2017ZX10303404005,
URLs: https://www.nmp.gov.cn/). The funders had no role in study design, data collection and analysis, deci-
sion to publish, or preparation of the manuscript. We thank all the doctors and staff who have collected and
reported HFRS cases.
Author contributions
All authors have approved the final version of the manuscript, and have significant contributions to the work.
S.Y., Y.G., X.L., and Q. Liu conceived the idea for this study, performed the statistical analysis, and contributed
to the first draft and final version of this paper. C.Y.Y, X.Q. L., Y.Q.L., S.E.C. were responsible for data collection,
data interpretation, and manuscript review. S.M. and Y.J.Y participated in revising the study.
Competing interests
The authors declare no competing interests.
Additional information
Correspondence and requests for materials should be addressed to S.C. or Q.L.
Reprints and permissions information is available at www.nature.com/reprints.
Publisher’s note Springer Nature remains neutral with regard to jurisdictional claims in published maps and
institutional affiliations.
Scientific Reports | (2020) 10:14291 | https://doi.org/10.1038/s41598-020-70761-0 10
Vol:.(1234567890)www.nature.com/scientificreports/
Open Access This article is licensed under a Creative Commons Attribution 4.0 International
License, which permits use, sharing, adaptation, distribution and reproduction in any medium or
format, as long as you give appropriate credit to the original author(s) and the source, provide a link to the
Creative Commons licence, and indicate if changes were made. The images or other third party material in this
article are included in the article’s Creative Commons licence, unless indicated otherwise in a credit line to the
material. If material is not included in the article’s Creative Commons licence and your intended use is not
permitted by statutory regulation or exceeds the permitted use, you will need to obtain permission directly from
the copyright holder. To view a copy of this licence, visit http://creativecommons.org/licenses/by/4.0/.
© The Author(s) 2020
Scientific Reports | (2020) 10:14291 | https://doi.org/10.1038/s41598-020-70761-0 11
Vol.:(0123456789)You can also read