IMPACT OF POPULATION DENSITY AND WEATHER ON COVID-19 PANDEMIC AND SARS-COV-2 MUTATION FREQUENCY IN BANGLADESH
←
→
Page content transcription
If your browser does not render page correctly, please read the page content below
Epidemiology and Infection                            Impact of population density and weather on
        cambridge.org/hyg
                                                              COVID-19 pandemic and SARS-CoV-2 mutation
                                                              frequency in Bangladesh
                                                              Nadim Sharif             and Shuvra Kanti Dey
        Original Paper
        Cite this article: Sharif N, Dey SK (2021).           Department of Microbiology, Jahangirnagar University, Savar, Dhaka 1342, Bangladesh
        Impact of population density and weather on
        COVID-19 pandemic and SARS-CoV-2 mutation               Abstract
        frequency in Bangladesh. Epidemiology and
        Infection 149, e16, 1–10. https://doi.org/              Coronavirus disease-2019 (COVID-19) has caused the recent pandemic worldwide. Research
        10.1017/S0950268821000029                               studies are focused on various factors affecting the pandemic to find effective vaccine or ther-
                                                                apeutics against COVID-19. Environmental factors are the important regulators of COVID-19
        Received: 16 September 2020
        Revised: 15 December 2020
                                                                pandemic. This study aims to determine the impact of weather on the COVID-19 cases, fatal-
        Accepted: 31 December 2020                              ities and frequency of mutations in Bangladesh. The impacts were determined on 1, 7 and 14
                                                                days of the case. The study was conducted based on Spearman’s correlation coefficients. The
        Key words:                                              highest correlation was found between population density and cases (rs = 0.712). Among
        Bangladesh; COVID-19; mutation frequency;
                                                                metrological parameters, average temperature had the strongest correlation (rs = −0.675)
        population density; temperature; UV index
                                                                with the cases. About 82% of Bangladeshi isolates had D614G at spike protein. Both tempera-
        Author for correspondence: Prof. Dr.                    ture and UV index had strong effects on the frequency of mutations. Among host factors,
        Shuvra Kanti Dey,                                       coinfection is highly associated with frequency of different mutations. This study will give a
        E-mail: shuvradey@yahoo.com                             complete picture of the effects of metrological parameters on COVID-19 cases, fatalities
                                                                and mutation frequency that will help the authorities to take proper decisions.

                                                              Introduction
                                                              Severe acute respiratory syndrome coronavirus-2 (SARS-CoV-2) (family − Coronaviridae)
                                                              has triggered the coronavirus 2019 (COVID-19) pandemic worldwide [1, 2]. Other viruses
                                                              of this family − severe acute respiratory syndrome (SARS) virus and Middle East severe
                                                              acute respiratory syndrome (MERS) virus have caused local outbreaks in the past [3].
                                                              Primarily, coronaviruses can infect the upper respiratory system in humans [1–3]. First, two
                                                              isolates − human coronavirus 229E and human coronavirus OC43 were detected in the
                                                              early 1960s in patients with pneumonia-like symptoms [1, 3]. As of 12 August 2020,
                                                              COVID-19 has infected 19 936 210 individuals and caused the death of 732 499 infected per-
                                                              sons in 220 countries and territories worldwide [4]. Currently, COVID-19 is one of the major
                                                              health burdens worldwide [5, 6].
                                                                  COVID-19 infected patients develop various clinical symptoms, as the virus infects the
                                                              upper respiratory tract [1]. Among the most common clinical features, fever, cough, sore
                                                              throat, shortness of breath are significant. Most of the patients (70%) develop mild symptoms.
                                                              Asymptomatic patients and patients with mild symptom have good recovery rate [1, 4, 7].
                                                              However, other clinical features such as chill, feelings of shaking, loss of taste or smell, head-
                                                              ache, rash and muscle pain have been diagnosed in numerous COVID-19 patients worldwide.
                                                              In severe cases, acute pneumonia, acute respiratory syndrome, kidney failure, difficulty in
                                                              breathing and failure of multiple organs have been reported [1, 8]. Comorbidities are asso-
                                                              ciated with significant frequency of the COVID-19 fatalities worldwide [1, 4, 9].
                                                                  Emergence and reemergence of infectious viruses have been mostly reported during winter
                                                              with cold temperature worldwide [10]. Seasonality of different viruses such as West Nile
                                                              viruses, rotavirus, adenovirus and many other viruses are well established now [11–13].
                                                              Different environmental factors − temperature, humidity, rainfall, UV intensity, wind speed
                                                              etc. have played significant roles in COVID-19 pandemic [14–16]. Environmental factors
        © The Author(s), 2021. Published by                   occupy important role in the survival, viability and transmission of infectious viruses [17–
        Cambridge University Press. This is an Open           22]. Some well-established modes of transmission for COVID-19 are contact (both direct
        Access article, distributed under the terms of
                                                              and indirect), droplet nuclei and fomite (non-living objects) transmission [17–19].
        the Creative Commons Attribution licence
        (http://creativecommons.org/licenses/by/4.0/),        Environmental factors can regulate the transmission by affecting the viability of coronaviruses
        which permits unrestricted re-use,                    in droplet nuclei and fomite [14, 20–23]. Besides, severity and expansion of the COVID-19
        distribution, and reproduction in any medium,         pandemic are affected by other factors like population density, hygienic conditions of mass
        provided the original work is properly cited.         people, duration of strict lock down and transportation of infected persons across borders [24].
                                                                  In Bangladesh, the first COVID-19 case was detected on 07 March 2020. As of 10 August
                                                              2020, about 260 507 cases and 3438 fatalities due to COVID-19 have been reported in
                                                              Bangladesh [25]. The total population of Bangladesh is about 170 306 468 with a population
                                                              density of 1265 person/km2 [26]. COVID-19 cases and fatalities have been reported from

Downloaded from https://www.cambridge.org/core. IP address: 46.4.80.155, on 31 Jan 2021 at 07:04:24, subject to the Cambridge Core terms of use, available at https://www.cambridge.org/core/terms.
https://doi.org/10.1017/S0950268821000029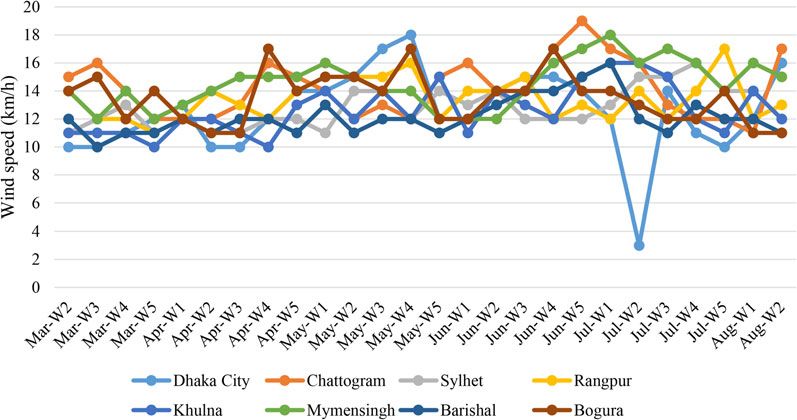
2                                                                                                                                 Nadim Sharif and Shuvra Kanti Dey

       64 districts in Bangladesh. As of 10 August 2020, most of the                              from official websites of WHO (www.who.int), Bing (www.bing.
       COVID-19 cases were reported from Dhaka (60%), Chattogram                                  com/covid), Worldometers (www.worldometers.info/coronavirus/)
       (10%), Bogura (5%), Khulna (5%), Sylhet (5%) and                                           and Johns Hopkins University (https://coronavirus.jhu.edu/).
       Mymensingh (4%) in Bangladesh. As of 16 August 2020, about                                 Environmental data including minimum temperature (⁰C), average
       20% of the total COVID-19 tests (1 364 189) were positive in                               temperature (°C), maximum temperature (°C), UV index, wind
       Bangladesh. The case fatality rate of COVID-19 is about 1.3%                               speed (km/h), rain fall (mm), relative humidity (%) were collected
       in Bangladesh, which is higher (3.5%) in other countries world-                            from different databases including official website of Bangladesh
       wide [25].                                                                                 Meteorological Department (http://live4.bmd.gov.bd/satelite/v/
           SARS-CoV-2 is a positive sense virus with a non-segmented,                             sat_infrared/), meteoblue (www.meteoblue.com), AccuWeather
       single-stranded RNA (ssRNA) genome of ∼30 000 bases [1, 2].                                (www.accuweather.com) and WeatherOnline (www.weatheron-
       The genome can act as a direct mRNA as it contains a 5′ cap                                line.co.uk) during this study. The whole genome of SARS-CoV-2
       structure along with a 3′ poly (A) tail. Open reading frames                               isolated from Bangladesh and reference genome sequences were
       (ORFs), 1a, 1b, 3a, 3b, 6, 7a, 7b, 8a, 8b and 9b are most common                           collected from the official website of GISAID (https://www.gisaid.
       in SARS-CoV-2 genome. First two ORFs-1ab comprise of                                       org/). Accession number of sequences are: EPI_ISL_437912,
       ∼20 000 bases (two-third of genome) and encode for replicase                               EPI_ISL_445213, EPI_ISL_445214, EPI_ISL_445215, EPI_ISL_445216,
       proteins (non-structural proteins). Sixteen non-structural proteins                        EPI_ISL_445217, EPI_ISL_445244, EPI_ISL_447590, EPI_ISL_447897,
       (nsps) – nsp1 to nsp16 have been identified. Later ORFs (∼10 000                           EPI_ISL_447899, EPI_ISL_447904, EPI_ISL_450339, EPI_ISL_450340,
       bases) encode for four major structural proteins-spike (S), enve-                          EPI_ISL_450340, EPI_ISL_450341, EPI_ISL_450342, EPI_ISL_450343,
       lope (E), membrane (M) and nucleocapsid (N) [1, 2, 9]. The                                 EPI_ISL_450344, EPI_ISL_450345, EPI_ISL_450839, EPI_ISL_450840,
       mutation frequency is moderate in coronavirus. Various factors                             EPI_ISL_450841, EPI_ISL_450842, EPI_ISL_450843, EPI_ISL_455420,
       including host and environmental factors are involved in the                               EPI_ISL_455458, EPI_ISL_455459, EPI_ISL_458133, EPI_ISL_462090,
       mutational events of coronaviruses [27, 28]. Mutations at S pro-                           EPI_ISL_462091, EPI_ISL_462092, EPI_ISL_462093, EPI_ISL_462094,
       tein can change the pathogenesis of the virus and initiation of                            EPI_ISL_462095, EPI_ISL_462096, EPI_ISL_462097, EPI_ISL_462098,
       specific host immune responses [29]. Further, environmental fac-                           EPI_ISL_464159, EPI_ISL_464160, EPI_ISL_464161, EPI_ISL_464162,
       tors such as high temperature, UV radiation and high humidity                              EPI_ISL_464163, EPI_ISL_464164, EPI_ISL_466626, EPI_ISL_466627,
       play active role in evolving mutant viruses [27]. Host factors                             EPI_ISL_466628, EPI_ISL_466629, EPI_ISL_466630, EPI_ISL_466636,
       including age, gender, immune status and presence of coinfec-                              EPI_ISL_466637, EPI_ISL_466638, EPI_ISL_466639, EPI_ISL_466644,
       tions are also involved in mutation events [30].                                           EPI_ISL_466645, EPI_ISL_466649, EPI_ISL_466650, EPI_ISL_466686,
           The main aim of this study is to analyse the correlation                               EPI_ISL_466687, EPI_ISL_466688, EPI_ISL_466689, EPI_ISL_466690,
       between metrological factors and frequency of mutations in                                 EPI_ISL_466691, EPI_ISL_466692, EPI_ISL_466693, EPI_ISL_466694,
       SARS-CoV-2. The second objective of this study is to determine                             EPI_ISL_468070-EPI_ISL_468078, EPI_ISL_469285, EPI_ISL_469286,
       the relationship between host factors and SARS-CoV-2 mutation                              EPI_ISL_469297-EPI_ISL_469300, EPI_ISL_470801, EPI_ISL_475083,
       frequency. The third objective of this study is to investigate the                         EPI_ISL_475084, EPI_ISL_475165-EPI_ISL_475173, EPI_ISL_475238,
       correlation between environmental factors and COVID-19 pan-                                EPI_ISL_475570, EPI_ISL_475571.
       demic in Bangladesh. This study will provide a better insight on
       the effects of environmental factors on COVID-19 pandemic in                               Whole genome analysis
       Bangladesh.
                                                                                                  The nucleotide sequences of the whole genome of novel corona-
                                                                                                  viruses were analysed using Chromas 2.6.5 (Technelysium,
       Materials and methods                                                                      Helensvale, Australia). Sequence homology was determined by
                                                                                                  using the BLASTn program (https://blast.ncbi.nlm.nih.gov/Blast.
       Study areas and duration                                                                   cgi). Multiple sequence alignment for the whole genome of
       This study focused on the correlation of COVID-19 with metro-                              Bangladeshi novel coronavirus strains and reference strains
       logical parameters in eight cities in Bangladesh. This study                               (Wuhan/WIV04/2019 and NC_045512/Wuhan-Hu-1) were con-
       included Dhaka (23.71°N to 90.41°E), Chattogram (22°20′ 06′′ N                             ducted by using BioEdit 7.2.6 by using the ClustalW Multiple
       to 91°49′ 57′′ E), Bogura (24°51′ N to 89°22′ E), Khulna (22°49′ N                         Alignment algorithm. Mutational analysis was performed for spe-
       to 89°33′ E), Sylhet (24°54′ N to 91°52′ E) and Mymensingh                                 cific positions of novel coronavirus whole genome nucleotide
       (24°45′ 14′′ N to 90°24′ 11′′ E), Barishal (22°48′ 0′′ N to 90°30′ 0′′ E)                  sequences and peptide chains.
       and Rangpur (25°44′ N to 89°15′ E). With a population density
       of 46 997 person/km2, Dhaka is the most populous capital in                                Statistical analysis
       the world. The study period was from 07 March 2020 to 14                                   All data were analysed using unbiased statistical approach.
       August 2020. On 07 March 2020, COVID-19 patients were                                      Spearman’s rank correlation coefficient (rs) was determined
       detected for the first time in Bangladesh and considered as day                            between metrological parameters and COVID-19 cases and fatal-
       1 for the study.                                                                           ities [14]. Further, Spearman’s rank correlation coefficient (rs) was
                                                                                                  determined among environmental factors, host factors and muta-
                                                                                                  tion frequency of novel coronaviruses. The association between
       Study data                                                                                 two variables can be defined using a monotonic function by
       The data of COVID-19 cases and fatalities were collected from                              using Spearman’s rank correlation coefficient (rs). The coefficient
       official websites of the Directorate General of Health Services                            equation can be written as
       (DGHS) (https://covid19bd.idare.io/) and Institute of Epidemiology,                                                              2
       Disease Control and Research (https://www.iedcr.gov.bd/website/)                                                                   di
                                                                                                                          rs = 1 − 6
       in Bangladesh, and cross-confirmed by analysing the data                                                                      n(n2 − 1)

Downloaded from https://www.cambridge.org/core. IP address: 46.4.80.155, on 31 Jan 2021 at 07:04:24, subject to the Cambridge Core terms of use, available at https://www.cambridge.org/core/terms.
https://doi.org/10.1017/S0950268821000029
Epidemiology and Infection 3
Fig. 1. Total COVID-19 cases and fatalities in Bangladesh.
Table 1. Distribution of COVID-19 cases in eight different cities in Bangladesh
Here ‘n’ represented the number of alternatives, and ‘di’ is the
difference between the ranks of two parameters. Cities Total COVID-19 cases
Dhaka 70 202
Results Chattogram 15 775
Analysis of COVID-19 cases and fatalities Bogura 5614
Khulna 5039
After 162 days from the detection of the first confirmed
COVID-19 case in Bangladesh, the total cases had increased to Sylhet 4912
260 507 and fatalities to 3438 with 1.3% case fatality rate Mymensingh 3078
(Fig. 1). Most of the COVID-19 cases (n = 70 202) had been
Barishal 2806
reported from Dhaka followed by Chattogram (n = 15 775)
Bogura (n = 5614), Khulna (n = 5039), Sylhet (n = 4912) and Rangpur 1736
Mymensingh (n = 3078), Barishal (n = 2806) and Rangpur (n =
1736), respectively (Table 1, Fig. 2). Among eight cities, Dhaka
is the most populous and polluted city. The mobility of large UV is an important metrological factor that affects the trans-
number of workers is one of the major factors of rapid transmis- mission and mutation frequency of novel coronaviruses. During
sion of COVID-19 cases in Dhaka city. this study, the average UV index was recorded between 6.5 and
8 in Bangladesh. The highest average UV index was recorded in
Barishal and Bogura [7] followed by Dhaka (7.9), Mymensingh
Analysis of metrological parameters
(7.4), Khulna (7.3), Rangpur (7), Sylhet (6.9) and Chattogram
Among metrological parameters, temperature is the most signifi- (6.5), respectively (Fig. 5). The highest UV index was recorded
cant factor related with COVID-19 pandemic. The average of in Dhaka (9.8) on 24 June 2020.
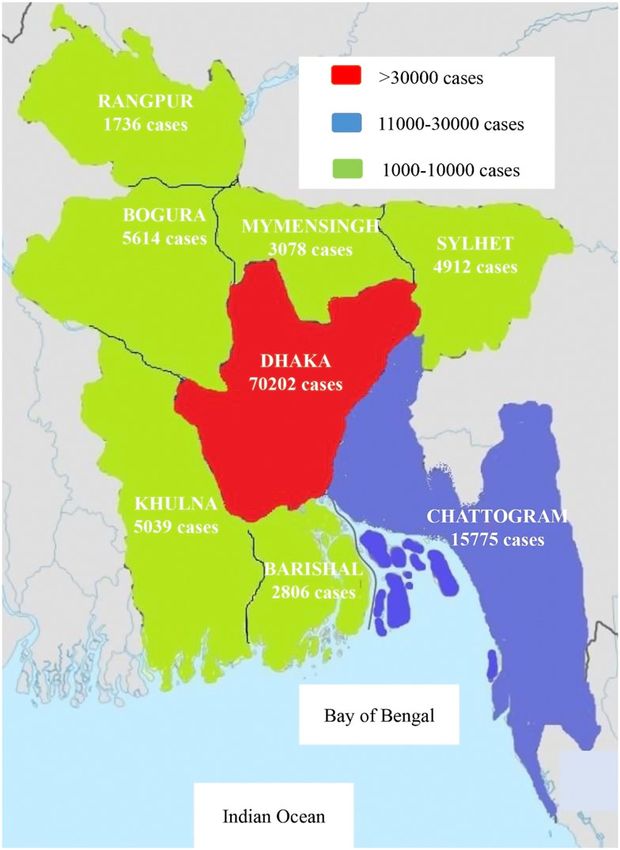
maximum temperature was 32 °C, and ranged from 28 °C to Wind speed has direct effect on the spread of droplet nuclei
38 °C in eight cities in Bangladesh. The average of minimum tem- containing virus particles. The average wind speed was recorded
perature was 21 °C, and ranged from 18 °C to 26 °C in eight cities from 3 km/h to 19 km/h in this study. During this study, the high-
in Bangladesh. The mean of average temperature was 27 °C, and est average wind speed was recorded in Chattogram (17 km/h)
ranged from 25 °C to 32 °C in Bangladesh during March 2020 followed by Bogura (16 km/h), Mymensingh (16 km/h), Khulna
to August 2020 (Fig. 3). The mean of minimum, maximum and (15 km/h), Dhaka (14 km/h), Barishal (14 km/h), Rangpur
average temperature varied ± 4 °C in eight cities. The lowest tem- (13 km/h) and Sylhet (11 km/h), respectively (Fig. 6).
perature was recorded in Rangpur (14 °C) on 14 March 2020 and Dhaka (46 997 person/km2) is the most populous city in the
the highest temperature was found in Dhaka (38 °C) on 02 July world with total population of 21 006 000, followed by Khulna
2020. (34 000 person/km2) with a total population of 1 122 000,
Relative humidity is another important metrological parameter Chattogram (19 800 person/km2) with a total population of
associated with infectious diseases. The average relative humidity 9 453 496, Sylhet (19 865 person/km2) with a total population
ranged from 55% to 85% in eight cities in Bangladesh. The highest of 526 412, Barishal (10 524 person/km2) with a total population
average relative humidity was detected in Chattogram (78%), fol- of 385 093, Bogura (7763 person/km2) with a total population of
lowed by Dhaka (76%), Rangpur (74%) and Khulna (73%), 540 000, Mymensingh (5200 person/km2) with a total popula-
respectively (Fig. 4). The highest relative humidity (95%) in a sin- tion of 476 543 and Rangpur (4167 person/km2) with a total
gle day was recorded from Barishal in 29 May 2020. population of 15 665 000, respectively.
Downloaded from https://www.cambridge.org/core. IP address: 46.4.80.155, on 31 Jan 2021 at 07:04:24, subject to the Cambridge Core terms of use, available at https://www.cambridge.org/core/terms.
https://doi.org/10.1017/S0950268821000029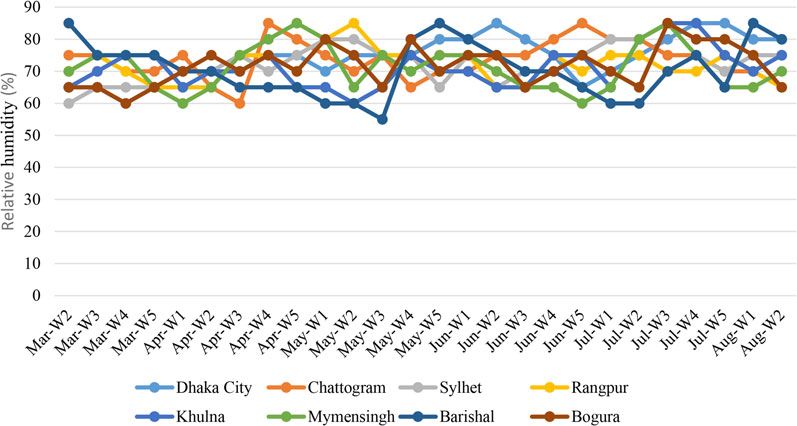
4                                                                                                                                 Nadim Sharif and Shuvra Kanti Dey

       Fig. 2. Map of the distribution of COVID-19 cases in eight different cities in Bangladesh

       Spearman’s correlation analysis between environmental data                                  maximum temperature, average temperature, UV index, relative
       and COVID-19 pandemic                                                                       humidity and wind speed) First, the correlation between max-
                                                                                                   imum temperature and the number of total cases in each city
       Spearman’s correlation analysis between metrological and                                    was evaluated. Similarly, the correlation between minimum tem-
       COVID-19 pandemic are presented in Table 2. As noted earlier,                               perature and total cases, average temperature and total cases were
       the six main environmental factors, minimum temperature, max-                               determined. Besides, correlation among three temperatures with
       imum temperature, average temperature, UV index, humidity,                                  total fatalities in each city were also determined. The average tem-
       wind speed and total population as well as population density                               perature on the day of the cases had the highest correlation (rs =
       were considered in the study. Three time frames, namely on the                              −0.675), followed by average temperature 7 days ago (rs =
       day of the positive case, 7 days ago and 14 days ago of the positive                        −0.547), maximum temperature on the day (rs = −0.512) and
       cases were selected to evaluate six factors (minimum temperature,                           minimum temperature on the day (rs = −0.486). Maximum

Downloaded from https://www.cambridge.org/core. IP address: 46.4.80.155, on 31 Jan 2021 at 07:04:24, subject to the Cambridge Core terms of use, available at https://www.cambridge.org/core/terms.
https://doi.org/10.1017/S0950268821000029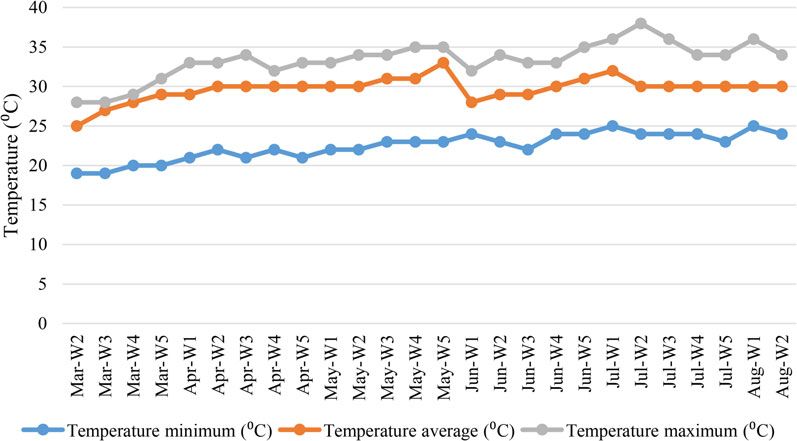
Epidemiology and Infection                                                                                                                                                     5

        Fig. 3. Weekly distribution of minimum temperature, maximum temperature and average temperature in Dhaka in Bangladesh.

        Fig. 4. Average relative humidity of the cities per week in Bangladesh.

        temperature on the day had the highest correlation with total                              were. Finally, the total population and population density of a
        fatalities (rs = −0.611). The correlation for both COVID-19                                city were highly correlated with the number of cases and fatal-
        cases and fatalities are negative, which indicates that at lower tem-                      ities in the city. The population density had the highest correl-
        perature the number of cases and fatalities increases.                                     ation with cases (rs = 0.712) and fatalities (rs = 0.678) followed
            Second, relative humidity on the day had the greater correl-                           by the total population in every city.
        ation with the number of fatalities than case number. The cor-
        relation between relative humidity and COVID-19 pandemic
        reduces with increasing time span. Third, the association                                  Spearman’s correlation analysis between metrological
        between UV index and the number of cases is the highest on                                 parameters and novel coronavirus mutation frequency
        the day of the case. Similarly, the correlation between UV
        index and the number of fatalities was the highest on the day.                             The most important aspect of novel coronavirus is its ability to
        The correlation of relative humidity and UV index with                                     undergo frequent mutations and acquire the mutations through
        COVID-19 pandemic was also negative. Fourth, among envir-                                  translation. Impact of six major metrological parameters, namely,
        onmental factors, the average wind speed on the day had the                                minimum temperature, maximum temperature, UV index, rela-
        highest correlation with the number of cases. The higher the                               tive humidity and rain as well as three host factors − coinfection,
        wind speed was, the more the number of cases and fatalities                                age and gender on mutation frequency were analysed in this

Downloaded from https://www.cambridge.org/core. IP address: 46.4.80.155, on 31 Jan 2021 at 07:04:24, subject to the Cambridge Core terms of use, available at https://www.cambridge.org/core/terms.
https://doi.org/10.1017/S0950268821000029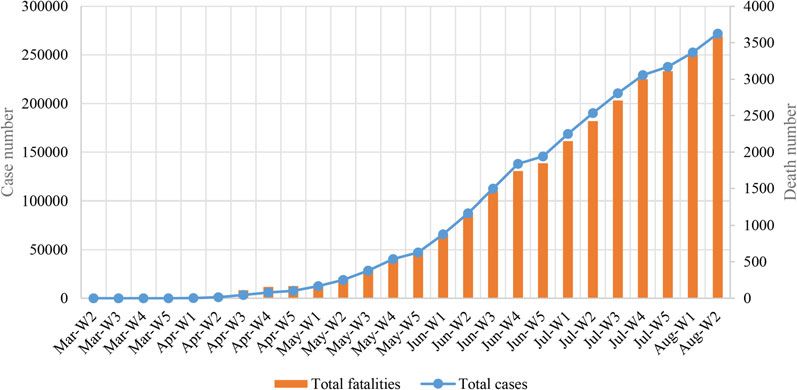
6                                                                                                                                 Nadim Sharif and Shuvra Kanti Dey

       Fig. 5. Weekly distribution of average UV index in the cities.

       Fig. 6. Weekly distribution of average wind speed in the cities.

       study. The correlation was determined for the first 100 whole gen-                         correlation (rs = 0.389) with frequency of D614G. Fourth, amount
       omes of novel coronavirus from Bangladesh. Spearman’s                                      of rainfall was also strongly correlated with frequency of D614G. All
       correlation coefficient was determined between metrological                                of the metrological factors were positively related with the frequency
       parameters and mutation frequency, as well as between host fac-                            of different mutations indicating increased temperature and UV
       tors and mutation frequency (Table 3). Important mutational                                index will favour origin of new mutations in the novel coronavirus.
       events, namely, common mutation at ORF1ab, rare mutation at                                Finally, host factors-coinfection and gender variability were also
       ORF1ab, S (D614G), rare mutation at spike protein (S), first                               positively correlated with mutation frequency. Coinfection had the
       time mutation at S, common mutation at other structural proteins                           highest association with common mutations at other structural pro-
       and rare mutations at other structural proteins were detected and                          teins (rs = 0.671) (Table 3). The age of the patients was negatively
       included in this study. Most of the novel coronaviruses (87%)                              correlated with mutational events indicating that with an increase
       were from G clade in Bangladesh. Frequency of D614G had the                                of age of the patients the mutational events decreased.
       highest correlation (rs = 0.611) with average temperature but fre-
       quency of rare mutation at spike protein had the highest correl-
                                                                                                  Frequency of mutational events, age and gender distributions
       ation (rs = 0.658) with maximum temperature. Second, UV
                                                                                                  of the cases
       index was highly correlated with frequencies of all mutational
       events and the highest correlation was detected (rs = 0.678) with                          After determining the first genome of the novel coronavirus,
       rare mutation at ORF1ab. Third, relative humidity had highest                              thousands of mutational events had occurred. Some of the

Downloaded from https://www.cambridge.org/core. IP address: 46.4.80.155, on 31 Jan 2021 at 07:04:24, subject to the Cambridge Core terms of use, available at https://www.cambridge.org/core/terms.
https://doi.org/10.1017/S0950268821000029
Epidemiology and Infection 7
Table 2. Spearman’s correlation coefficients of environmental factors and for the successful binding of host cell receptor had also undergone
COVID-19 pandemic in Bangladesh mutations with high frequency. About 82% of the isolates from
Spearman’s Spearman’s Bangladesh had D614G at S protein. Further, isolates with rare
Environmental coefficient for coefficient for and first time mutation at S proteins loop region were detected
factors COVID-19 cases COVID-19 fatalities in this study. Another two mutations, R203K and G204R at N
protein were most common (73%) in the Bangladeshi novel cor-
Maximum −0.512* −0.611*
onaviruses (Fig. 7).
temperature on the
day Among 100 patients of this study, males were the predominant
gender group (63%) followed by female patients (37%). Most of
Maximum −0.411* −0.478*
the cases (24%) were detected in the age group 30−39 years fol-
temperature 7 days
ago lowed by 19% in 20−29 years and 18% in 40−49 years, respect-
ively (Fig. 8).
Maximum −0.379 −0.411
temperature 14 days
ago Discussion
Minimum −0.486** −0.511**
temperature on the
With a moderate transmission rate, COVID-19 pandemic has
day transmitted throughout the entire world within very short time
and continued to infect people [3, 4, 31, 32]. Various metrological
Minimum −0.341 −0.374
temperature 7 days
parameters are correlated with COVID-19 pandemic [14, 20].
ago This study found very significant correlation between minimum
temperature and COVID-19 cases, average temperature and
Minimum −0.186 −0.277
temperature 14 days
COVID-19 cases, maximum temperature and COVID-19 cases,
ago which is in good agreement with previous studies of COVID-19
correlation analysis in Wuhan, New York and Jakarta in 2020
Average −0.675* −0.598*
temperature on the [14, 20, 33]. However, previous studies had reported correlation
day between average temperature and COVID-19 cases, we detected
stronger correlation between minimum temperature and
Average −0.547* −0.475*
temperature 7 days COVID-19 cases (rs = −0.486); between maximum temperature
ago and COVID-19 cases (rs = −0.512); between average temperature
and COVID-9 cases (rs = −0.675) [33, 34]. Four time frames were
Average −0.411 −0.346
temperature 14 days used to determine the correlation between metrological para-
ago meters and COVID-19 cases in a recent study, but we considered
three time frames for both the cases and fatalities [34]. Tosepu
Relative humidity on −0.399** −0.412**
the day et al. [33] did not report any significant correlation between
other metrological parameters, namely, relative humidity, rainfall,
Relative humidity 7 −0.311 −0.300
days ago
wind speed, precipitation and COVID-19 pandemic while Şahin
[34] reported significant correlation with these metrological para-
Relative humidity 14 −0.249 −0.149 meters and COVID-19 cases in Turkey. This study reported stron-
days ago
ger correlation among these metrological parameters and
UV index on the day −0.586* −0.609* COVID-19 cases/fatalities than previous study [34]. None of the
UV index 7 days ago −0.405 −0.499 previous studies reported the correlation between UV index and
COVID-19 pandemic but we detected strong correlation between
UV index 14 days −0.388** −0.389**
ago
UV index and cases (rs = −0.586)/ fatalities (rs = −0.609) [33, 34].
While considering time frames, previous study detected signifi-
Wind speed on the 0.399** 0.247** cant correlations between metrological parameters and
day
COVID-19 cases on the day of the cases except wind velocity
Wind speed 7 days 0.288* 0.189* [34]. In this study, the correlations between metrological factors
ago and cases/fatalities were also the highest on the day of cases/fatal-
Wind speed 14 days 0.134 0.099 ities including wind velocity.
ago Previous studies have reported significant correlation of coro-
Population density 0.712* 0.678* naviruses infection with metrological parameters [16, 35, 36].
High temperature can reduce the survival period of coronaviruses
Total population 0.645* 0.578*
in droplet nuclei [37]. Both laboratory and environmental studies
**, * stands for 1%, 5% level of significance. have found that above 38 °C the viability of coronaviruses are
reduced significantly [36, 37]. Another study reported that tem-
perature and relative humidity have a notable effect on the rs
mutations had made the virus more persistent, environmental value of COVID-19 cases in China [32]. Further, recent studies
resistant and more deadly. The first 100 genomes of the novel cor- have reported about significant correlation of environmental fac-
onavirus were analysed in this study. Mutations were detected tors and COVID-19 in Wuhan, New York, Turkey and Jakarta,
throughout the whole genome. The most common mutation at respectively [14, 20, 33, 34]. They specifically reported correlation
ORF1ab region were P323L (NSP12) (88%) and I120F (NSP2) of temperature and humidity with COVID-19 pandemic. In this
(72%) (Fig. 7). The most important protein, S that is necessary study, significant and stronger correlations between metrological
Downloaded from https://www.cambridge.org/core. IP address: 46.4.80.155, on 31 Jan 2021 at 07:04:24, subject to the Cambridge Core terms of use, available at https://www.cambridge.org/core/terms.
https://doi.org/10.1017/S0950268821000029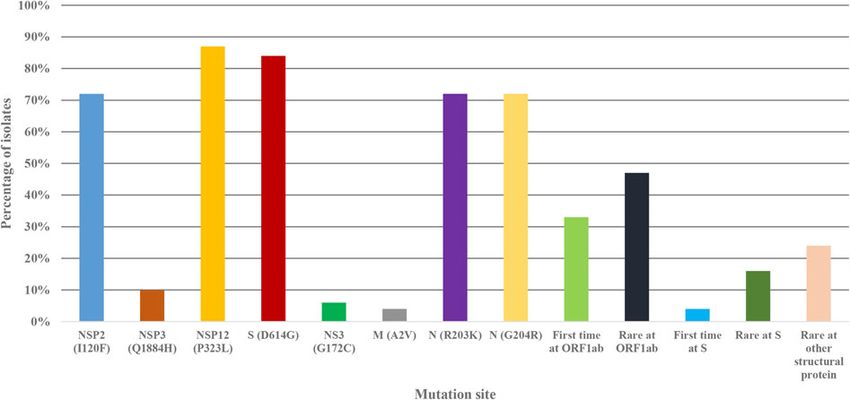
8                                                                                                                                 Nadim Sharif and Shuvra Kanti Dey

       Table 3. Spearman’s correlation coefficients of environmental factors, host factors and frequency of mutation in Bangladesh

                                                                                                     Mutation site

                                     Common at              Rare at              S            Rare at         First time          Common at other                  Rare at other
           Factors                    ORF 1ab               ORF 1ab           (D614G)            S               at S             structural proteins           structural proteins

           Minimum                       0.449                 0.412            0.411           0.354            0.114                    0.456                         0.389
           temperature
           Average                       0.654                 0.598            0.611           0.547            0.451                    0.446                         0.510
           temperature
           Maximum                       0.588                 0.499            0.364           0.658            0.398                    0.384                         0.460
           temperature
           UV index                      0.643                 0.678            0.577           0.504            0.614                    0.514                         0.460
           Relative                      0.312                 0.245            0.389           0.016            0.341                    0.277                         0.206
           humidity
           Rain                          0.423                 0.319            0.412           0.298            0.170                    0.354                         0.116
           Coinfection                   0.485                 0.642            0.644           0.546            0.542                    0.671                         0.406
           Gender                        0.365                 0.114            0.012           0.412            0.398                    0.421                         0.164
           Age                          −0.396               −0.315            −0.226          −0.194           −0.311                  −0.105                         −0.146

       Fig. 7. Frequency of mutations at different site in the Bangladeshi novel coronavirus genome.

       Fig. 8. Age and gender distribution of the COVID-19
       patients in Bangladesh.

Downloaded from https://www.cambridge.org/core. IP address: 46.4.80.155, on 31 Jan 2021 at 07:04:24, subject to the Cambridge Core terms of use, available at https://www.cambridge.org/core/terms.
https://doi.org/10.1017/S0950268821000029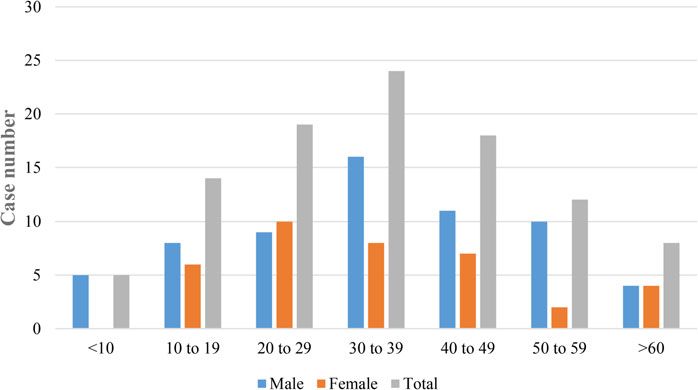
Epidemiology and Infection                                                                                                                                                     9

        factors and COVID-19 cases/fatalities were detected which is in                            between metrological parameters and COVID-19 fatalities; first
        good agreement with previous studies. Previous studies had reported                        time correlation between metrological factors and frequency of
        the effects of UV index on the viability of coronaviruses, namely,                         mutations in novel coronaviruses; first time correlation between
        SARS-CoV and MERS-CoV [38, 39]. This study has also reported                               host factors and frequency of mutation. This study also provided
        significant correlation between UV index and COVID-19 cases/fatal-                         the mutation frequency at different sites of novel coronaviruses. A
        ities which is in good agreement with previous studies [38, 39].                           complete picture on the effect of metrological parameters on
            Şahin [34] detected a strong correlation (rs = 0.687) between                          COVID-19 pandemic and novel coronavirus mutation frequency
        total population and COVID-19 cases in Turkey. However, this                               has been depicted in this study. This study will work as a baseline
        study includes both the total population and population density                            for the future studies focusing on the environmental and host fac-
        for COVID-19 cases and fatalities. This study reported stronger                            tors affecting the COVID-19 pandemic. Further, this study will
        correlation between total population and cases (rs = 0.645) /fatal-                        work as a guideline for future studies by containing important
        ities (rs = 0.578); between population density and cases (rs =                             information on environmental and host factors impact on muta-
        0.712) /fatalities (rs = 0.678) than previous study [34].                                  tions of coronaviruses.
            Mutational events are most important aspects for novel cor-                               Other factors like duration of lockdown, mobility of huge
        onavirus infection, transmission and persistence in the host                               number of workers, social and religious gatherings, not using
        cells. Mutations at spike proteins can create difficulties to develop                      masks, movement of people during vacations, lack of proper
        effective vaccine or therapeutics against novel coronaviruses [9,                          detection of COVID-19 patients etc. are significantly affecting
        29, 30]. While analysing the first 100 full genome sequences of                            the pandemic. If direct contact is not avoided, social distance
        novel coronaviruses in Bangladesh, this study detected a diverse                           and personal hygiene are not maintained, environmental factors
        frequency of mutations at various sites. These mutational events                           cannot control the COVID-19 pandemic alone. This study
        can lead to persistent, deadly, immune-tolerant and environment-                           describes high frequency of common and rare mutations in the
        tolerant isolates. Previous studies have already addressed the                             novel coronavirus genome in Bangladesh. Circulation of these
        effects of mutations on COVID-19 pandemic [40, 41]. This                                   mutants will certainly increase the duration of the pandemic
        study reported common mutations at ORF1ab-P323L (NSP12)                                    and reduce the effectiveness of vaccine or therapeutics in future.
        (88%) and I120F (NSP2) (72%); S-D614G (82%), N-R203K                                       The main limitation of this study is the variation of case number.
        (73%) and G204R (73%) and other structural proteins with                                   The actual case and fatality number may vary slightly due to the
        high frequency. Of note, significant rare and new mutations                                lack of complete diagnosis of the population. In future, studies
        were also detected at ORF1ab (48% and 33%) S (17% and 4%)                                  including more isolates of viruses, large number of clinical data
        and N (20%) sites with high frequency. Frequency of mutational                             and environmental data of longer periods can predict more accur-
        events were higher than previous reports [40, 41]. We analysed                             ate effects of various factors on COVID-19.
        both gender distribution and age distribution of the cases. This
        study reported the most common patients being male (63%)
        and of age group 30−39 years was the most infected (24%), fol-                             Conclusion
        lowed by 20−29 years (19%) and 40−49 years (18%), respectively.
                                                                                                   To the best of our knowledge, this is the first study reporting cor-
        Both the gender and age distribution of cases in Bangladesh were
                                                                                                   relation of environmental factors with COVID-19 pandemic in
        different from previous studies [1, 7].
                                                                                                   three time frames in Bangladesh with temperature about 27 °C.
            This study determined the correlation between metrological
                                                                                                   The strongest correlations between metrological factors and
        parameters and mutational frequency of novel coronaviruses for
                                                                                                   COVID-19 cases/fatalities were specified on the day of cases/fatal-
        the first time. This study included both metrological parameters
                                                                                                   ities. The highest correlation was detected between population
        and host factors to determine correlation with frequency of muta-
                                                                                                   density and cases followed by total population and cases indicat-
        tions. Studies have found significant effects of environmental fac-
                                                                                                   ing the mobility and crowd are actively increasing the cases and
        tors and UV radiation on the frequency of mutation of influenza
                                                                                                   fatalities. For the first time, this study describes the effects of
        virus and Newcastle disease virus [42, 43]. This study reported
                                                                                                   metrological parameters on the frequency of mutation at different
        strong correlation between average temperature and mutation fre-
                                                                                                   sites in novel coronavirus. Both temperature and UV index had
        quency at ORF1ab-common mutation (rs = 0.654), rare mutation
                                                                                                   strong effects on different mutation events. Among host factors,
        (rs = 0.598) and at S- D614G (rs = 0.611); between maximum tem-
                                                                                                   coinfection also affected different mutations strongly. Including
        perature and rare mutation at S (rs = 0.658). Among other metro-
                                                                                                   COVID-19 cases, fatalities, mutations, mutation frequency and
        logical factors, UV index had the highest correlation with
                                                                                                   clinical data this study provides a complete picture of the
        frequency of mutations at every site in the genome. Among
                                                                                                   COVID-19 pandemics and environmental effects on this pan-
        host factors, coinfections had strong correlation with frequency
                                                                                                   demic. This study will provide useful implications about
        of mutations at ORF1ab- common mutation (rs = 0.485), rare
                                                                                                   COVID-19 pandemic and both for policy makers and public to
        mutation (rs = 0.642), at S-D614G (rs = 0.644) and common
                                                                                                   take decision to reduce the health burden of this outbreak.
        mutation at other protein (rs = 0.671). Both age and gender had
        significant correlation with frequency of mutations at many                                Financial support statement. This research did not receive any specific
        sites of the genome. As of 18 August 2020 no other study has                               grant from funding agencies in the public, commercial or not-for-profit
        described the correlation between metrological parameters/host                             sectors.
        factors and frequency of mutations in novel coronaviruses.
        However, for other viruses like influenza and Newcastle disease                            Conflict of interest. The authors declare that they have no known compet-
                                                                                                   ing financial interests or personal relationships that could have appeared to
        viruses there are reports of environmental and host factors asso-
                                                                                                   influence the work reported in this paper.
        ciation with the virus mutations [42, 43].
            This study has described the highest correlation between                               Data availability statement. Restrictions apply to the availability to the
        metrological parameters and COVID-19 cases; strong correlation                             data that support the findings of this study.

Downloaded from https://www.cambridge.org/core. IP address: 46.4.80.155, on 31 Jan 2021 at 07:04:24, subject to the Cambridge Core terms of use, available at https://www.cambridge.org/core/terms.
https://doi.org/10.1017/S0950268821000029
10 Nadim Sharif and Shuvra Kanti Dey
References 22. Bashir MF et al. (2020) Environmental pollution and COVID-19
outbreak: insights from Germany. Air Quality. Atmosphere & Health 13,
1. Chen N et al. (2020) Epidemiological and clinical characteristics of 99 1385–1394.
cases of 2019 novel coronavirus pneumonia in Wuhan, China: a descrip- 23. Bashir MF, Benjiang MA and Shahzad L (2020) A brief review of
tive study. The Lancet 395, 507–513. socio-economic and environmental impact of Covid-19. Air Quality,
2. Cui J, Li F and Shi ZL (2019) Origin and evolution of pathogenic coro- Atmosphere & Health 13, 1403–1409. https://doi.org/10.1007/s11869-
naviruses. Nature Reviews Microbiology 17, 181–192. 020-00894-8.
3. Peeri NC et al. (2020) The SARS, MERS and novel coronavirus 24. Collivignarelli MC et al. (2020) Lockdown for CoViD-2019 in Milan:
(COVID-19) epidemics, the newest and biggest global health threats: what are the effects on air quality? Science of the Total Environment 732,
what lessons have we learned? International Journal of Epidemiology 49, 139280.
717–726. https://doi.org/10.1093/ije/dyaa033. 25. World Health Organization (2020b) Coronavirus disease 2019
4. World Health Organization (2020a) Coronavirus Disease 2019 (COVID-19) Bangladesh Situation Report-25. Retrieved from https://
(COVID-19) Situation Report–209. Retrieved from https://www.who.int/ www.who.int/bangladesh/emergencies/coronavirus-disease-(covid-19)-
docs/default-source/coronaviruse/situation-reports/20200816-covid-19- update/coronavirus-disease-(covid-2019)-bangladesh-situation-reports.
sitrep-209.pdf?sfvrsn=5dde1ca2_2. 26. Rahman MM et al. (2020) Ganges-Brahmaputra-Meghna Delta,
5. Rajgor DD et al. (2020) The many estimates of the COVID-19 case fatal- Bangladesh and India: a transnational mega-delta. In Deltas in the
ity rate. The Lancet Infectious Diseases 20, 776–777. doi: https://doi.org/ Anthropocene. Palgrave Macmillan, Cham, pp. 23–51.
10.1016/S1473-3099(20)30244-9. 27. Kim TJ (2018) Prevention of avian influenza virus by ultraviolet radiation
6. Onder G, Rezza G and Brusaferro S (2020) Case-fatality rate and char- and prediction of outbreak by satellite parameters. Journal of Biomedical
acteristics of patients dying in relation to COVID-19 in Italy. JAMA 323, Science and Engineering 11, 182.
1775–1776. doi: 10.1001/jama.2020.4683. 28. Zhang X et al. (2020) Viral and host factors related to the clinical out-
7. Huang C et al. (2020) Clinical features of patients infected with 2019 come of COVID-19. Nature 583, 437–440.
novel coronavirus in Wuhan, China. The Lancet 395, 497–506. 29. Volz E et al. (2020) Evaluating the effects of SARS-CoV-2 spike mutation
8. Lescure FX et al. (2020) Clinical and virological data of the first cases of D614G on transmissibility and pathogenicity. Cell 184, 64–75. https://
COVID-19 in Europe: a case series. The Lancet Infectious Diseases 20, doi.org/10.1016/j.cell.2020.11.020.
697–706. https://doi.org/10.1016/S1473-3099(20)30200-0. 30. Yao HP et al. (2020) Patient-derived mutations impact pathogenicity of
9. Lu R et al. (2020) Genomic characterisation and epidemiology of 2019 SARS-CoV-2. CELL-D-20-01124. Available at SSRN http://dx.doi.org/10.
novel coronavirus: implications for virus origins and receptor binding. 2139/ssrn.3578153.
The Lancet 395, 565–574. 31. Cucinotta D and Vanelli M (2020) WHO Declares COVID-19 a pan-
10. Vandini S et al. (2020) Respiratory syncytial virus infection in infants and demic. Acta Bio-medica: Atenei Parmensis 91, 157–160.
correlation with meteorological factors and air pollutants. Italian Journal 32. Wang C et al. (2020) A novel coronavirus outbreak of global health con-
of Pediatrics 39, 1. cern. The Lancet 395, 470–473.
11. Nickbakhsh S et al. (2020) Epidemiology of seasonal coronaviruses: estab- 33. Tosepu R et al. (2020) Correlation between weather and Covid-19 pan-
lishing the context for COVID-19 emergence. The Journal of Infectious demic in Jakarta, Indonesia. Science of the Total Environment 725,
Diseases 222, 17–25. https://doi.org/10.1093/infdis/jiaa185. 138436. https://doi.org/10.1016/j.scitotenv.2020.138436.
12. Sharif N et al. (2020) Molecular and epidemiological trends of human 34. Şahin M (2020) Impact of weather on COVID-19 pandemic in Turkey.
bocavirus and adenovirus in children with acute gastroenteritis in Science of the Total Environment 728, 138810. https://doi.org/10.1016/
Bangladesh during 2015 to 2019. Journal of Medical Virology 92, 3194– j.scitotenv.2020.138810.
3201. https://doi.org/10.1002/jmv.25812. 35. Sajadi MM et al. Temperature and latitude analysis to predict potential
13. Shek LP and Lee BW (2020) Epidemiology and seasonality of respiratory spread and seasonality for COVID-19. Available at SSRN 3550308.
tract virus infections in the tropics. Paediatric Respiratory Reviews 4, 105–111. https://dx.doi.org/10.2139/ssrn.3550308.
14. Bashir MF et al. (2020) Correlation between climate indicators and 36. Rabenau HF et al. (2020) Stability and inactivation of SARS coronavirus.
COVID-19 pandemic in New York, USA. Science of The Total Environment Medical Microbiology and Immunology 194, 1–6.
728, 138835 . https://doi.org/10.1016/j.scitotenv.2020.138835. 37. Chan K et al. (2011) The effects of temperature and relative humidity on
15. Casanova LM et al. (2010) Effects of air temperature and relative humid- the viability of the SARS coronavirus. Advances in Virology 2011, 1–
ity on coronavirus survival on surfaces. Applied and Environmental 7. https://doi.org/10.1155/2011/734690.
Microbiology 76, 2712–2717. doi: 10.1128/AEM.02291-09. 38. Duan SM et al. (2003) Stability of SARS coronavirus in human specimens
16. Tan J et al. (2005) An initial investigation of the association between the and environment and its sensitivity to heating and UV irradiation.
SARS outbreak and weather: with the view of the environmental temperature Biomedical and Environmental Sciences: BES 16, 246–255.
and its variation. Journal of Epidemiology & Community Health 59, 186–192. 39. Van Doremalen N, Bushmaker T and Munster V (2013) Stability of
17. Guo YR et al. (2020) The origin, transmission and clinical therapies on Middle East respiratory syndrome coronavirus (MERS-CoV) under differ-
coronavirus disease 2019 (COVID-19) outbreak − an update on the status. ent environmental conditions. Eurosurveillance 18, 20590.
Military Medical Research 7, 1. 40. Stefanelli P et al. (2020) Whole genome and phylogenetic analysis of two
18. White MS, Omer M and Mohammad GN (2020) Knowledge, attitude SARS-CoV-2 strains isolated in Italy in January and February 2020: add-
and practice on prevention of airborne and droplet infections during itional clues on multiple introductions and further circulation in Europe.
the outbreak of corona virus among the college students in University Eurosurveillance 25, 2000305.
of Bisha, Saudi Arabia. International Journal of Contemporary Research 41. Pachetti M et al. (2020) Emerging SARS-CoV-2 mutation hot spots
and Review 11, 20773–20776. include a novel RNA-dependent-RNA polymerase variant. Journal of
19. Yuan J et al. (2006) A climatologic investigation of the SARS-CoV outbreak Translational Medicine 18, 1–9.
in Beijing, China. American Journal of Infection Control 34, 234–236. 42. Jiang D et al. (2020) Could environment affect the mutation of H1N1
20. Zhu Y and Xie J (2020) Association between ambient temperature and influenza virus? International Journal of Environmental Research and
COVID-19 infection in 122 cities from China. Science of the Total Public Health 17, 3092.
Environment 724, 138201 . https://doi.org/10.1016/j.scitotenv.2020.138201. 43. Peeples ME and Bratt MA (1982) UV irradiation analysis of comple-
21. Bahl P et al. (2020) Airborne or droplet precautions for health workers mentation between, and replication of, RNA-negative temperature-
treating COVID-19? The Journal of Infectious Diseases, jiaa189. https:// sensitive mutants of Newcastle disease virus. Journal of Virology 41,
doi.org/10.1093/infdis/jiaa189. 965–973.
Downloaded from https://www.cambridge.org/core. IP address: 46.4.80.155, on 31 Jan 2021 at 07:04:24, subject to the Cambridge Core terms of use, available at https://www.cambridge.org/core/terms.
https://doi.org/10.1017/S0950268821000029You can also read