"Warm cover": precursory strong signals for haze pollution hidden in the middle troposphere
←
→
Page content transcription
If your browser does not render page correctly, please read the page content below
Atmos. Chem. Phys., 21, 14131–14139, 2021
https://doi.org/10.5194/acp-21-14131-2021
© Author(s) 2021. This work is distributed under
the Creative Commons Attribution 4.0 License.

“Warm cover”: precursory strong signals for haze pollution hidden
in the middle troposphere
Xiangde Xu1 , Wenyue Cai1,2,3 , Tianliang Zhao4 , Xinfa Qiu5 , Wenhui Zhu6 , Chan Sun1 , Peng Yan7 , Chunzhu Wang8 ,
and Fei Ge9
1 State Key Laboratory of Severe Weather (LASW), Chinese Academy of Meteorological Sciences, Beijing, China
2 National Climate Center, China Meteorological Administration, Beijing, China
3 School of Geographical Science, Nanjing University of Information Science and Technology,

Nanjing, Jiangsu Province, China
4 Key Laboratory for Aerosol-Cloud-Precipitation of China Meteorological Administration, Nanjing University of Information

Science and Technology, Nanjing, Jiangsu Province, China
5 School of Applied Meteorology, Nanjing University of Information Science and Technology,

Nanjing, Jiangsu Province, China
6 Beijing Institute of Applied Meteorology, Beijing, China
7 Meteorological Observation Center, China Meteorological Administration, Beijing, China
8 Training Center, China Meteorological Administration, Beijing, China
9 School of Atmospheric Sciences/Plateau Atmosphere and Environment Key Laboratory of Sichuan Province/Joint

Laboratory of Climate and Environment Change, Chengdu University of Information Technology,
Chengdu, Sichuan Province, China

Correspondence: Wenyue Cai (caiwy@cma.gov.cn) and Tianliang Zhao (tlzhao@nuist.edu.cn)

Received: 1 November 2020 – Discussion started: 5 January 2021
Revised: 26 July 2021 – Accepted: 3 August 2021 – Published: 23 September 2021

Abstract. Eastern China (EC), located in the downstream re-       the TP’s heat source and the warm cover strong signal in the
gion of the Tibetan Plateau (TP), is a large area with frequent   middle troposphere over EC. The warming TP could lead to
haze pollution. In addition to air pollutant emissions, meteo-    anomalous warm cover in the middle troposphere from the
rological conditions are a key inducement for air pollution       plateau to the downstream EC region and even the entire East
episodes. Based on the study of the Great Smog of Lon-            Asian region, thus causing frequent winter haze pollution in
don in 1952 and haze pollution in EC over recent decades,         EC region.
it is found that the abnormal “warm cover” (air–temperature
anomalies) in the middle troposphere, as a precursory strong
signal, could be connected to severe air pollution events. The
convection and vertical diffusion in the atmospheric bound-       1   Introduction
ary layer (ABL) were suppressed by a relatively stable struc-
ture of warm cover in the middle troposphere leading to ABL       In China, mainly over the region east of 100◦ E and south
height decreases, which were favorable for the accumula-          of 40◦ N (Tie et al., 2009), PM2.5 (particulate matter with
tion of air pollutants in the ambient atmosphere. The anoma-      an aerodynamic diameter equal to or less than 2.5 µm) has
lous structure of the troposphere’s warm cover not only exist     become the primary air pollutant in winter (Wang et al.,
in heavy haze pollution on the daily scale, but also provide      2017). Therefore, in September 2013, the Chinese gov-
seasonal, interannual and interdecadal strong signals for fre-    ernment launched China’s first air pollution control action
quently occurring regional haze pollution. It is revealed that    plan, “The Airborne Pollution Prevention and Control Ac-
a close relationship existed between interannual variations of    tion Plan (2013–2017)” (State Council of the People’s Re-
                                                                  public of China, 2013). By 2017, about 64 % of China’s

Published by Copernicus Publications on behalf of the European Geosciences Union.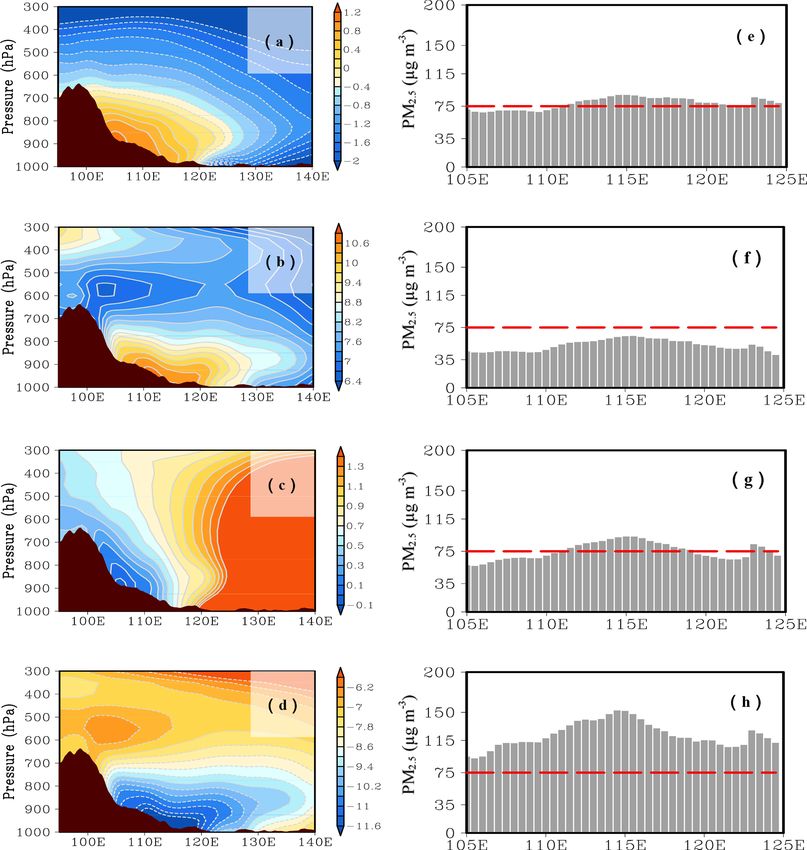
14132                                             X. Xu et al.: “Warm cover”: precursory strong signals for haze pollution

cities were still suffering from air pollution, especially the    Table 1. Air pollution degrees categorized with surface PM2.5 con-
Beijing–Tianjin–Hebei region and surrounding areas (Wang          centrations.
et al., 2019; Miao et al., 2019). Then, in July 2018, the
Chinese government launched the second three-year action            Air pollution degrees    PM2.5 concentration ranges
plan for air pollution control, the “Blue Sky Protection Cam-       Less serious pollution   75 µg m−3 < PM2.5 ≤ 115 µg m−3
paign”, which demonstrates China’s firm determination and           Serious pollution        115 µg m−3 < PM2.5 ≤ 150 µg m−3
new measures for air pollution control (State Council of the        More serious pollution   150 µg m−3 < PM2.5 ≤ 250 µg m−3
People’s Republic of China, 2018). After the implementation         Most serious pollution   PM2.5 > 250 µg m−3
of air pollution control action plans, air quality in many re-
gions of China has been significantly improved.
   Anthropogenic pollutant emissions and unfavorable mete-        Protection (NCEP, https://www.esrl.noaa..gov/, last access:
orological conditions are commonly regarded as two key fac-       31 December 2019).
tors for air pollution (Ding and Liu, 2014; Yim et al., 2014;        The daily and monthly ERA-Interim and ERA-20C re-
Zhang et al., 2015). Air pollutants mainly come from surface      analysis data of meteorology with horizontal resolution of
emission sources, and most of the air pollutants are injected     0.75◦ were derived from the European Center for Medium
from the surface to the atmosphere through the atmospheric        range Weather Forecasts (ECMWF, https://www.ecmwf.int/,
boundary layer (ABL) (Quan et al., 2020). The ABL struc-          last access: 31 May 2019), including air temperature, geopo-
tures are the key meteorological conditions that influence the    tential height, humidity, wind field and vertical velocity.
formation and maintenance of heavy air pollution episodes            The hourly PM2.5 concentration data from 2013–2019
(Wang et al., 2015, 2016, 2019; Cheng et al., 2016; Tang          were collected from the national air quality monitoring net-
et al., 2016).                                                    work operated by the Ministry of Ecology and Environment
   Most previous studies focused on exploring the impact on       of the People’s Republic of China (http://www.mee.gov.cn/,
heavy air pollution in eastern China (EC) from the meteoro-       last access: 31 December 2019). In addition, we categorized
logical conditions in the ABL. However, the thermodynamic         air pollution levels with the surface PM2.5 concentrations
and dynamic structures of the free troposphere can affect the     based on the National Ambient Air Quality Standards of
meteorological conditions in the ABL (Cai et al., 2020). The      China (HJ633–2012) released by the Ministry of Ecology
convection and diffusion in the ABL are suppressed by a rel-      and Environment in 2012 (China Ministry of Environmental
atively stable structure in the middle troposphere, leading to    Protection, 2012) as shown in Table 1.
ABL height decreases, which were favorable for the forma-            We also used the monthly air temperature of surface ob-
tion and persistence of heavy air pollution (Quan et al., 2013;   servation data from 1960–2014 from 58 meteorological ob-
Wang et al., 2015; Cai et al., 2020).                             servation stations in the plateau area with an altitude above
   This study investigated whether the thermodynamic struc-       3000 m as well as the monthly haze days of surface obser-
ture of the troposphere and its intensity changes can be used     vation data from 1960–2018, which were archived from the
as a strong warning signal for the changes in PM2.5 concen-       China Meteorological Information Center (http://data.cma.
trations in heavy air pollution and whether this strong sig-      cn/, last access: 31 December 2019).
nal exists on the timescales of seasonal, interannual and in-        Furthermore, the L-band sounding seconds level data of
terdecadal changes. In order to explore the interaction be-       Beijing from 2010 to 2019 to were used to calculate the
tween the free troposphere and the ABL and the impact on          height of the ABL (Liu and Liang, 2010). The height of the
the heavy air pollution in EC, this study extended the meteo-     ABL top is characterized by the L-band sounding observa-
rological conditions for heavy air pollution from the bound-      tions at 20:00 (local time is used for this paper). The L-band
ary layer to the middle troposphere. We identify precursory       sounding seconds level data have undergone quality control
strong signals for frequent winter haze pollution hidden in       before analysis (Zhu et al., 2018) and interpolation was im-
the free troposphere in EC.                                       plemented in a vertical direction at an interval of 2 hPa. The
                                                                  L-band detection data provided by the China Meteorological
                                                                  Information Center (http://data.cma.cn/, last access: 31 De-
2   Data and methods                                              cember 2019) contains several automatic observation meteo-
                                                                  rological elements with a time resolution of 1.2 s and vertical
The data used in this study included NCEP/NCAR, ERA-              resolution of 8 m. More detailed information can be found in
Interim and ERA-20C reanalysis data of meteorology, as            Li et al. (2009) and Cai et al. (2014).
well as data from surface PM2.5 concentration measure-
ments, haze days observations, air temperature observations
and L-band soundings, as briefly described below.
   The monthly NCEP/NCAR reanalysis data of meteorol-
ogy with horizontal resolution of 2.5◦ from 1960–2019 were
obtained from the U.S. National Center for Environmental

Atmos. Chem. Phys., 21, 14131–14139, 2021                                          https://doi.org/10.5194/acp-21-14131-2021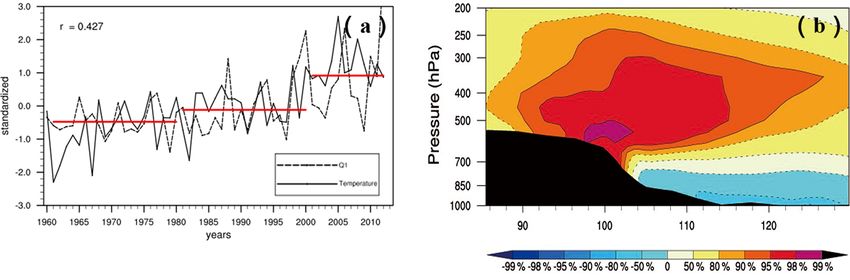
X. Xu et al.: “Warm cover”: precursory strong signals for haze pollution 14133
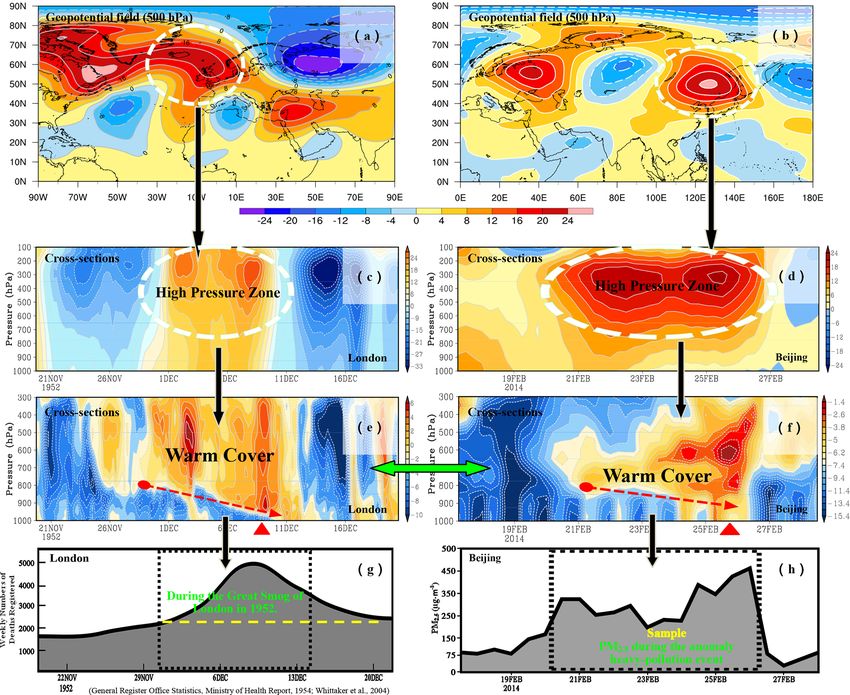
Figure 1. Dynamical and thermodynamical structures and air pollution variations. (a) Geopotential height anomalies (unit: dagpm) at 500 hPa
from 5–9 December 1952 during the Great Smog of London. (b) The same as (a) but from 21–26 February 2014. (c) Time-vertical cross
sections of the geopotential height anomalies (unit: dagpm) in the high pressure area (50–70◦ N; 20◦ W–10◦ E) from 20 November to
20 December 1952. (d) The same as (c) but in the high pressure area (40–63◦ N; 115–138◦ E) from 17–28 February 2014. (e) Time-vertical
cross sections of air temperature anomalies (unit: ◦ C) over London (the red dotted arrow shows the bottom edge of the warm cover during the
Great Smog in London) from 20 November to 20 December 1952. (f) The same as (e) but during the heavy pollution in February 2014 over
Beijing. (g) Weekly death rate in London prior to, during and after the 1952 pollution episode (General Register Office Statistics, Ministry of
Health Report, 1954; Whittaker et al., 2004). (h) The variation of surface PM2.5 concentrations (units: µg m−3 ) during the heavy pollution
in February 2014 over Beijing.
3 Results (Whittaker et al., 2004). To find the precursory strong signals
for heavy air pollution events hidden in meteorology, we re-
3.1 A precursory strong signal of warm cover in the trieved the three-dimensional atmospheric dynamic and ther-
middle troposphere mal structures during December 1952 as well as February
2014 by analyzing vertical anomalies of meteorology. There
In February 2014, a rare persistent air pollution weather pro- were high-pressure systems moving into London as well as
cess occurred in EC with severe air pollution in more than 50 Beijing that stagnated over both areas at 500 hPa geopoten-
cities with an impact area of 2.07 million km2 . In the Beijing tial height anomalies, as shown in Fig. 1a and b. During the
area from 20–26 February 2014, the regional average PM2.5 heavy air pollution events, a high-pressure system over Lon-
concentration exceed the most serious air pollution level with don as well as Beijing gradually strengthened (Fig. 1c and
a peak value of up to 456 µg m−3 . In addition, the Great Smog d) and the middle troposphere was characterized by a “warm
of London in 1952 was attributed to long-lasting and heavy
haze pollution under the influence of certain weather systems
https://doi.org/10.5194/acp-21-14131-2021 Atmos. Chem. Phys., 21, 14131–14139, 2021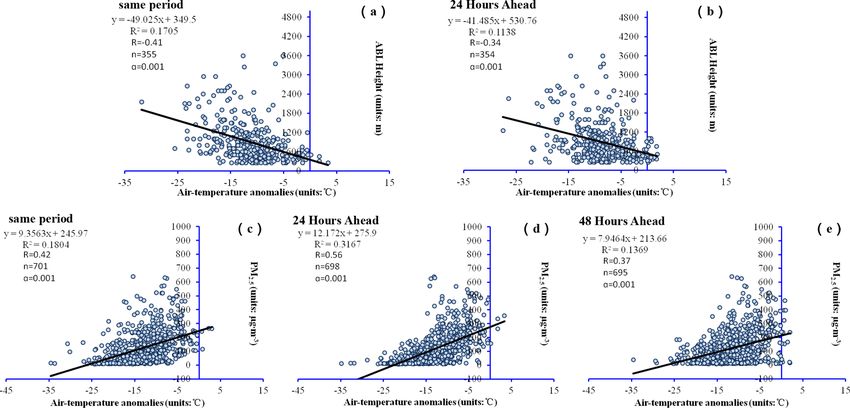
14134                                              X. Xu et al.: “Warm cover”: precursory strong signals for haze pollution

Figure 2. The correlations between ABL height and air temperature anomalies in Beijing during winters from 2014–2017 (a) in the same
period at 800 hPa and (b) 24 h ahead at 650 hPa. The correlations between PM2.5 concentration and air temperature anomalies in Beijing
during winters from 2014–2017 (c) in the same period at 850 hPa, (d) 24 h ahead at 800 hPa and (e) 48 h ahead at 724 hPa.

cover” with upper warming and bottom cooling anomalies in            3.2   Effect of warm cover in the free troposphere on the
the vertical structure of air temperature (Fig. 1e and f).                 ABL and surface PM2.5 variations
   By comparing Fig. 1a and b, we found that two persistent
heavy air pollution events occurred during the maintenance           During five heavy air pollution episodes over Beijing in De-
stage of stable high pressure system. During stagnation of the       cember 2015 and 2016 the vertical structures of air tempera-
blocking high pressure system, the strength of the center of         ture anomalies presented the warm cover structure in the free
the geopotential height anomalies in the stable maintenance          troposphere (see Fig. S1 in the Supplement). During winter
region of the blocking exhibited a synchronous response to           2014–2017, Fig. 2a and b demonstrated the significant nega-
the warm cover above areas (Fig. 1c–f). It can be seen that          tive correlations between the height of the ABL and air tem-
the local atmospheric thermal structure is significantly modu-       perature anomalies over same period and 24 h ahead in Bei-
lated by the persistent large-scale anomalous circulation. The       jing. The correlation coefficients were 0.41 and 0.34 (99.9 %
subsidence-induced air temperature inversion effect of the           confidence level), reflecting that the warm cover structure
blocking high pressure system continuously strengthened the          hidden in the middle troposphere with significant strong-
warm cover structure in the middle troposphere, which sup-           signal features is of persistent premonitory significance for
pressed the vertical diffusion capacity in the atmosphere (Cai       the heavy pollution episodes. Figure 2c–e presented the sig-
et al., 2020). Moreover, it was obvious that strong signals          nificant positive correlations between PM2.5 concentrations
arising from the thick warm cover persisted during the abnor-        and air temperature anomalies over same period and 24 and
mal air-pollution episode from 5–9 December 1952 in Lon-             48 h ahead in Beijing. The correlation coefficients were 0.42,
don as well as 21–26 February 2014 in Beijing. It is worth           0.56 and 0.37 (99.9 % confidence level). Based on the above
pointing out that the bottom edge of warm cover in the free          mentioned results, air temperature anomalies over 24 and
troposphere declined day by day. During the heavy pollution          48 h ahead could also reflect that warm cover hidden in
incident, the warm cover dropped to 900 hPa (Fig. 1g and h).         the middle troposphere could be regarded as the precursory
The above analysis shows that in the ABL over London from            strong signal for air pollution change. Furthermore, such a
5–9 December 1952 and Beijing from 21–26 February 2014,              stable structure also restricted the vertical transport of moist
the inversion layer height decreased, which made the ABL             air from the lower to the middle troposphere for forming sec-
structure stable for accumulation of air pollutants. The deep        ondary aerosols, which could dominate PM2.5 concentrations
warm cover structures in the middle troposphere acted as a           in air pollution over China (Huang et al., 2014; Tan et al.,
precursory strong signal of the Great Smog of London and             2015).
Beijing’s heavy air pollution.

Atmos. Chem. Phys., 21, 14131–14139, 2021                                             https://doi.org/10.5194/acp-21-14131-2021
X. Xu et al.: “Warm cover”: precursory strong signals for haze pollution 14135
Figure 3. Vertical cross sections of (a–d) air temperature anomalies (unit: ◦ C) and (e–h) the PM2.5 concentrations (unit: µg m−3 ) averaged
along 25–40◦ N in spring (a, e), summer (b, f), autumn (c, g) and winter (d, h) from 2013 to 2018.
3.3 Changes of the warm cover structure in the middle warming and bottom cooling in the middle troposphere ap-
troposphere peared from the plateau to downstream EC region and even
the entire East Asian region (Fig. 3d). The structure of warm
The warm cover structure of air temperature anomalies in the cover in winter was much stronger than that in autumn, and
middle troposphere indicated the intensification of heavy air its height of the former was much lower than that of the lat-
pollution. The warm cover structure is a precursory strong ter. Therefore, the intensity of air pollution over EC during
signal for the frequent occurrence of regional haze events. winter is significantly higher than other seasons (Fig. 3h).
The air pollution in EC exhibited significant seasonal vari- From the perspective of interdecadal variations, our study
ations. Our study revealed seasonal differences of the ther- revealed a close relationship between the frequent occurrence
mal structures in the atmosphere over EC. In spring (Fig. 3a of haze events in EC and the atmospheric thermal structure
and e) and summer (Fig. 3b and f), the middle troposphere in the eastern Tibetan Plateau (TP). Furthermore, the thermal
was characterized by an upper cooling and bottom warm- structures of the troposphere exhibited distinct interdecadal
ing vertical structure for less air pollution. When the au- variations (Fig. 4a–c). A cooling structure was identified in
tumn (Fig. 3c and g) and winter (Fig. 3d and h) arrived, the wintertime air temperature anomalies over the eastern re-
the middle troposphere was characterized by an upper warm- gion of the TP from 1961–1980 (Fig. 4a); the upper level
ing and bottom cooling vertical structure, which intensified of the eastern TP from 1981–2000 showed an upper cooling
the air pollution. In autumn, atmospheric thermal structure and bottom warming vertical structure (Fig. 4b). The inter-
over EC was marked with a transition between summer and decadal changes of vertical structure reversed from 2001–
winter (Fig. 3c). The atmosphere condition reversed in win- 2018 with a significant warm cover (Fig. 4c). The years
ter, a large-scale anomalous air temperature pattern of upper 2001–2018 witnessed the highest frequency of haze days
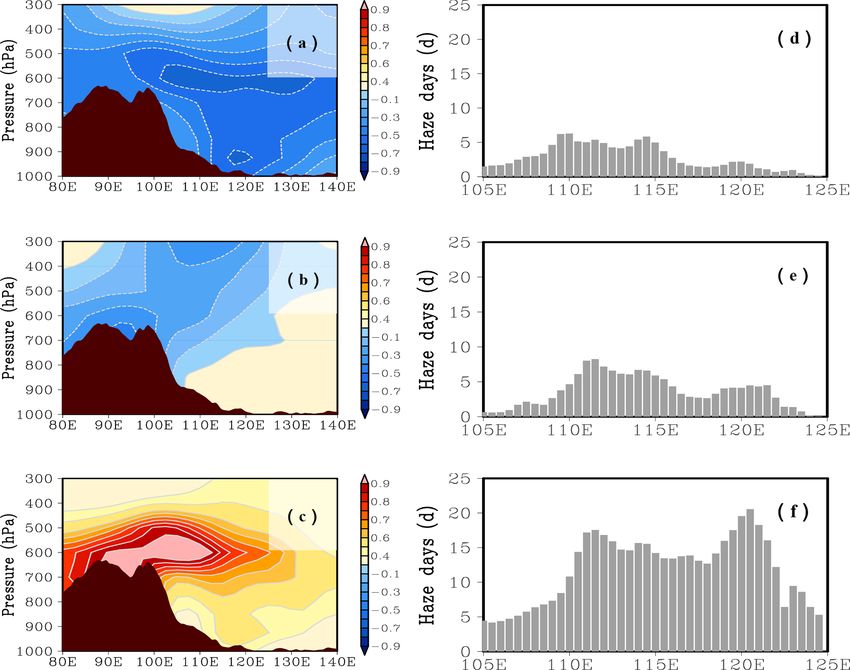
https://doi.org/10.5194/acp-21-14131-2021 Atmos. Chem. Phys., 21, 14131–14139, 202114136 X. Xu et al.: “Warm cover”: precursory strong signals for haze pollution Figure 4. Vertical cross sections of (a–c) air temperature anomalies (unit: ◦ C) and (d–f) the number of haze days averaged along 25–40◦ N in winter from 1961–1980 (a, d), 1981–2000 (b, e) and 2001–2018 (c, f). Figure 5. (a) Interannual variations of the TP’s apparent heat source (Q1 ) and air temperature of meteorological stations in the TP with altitudes above 3000 m in the winters from 1960–2012. (b) Vertical cross sections of the correlations between the TP’s apparent heat (Q1 ) and air temperature latitude averaged along 30–35◦ N in the winters from 1960–2012. (Fig. 4f) and 1981–2000 saw a middle-level occurrence of variations of the frequency of haze events seen in eastern haze days (Fig. 4e), while the lowest frequency of haze days China since the 21th century. Thermal anomalies of the TP occurred from 1961–1980 (Fig. 4d). also play an important role in the variations of the frequency The concept of variations of the tropospheric warm cover of haze events in EC apart from the anthropogenic pollutant has been proposed in this work. Under the background of emission related to the rapid industrialization of China. The climate change, it is worth considering whether the varia- observational and modeling studies have demonstrated that tional tendency of the structure of the plateau’s heat source the interannual variations in the thermal forcing of the TP induces variations of the tropospheric thermal structure in are positively correlated with the incidences of wintertime downstream areas of the Plateau, leading to the interdecadal haze over EC (Xu et al., 2016). The TP induced changes in Atmos. Chem. Phys., 21, 14131–14139, 2021 https://doi.org/10.5194/acp-21-14131-2021
X. Xu et al.: “Warm cover”: precursory strong signals for haze pollution                                                         14137

atmospheric circulation, increasing atmospheric stability and     Data availability. The        monthly       NCEP/NCAR          reanaly-
driving frequent haze events in EC (Xu et al., 2016). In this     sis data of meteorology are collected from the U.S.
study, the data analysis concerning the interannual variations    National Center for Environmental Protection (NCEP)
of the TP’s apparent heat source and air temperature in win-      (Kalnay       et      al.,    1996,      https://doi.org/10.1175/1520-
tertime at the TP with the altitudes above 3000 m showed          0477(1996)0772.0.CO;2). The daily and monthly
                                                                  ERA Interim reanalysis data of meteorology are collected from the
that since the 1960s the heat source in areas vulnerable to TP
                                                                  European Center for Medium range Weather Forecasts (ECMWF,
climate change strengthen continuously as the surface tem-        2019c,        https://apps.ecmwf.int/datasets/data/interim-full-daily/
perature increased (Fig. 5a). Furthermore, the TP’s apparent      levtype=pl/, last access: 31 May 2019, and ECMWF, 2019d, https:
heat and air temperature of the middle troposphere over EC        //apps.ecmwf.int/datasets/data/interim-full-moda/levtype=pl/, last
presented significant positive correlation (90 % confidence       access: 31 May 2019). The daily and monthly ERA 20C reanalysis
level), which is similar to warm cover structures (Fig. 5b).      data of meteorology are collected from the European Center
Therefore, we considered that the warm cover change in the        for Medium range Weather Forecasts (ECMWF, 2019a, https:
middle troposphere over EC was closely related to the TP’s        //apps.ecmwf.int/datasets/data/era20c-daily/levtype=pl/type=an/,
apparent heat and the surface temperature. The TP-induced         last access: 31 May 2019, and ECMWF, 2019b, https:
changes in the thermodynamic structure of the atmosphere          //apps.ecmwf.int/datasets/data/era20c-moda/levtype=pl/type=an/,
provided favorable climatic backgrounds driving air pollu-        last access: 31 May 2019).
                                                                     The hourly PM2.5 concentration data are collected from the
tion events in EC.
                                                                  national air quality monitoring network operated by the Ministry
                                                                  of Ecology and Environment the People’s Republic of China,
4   Discussion and conclusions                                    which can be found at https://doi.org/10.5281/zenodo.5372016
                                                                  (Cai, 2021d). The haze days of surface observa-
Based on the study of the Great Smog of London in 1952            tion     data      (https://doi.org/10.5281/zenodo.5372006,        Cai,
                                                                  2021c), air temperature of surface observation data
and Beijing’s heavy air pollution in 2014, as well as PM2.5
                                                                  (https://doi.org/10.5281/zenodo.5371982, Cai, 2021a) and L-
pollution over EC, the anomalous warm cover in the middle
                                                                  band sounding data (https://doi.org/10.5281/zenodo.5371868, Cai,
troposphere was identified as a precursory strong signal for      2021b) are obtained from the China Meteorological Information
severe air pollution events, which could be attributed to cli-    Center, China Meteorological Administration. All data presented
mate change. A stable thermal structure in the middle tropo-      in this paper are available upon request to the corresponding author
sphere, i.e., a warm cover, suppressed the ABL development,       (Wenyue Cai, caiwy@cma.gov).
which was a key inducement for the accumulation of air pol-
lutants in the ambient atmosphere.
   From the perspective of the thermal vertical structure in      Supplement. The supplement related to this article is available on-
the troposphere, the abnormal vertical structure in the tro-      line at: https://doi.org/10.5194/acp-21-14131-2021-supplement.
posphere during heavy air pollution was investigated. The
thermal structure formed by the conventional decline rate
of atmospheric air temperature often covers up the anoma-         Author contributions. XDX and WYC designed the study. XDX,
lous strong signal of the troposphere in the air pollution pro-   WYC and TLZ performed the research. WYC performed the statis-
cess, such as the abnormal stable structure with the mid-         tical analyses. XDX, WYC and TLZ wrote the initial manuscript.
                                                                  TLZ, XFQ, WHZ, CS, PY, CZW and FG contributed to subsequent
dle warm and bottom cold in the troposphere with air tem-
                                                                  revisions.
perature anomalies. The strong signal of the warm cover of
air temperature anomalies in the middle troposphere during
heavy air pollution can be described by the method of statis-     Competing interests. The authors declare that they have no conflict
tical comprehensive diagnosis analysis.                           of interest.
   A large-scale anomalous air temperature pattern of upper
warming and bottom cooling in the troposphere appeared
from the TP to the downstream EC region and even the en-          Disclaimer. Publisher’s note: Copernicus Publications remains
tire East Asian region. The frequent haze pollution events in     neutral with regard to jurisdictional claims in published maps and
EC since the start of the 21st century happens to be within       institutional affiliations.
a significant positive phase in the interdecadal variations of
warm cover in the middle troposphere. A close relationship
between the TP’s heat and the thermal structure in the atmo-      Acknowledgements. The authors acknowledge the support from the
sphere in EC and even the entire East Asian region reflected      Atmospheric Pollution Control of the Prime Minister Fund, the Na-
an important role of the TP’s thermal forcing in environment      tional Natural Science Foundation of China and the Second Tibet
change over China.                                                Plateau Scientific Expedition and Research program. We would like
                                                                  to thank Aijun Ding and the three anonymous reviewers, for their
                                                                  suggestions on restructuring the initial draft.

https://doi.org/10.5194/acp-21-14131-2021                                         Atmos. Chem. Phys., 21, 14131–14139, 2021
14138 X. Xu et al.: “Warm cover”: precursory strong signals for haze pollution
Financial support. This research has been supported by the At- Z., Szidat, S., Baltensperger, Urs., Haddad, I. E., and Prévôt,
mospheric Pollution Control of the Prime Minister Fund (grant A. S. H.: High secondary aerosol contribution to particulate
no. DQGG0104), the National Natural Science Foundation of China pollution during haze events in China, Nature, 514, 218–222,
(grant no. 91644223) and the Second Tibet Plateau Scientific Expe- https://doi.org/10.1038/nature13774, 2014.
dition and Research program (STEP, grant no. 2019QZKK0105). Kalnay, E., Kanamitsu, M., Kistler, R., Collins, W., Deaven,
D., Gandin, L., Iredell, M., Saha, S., White, G., Woollen,
J., Zhu, Y., Chelliah, M., Ebisuzaki, W., Higgins, W.,
Review statement. This paper was edited by Aijun Ding and re- Janowiak, J., Mo, K. C., Ropelewski, C., Wang, J., Leet-
viewed by three anonymous referees. maa, A., Reynolds, R., Jenne, R., and Joseph, D.: The
NCEP/NCAR 40-year reanalysis project, B. Am. Me-
teorol. Soc., 77, 437–470, https://doi.org/10.1175/1520-
0477(1996)0772.0.CO;2, 1996 (data available
References at: https://psl.noaa.gov/data/gridded/data.ncep.reanalysis.
pressure.html, last access: 31 December 2019).
Cai, M., Ou, J. J., Zhou, Y. Q., Yang Q., and Cai, Z. X.: Li, W., Li, F., Zhao, Z. Q., Liu, F. Q., Li, B., and Li, H.: L-Band Me-
Discriminating cloud area by using L-band sounding teorological Observation System Construction Technology As-
data (in Chinese), Chin. J. Atmos. Sci., 38, 213–222, sessment Report, China Meteorological Press, Beijing, China,
https://doi.org/10.3878/j.issn.1006-9895.2013.12193, 2014. 2009 (in Chinese).
Cai, W. Y., Xu, X. D., Cheng, X. H., Wei, F. Y., Qiu, X. F., Liu, S. Y. and Liang, Z. X.: Observed diurnal cycle climatology
and Zhu, W. H.: Impact of “blocking” structure in the of planetary boundary layer height, J. Climate, 23, 5790–5809,
troposphere on the wintertime persistent heavy air pollu- https://doi.org/10.1175/2010JCLI3552.1, 2010.
tion in northern China, Sci. Total Environ., 741, 140325, Miao, Y. C., Li, J., Miao, S. G., Che, H. Z., Wang, Y. Q.,
https://doi.org/10.1016/j.scitotenv.2020.140325, 2020. Zhang, X. Y., Zhu, R., and Liu, S. H.: Interaction Between
Cai, W.: Air temperature of surface observation data, Zenodo [data Planetary Boundary Layer and PM2.5 Pollution in Megacities
set], https://doi.org/10.5281/zenodo.5371982, 2021a. in China: a Review, Current Pollution Reports, 5, 261–271,
Cai, W.: L-band sounding data, Zenodo [data set], https://doi.org/10.1007/s40726-019-00124-5, 2019.
https://doi.org/10.5281/zenodo.5371868, 2021b. Ministry of Health: Mortality and morbidity during the London fog
Cai, W.: The haze days of surface observation data, Zenodo [data of December 1952, HMSO, London, UK, 1–62, 1954.
set], https://doi.org/10.5281/zenodo.5372006, 2021c. Quan, J. N., Gao, Y., Zhang, Q., Tie, X. X., Cao, J. J., Han, S. Q.,
Cai, W.: The PM2.5 concentration data, Zenodo [data set], Meng, J. W., Chen, P. F., and Zhao, D. L.: Evolution of plan-
https://doi.org/10.5281/zenodo.5372016, 2021d. etary boundary layer under different weather conditions, and
Cheng, Y. F., Zheng, G. J., Wei, C., Mu, Q., Zheng, B., Wang, Z. B., its impact on aerosol concentrations, Particuology, 11, 34–40,
Gao, M., Zhang, Q., He, K. B., Carmichael, G., Poschl, U., and https://doi.org/10.1016/j.partic.2012.04.005, 2013.
Su, H.: Reactive nitrogen chemistry in aerosol water as a source Quan, J. N., Xu, X. D., Jia, X. C., Liu, S. H., Miao, S. G.,
of sulfate during haze events in China, Sci. Adv., 2, e1601530, Xin, J. Y., Hu, F., Wang, Z. F., Fan, S. J., Zhang, H. S.,
https://doi.org/10.1126/sciadv.1601530, 2016. Mu, Y. J., Dou, Y. W., and Cheng, Z.: Multi-scale processes in
China Ministry of Environmental Protection: Technical Regulation severe haze events in China and their interactions with aerosols:
on Ambient Air Quality Index (On Trial) (HJ633-2012), China Mechanisms and progresses, Chinese Sci. Bull., 65, 810–824,
Environmental Science Press, Beijing, China, 2012. https://doi.org/10.1360/TB-2019-0197, 2020 (in Chinese).
Ding, Y. H. and Liu, Y. J.: Analysis of long-term variations of State Council of the People’s Republic of China: Notice of the Gen-
fog and haze in China in recent 50 years and their relations eral Office of the State Council on Issuing the Air Pollution
with atmospheric humidity, Sci. China Earth Sci., 57, 36–46, Prevention and Control Action Plan, State Council of the Peo-
https://doi.org/10.1007/s11430-013-4792-1, 2014. ple’s Republic of China website, available at: http://www.gov.cn/
ECMWF: ERA-20C, Daily, ECMWF [data set], available zwgk/2013-09/12/content_2486773.htm, last access: September
at: https://apps.ecmwf.int/datasets/data/era20c-daily/levtype=pl/ 2013.
type=an/, last access: 31 May 2019a. State Council of the People’s Republic of China: Notice of the Gen-
ECMWF: ERA-20C, Monthly Means of Daily Means, ECMWF eral Office of the State Council on Issuing the Air Pollution
[data set], available at: https://apps.ecmwf.int/datasets/data/ Prevention and Control Action Plan, State Council of the Peo-
era20c-moda/levtype=pl/type=an/, last access: 31 May 2019b. ple’s Republic of China website, available at: http://www.gov.cn/
ECMWF: ERA Interim, Daily, ECMWF [data set], avail- zhengce/content/2018-07/03/content_5303158.htm, last access:
able at: https://apps.ecmwf.int/datasets/data/interim-full-daily/ September 2013.
levtype=pl/, last access: 31 May 2019c. Tan, C. H., Zhao, T. L., Cui, C. G., Luo, B. L., and Bai, Y. Q.:
ECMWF: ERA Interim, Monthly Means of Daily Means, ECMWF Characterization of haze pollution over Central China during the
[data set], available at: https://apps.ecmwf.int/datasets/data/ past 50 years, Science in China, China Environ. Sci., 35, 2272–
interim-full-moda/levtype=pl/, last access: 31 May 2019d. 2280, 2015 (in Chinese).
Huang, R.-J., Zhang, Y., Bozzetti, C., Ho, K.-F., Cao, J.-J., Tang, G., Zhang, J., Zhu, X., Song, T., Münkel, C., Hu, B.,
Han, Y., Daellenbach, K. R., Slowik, J. G., Platt, S. M., Schäfer, K., Liu, Z., Zhang, J., Wang, L., Xin, J., Suppan, P., and
Canonaco, F., Zotter, P., Wolf, R., Pieber, S. M., Bruns, E. Wang, Y.: Mixing layer height and its implications for air pollu-
A., Crippa, M., Ciarelli, G., Piazzalunga, A., Schwikowski,
M., Abbaszade, G., Schnelle-Kreis, J., Zimmermann, R., An,
Atmos. Chem. Phys., 21, 14131–14139, 2021 https://doi.org/10.5194/acp-21-14131-2021X. Xu et al.: “Warm cover”: precursory strong signals for haze pollution 14139 tion over Beijing, China, Atmos. Chem. Phys., 16, 2459–2475, Wang, Y. S., Li, W. J., Gao, W. K., Liu, Z. R., Tian, S. L., https://doi.org/10.5194/acp-16-2459-2016, 2016. Shen, R. R., Ji, D. S., Wang, S., Wang, L. L., Tang, G. Q, Tie, X. X. and Cao, J. J.: Aerosol pollutions in eastern China: Song, T., Cheng, M. T., Wang, G. H., Gong, Z. Y., Hao, J. M., and Present and future impacts on environment, Particuology, 7, 426– Zhang, Y. H.: Trends in particulate matter and its chemical com- 431, https://doi.org/10.1016/j.partic.2009.09.003, 2009. positions in China from 2013–2017, Sci. China Earth Sci., 62, Wang, G. H., Zhang, R. Y., Gomez, M. E., Yang, L. X., 1857–1871, https://doi.org/10.1007/s11430-018-9373-1, 2019. Zamora, M. L., Hu, M., Lin, Y., Peng, J. F., Guo, S., Meng, J. J., Whittaker, A., Berube, K., Jones, T., Maynard, R., and Richards, R.: Li, J. J., Cheng, C. L., Hu, T. F., Ren, Y. Q., Wang, Y. S., Gao, J., Killer smog of London, 50 years on: particle properties and Cao, J. J., An, Z. S., Zhou, W. J., Li, G. H., Wang, J. Y., Tian, P. F., oxidative capacity, Sci. Total Environ., 334–335, 435–445, Marrero-Ortiz, W., Secrest, J., Du, Z. F., Zheng, J., Shang, D. J., https://doi.org/10.1016/j.scitotenv.2004.04.047, 2004. Zeng, L. M., Shao, M., Wang, W. G., Huang, Y., Wang, Y., Xu, X., Zhao, T., Liu, F., Gong, S. L., Kristovich, D., Lu, C., Zhu, Y. J., Li, Y. X., Hu, J. X., Pan, B., Cai, L., Cheng, Y. T., Guo, Y., Cheng, X., Wang, Y., and Ding, G.: Climate modulation Ji, Y. M., Zhang, F., Rosenfeld, D., Liss, P. S., Duce, R. A., of the Tibetan Plateau on haze in China, Atmos. Chem. Phys., 16, Kolb, C. E., and Molina, M. J.: Persistent sulfate formation from 1365–1375, https://doi.org/10.5194/acp-16-1365-2016, 2016. London Fog to Chinese Haze, P. Natl. Acad. Sci. USA, 113, Yim, S.-Y., Wang, B., Liu, J., and Wu, Z. W.: A comparison of re- 13630–13635, https://doi.org/10.1073/pnas.1616540113, 2016. gional monsoon variability using monsoon indices, Clim. Dy- Wang, H., Xue, M., Zhang, X. Y., Liu, H. L., Zhou, C. H., nam., 43, 1423–1437, https://doi.org/10.1007/s00382-013-1956- Tan, S. C., Che, H. Z., Chen, B., and Li, T.: Mesoscale mod- 9, 2014. eling study of the interactions between aerosols and PBL me- Zhang, X. Y., Wang, J. Z., Wang, Y. Q., Liu, H. L., Sun, J. Y., teorology during a haze episode in Jing–Jin–Ji (China) and its and Zhang, Y. M.: Changes in chemical components of aerosol nearby surrounding region – Part 1: Aerosol distributions and particles in different haze regions in China from 2006 to 2013 meteorological features, Atmos. Chem. Phys., 15, 3257–3275, and contribution of meteorological factors, Atmos. Chem. Phys., https://doi.org/10.5194/acp-15-3257-2015, 2015. 15, 12935–12952, https://doi.org/10.5194/acp-15-12935-2015, Wang, J. J., Zhang, M. G., Bai, X. L., Tan, H. J., Li, S., Liu, J. P., 2015. Zhang, R., Wolters, M. A., Qin, X. Y., Zhang, M. M., Lin, H. M., Zhu, W. H., Xu, X. D., Zheng, J., Yan, P., Wang, Y. J., and Li, Y. N., Li, J., and Chen, L. Q.: Large-scale transport of PM2.5 Cai, W. Y.: The characteristics of abnormal wintertime pol- in the lower troposphere during winter cold surges in China, Sci. lution events in the Jing-Jin-Ji region and its relationships Rep.-UK, 7, 13238, https://doi.org/10.1038/s41598-017-13217- with meteorological factors, Sci. Total Environ., 626, 887–898, 2, 2017. https://doi.org/10.1016/j.scitotenv.2018.01.083, 2018. https://doi.org/10.5194/acp-21-14131-2021 Atmos. Chem. Phys., 21, 14131–14139, 2021
You can also read