MAXQDA 2020 for Windows & Mac: Distinguishing features and functions - University of Surrey
←
→
Page content transcription
If your browser does not render page correctly, please read the page content below
Software Reviews : MAXQDA 2020

 MAXQDA 2020 for Windows & Mac: Distinguishing features and functions
This document is intended to be read in conjunction with the ‘Choosing a CAQDAS Package Working Paper’ which
provides more general commentary of common CAQDAS functionality. It does not provide an exhaustive account of all
the features provided by MAXQDA 2020 but is designed to highlight some of its distinguishing elements. The Comment
section at the end details our opinions on certain aspects of functionality and usability. See also Silver & Lewins (2014)
Using Software in Qualitative Research: A Step-by-Step Guide, and Woolf & Silver (2018) Qualitative Analysis using
MAXQDA: The Five-Level-QDA method and the MAXQDA website. We thank Julia Gerson of VERBI GmbH for ensuring
the accuracy of this review.

Background       http://www.MAXQDA.com             MAXQDA 2020 for Windows & Mac is the latest in a software stream
originally developed by Udo Kuckartz ■ It enables analysis of qualitative data including text, pdf, tables, audio, video,
(focus group) transcripts, tweets, YouTube data, websites, surveys, bibliographical sources and still images ■ It
incorporates good support for mixed methods research and quantitative analyses ■ MAXQDA Plus includes MAXDictio
which extends functionality to quantitative content analysis, providing dictionary-based content analysis with Key Word
in Context (KWIC) ■ MAXQDA Analytics Pro offers a large range of statistical analyses ■ MAXQDA Reader is a free tool
allowing MAXQDA projects to be viewed and searched ■ MAXApp for iOS and Android is for data collection and coding
■ The Mac & Windows versions have identical functionality and use the same project file format ■ All parts of a
MAXQDA project file plus specific reports can be exported.

Minimum System Specifications (recommended by developer)                Microsoft Windows 8 or higher / Mac
10.12 (Sierra) or higher ■ 4 GB RAM, recommended: 8 GB or more ■ Processor: 1,6 GHz with 2 cores, recommended: 2
GHz or more with 4 cores or more

The Structure of work in MAXQDA 2020                  MAXQDA 2020 functions using an internal database system. Data
files are contained within the project, and are moved or saved as part of the project ■ The user interface comprises a
tab menu with a short description for each function and can be displayed in 13 languages (English, German, Chinese
(simplified & traditional), Czech, French, Italian, Japanese, Polish, Portuguese (European & Brazilian), Russian, Spanish,
& Turkish) ■ The interface consists of four main windows. The Document System lists data files. The Code System houses
the coding schema. The Document Browser displays individual documents (multiple tab option) and the Retrieved
Segments window displays coded data ■ Windows can be resized, opened, undocked and closed as required.

                                                          The Document Browser
             The Document System
                                                           displaying codes and
              stores and provides
                                                           memos in the margins
               access to data files

                                                                                          Combinations of activated
                                                                                          Documents and Codes are
                                                                                          displayed in the Retrieved
                                                                                              Segments window

             The Code System stores
              and provides access to
                the coding scheme

                Figure 1. MAXQDA 2020 Interface showing Document System and coded document

CAQDAS Networking Project © Christina Silver, Ann Lewins & Sarah L Bulloch                                  November 2019
Software Reviews : MAXQDA 2020

Data types and format in MAXQDA 2020                 Textual formats: Rich Text Format (RTF), Word files (.DOC, .DOCX,
.ODT, .TXT), PDF files ■ Table formats: Excel files (.XLS, .XLSX) ■ Graphic formats: JPG, GIF, BMP, PNG, SVG and TIF ■
Audio/video formats: standard file formats like MP3, WAV, MP4, MOV and others. Audio/video can be transcribed
within MAXQDA and written transcripts synchronized with corresponding media file ■ Video file subtitles (.SRT) ■
Import of interview transcripts with timestamps combined with corresponding audio and video files ■ Bibliographical
data in .RIS or .TXT format ■ Texts can be edited but are safeguarded from accidental changes by read-only properties
■ Import survey data from Excel spreadsheets, SPSS (.SAV), and SurveyMonkey ■ Connect to Twitter to import, filter,
statistically analyse and visualise tweets ■ Text line wraps and paragraphs are automatically numbered ■ Automatic
recognition and coding of different speakers in focus group transcripts as part of transcript importation ■ “Web
Collector for MAXQDA” is a free browser add-on to capture web-content for import. ■ REFI-QDA Projects (.QDOX)
created with other QDA software packages

Closeness to data and interactivity in MAXQDA 2020 Windows containing different elements of work can be
displayed and worked with simultaneously ■ Seamless interactivity across different aspects of work ■ Tables displaying
frequency information are fully interactive and easily exported ■ Retrieval of coded data is viewed in its source context
at the same time as being lifted out of context providing a good balance ■ The margin display shows codes, comments,
memos and memo previews, time stamps, paraphrases, and GEOLinks (geographical references), is fully interactive and
prints well. It can be filtered in various respects, including by activation, user or colour attribute.

Coding scheme in MAXQDA 2020                The coding schema can be as hierarchical or as un-hierarchical as required. A
hierarchical structure can contain up to ten levels ■ Drag and drop allows easy re-organisation of codes across and
within hierarchies and into sets (shortcut groupings) ■ Assign colour to codes which appear in margin display and in the
code system ■ Codes on view can be filtered by colour or author ■ Code definitions can directly be attached to each
code in a code memo ■ Codes can additionally be re-organized into sets which act as short-cut groupings ■ Emoticode®
feature allows quick coding with more than 300 symbols ■ Code system can be created and re-organized in a mind-
map layout in the Creative Coding mode ■ The Smart Coding Tool allows the coding scheme to be reviewed and
amended ■ Frequency tables and editable diagrams show statistics of sub-codes.

Coding Processes in MAXQDA 2020           Drag and drop selected segments onto a code or vice versa ■ Assign
recently used codes from drop-down menu ■ Assign keyboard shortcuts to frequently used codes ■ Apply weight to
coded segments within a range of 0 to 100 ■ Apply comments to coded segments ■ “Open coding” mode for quick
inductive coding ■ Convert code frequencies into numeric attributes ■ Auto-coding devices based on text searches –
including options to code surrounding sentence, paragraph, or set number of words if additional context required.
Automatic coding of text based on requested auto-indexing of selected words after using word frequency tools in
MAXDictio ■ Categorize and code answers of open-ended survey questions in an interactive display.

Basic Retrieval of coded data in MAXQDA 2020                  Activation is the central retrieval principle which is easy to
understand and execute. Activation ‘turns on’ combinations of codes and documents to display relevant segments in
the Retrieved Segments window ■ Documents can be activated in various ways, e.g. by sets, variable values, weight, at
random or by code colour ■ Speaker-sections within e.g. focus-group transcripts can also be activated independently ■
Functional hierarchies allow quick retrieval of data coded at a top level and all its sub-codes together. A subtle variation
on this when querying is the Use Subcodes option which treats a whole hierarchy as one code for the purposes of finding
e.g. co-occurrences of another code anywhere within other activated hierarchies ■ Overview tables of coded segments
provide interactive listing of selected parts of coded data ■ Writing Summaries of coded segments and displaying them
together with variable values in an overview table grouped by documents and codes ■ Compare coded text segments
or code frequencies across different groups ■ Display of the amount data coded.

Data Organisation in MAXQDA 2020                     Descriptive organization according to known characteristics is
enabled by applying variables to data ■ Three types of variable: document variables, focus group participant variables
and code variables, provide flexibility for organizing different units of analysis ■ Sets of documents provide shortcuts
to groups of data ■ Documents can be given colour attributes for visual differentiation.

Writing Tools in MAXQDA 2020             There are five writing ‘spaces’ in MAXQDA 2018 ■ The Logbook is a central
space for keeping notes about the whole research process ■ Memos can be attached to other components (e.g. groups,
documents, codes, segments, sets) or be ‘free’. They are displayed with user defined styles, labels and post-it note
icons, and can be grouped by type. Memos can be viewed, filtered, searched and sorted in a designated workspace

CAQDAS Networking Project © Christina Silver, Ann Lewins & Sarah L Bulloch                                   November 2019
Software Reviews : MAXQDA 2020
called “Memo Manager” or in a simple Table Overview, and selected Memos can be exported into one file ■
Paraphrases are displayed next to data in the Document Browser window or in a matrix view for user-specified groups
and can be used to build up a category system with a focused paraphrase table ■ Comments are spaces for notes linked
to specific coded segments and can be displayed next to data in the Document Browser ■ Summaries are spaces for
summarizing multiple pieces of coded data, displayed in a matrix view of (activated) documents or user-specified groups
by codes.
Searching and interrogating the dataset in MAXQDA 2020 Interrogate by simple / complex states of activation
■ Activation by weight adds an extra dimension to searching ■ Interactive Matrix Browsers allow tabular visualization
of code co-occurrences and frequency of codes occurring in (groups of) documents ■ Code Configuration displays co-
occurrences of codes in up to six dimensions ■ Matrices are interactively connected to source data ■ Code frequency
table shows frequency of codes across whole data set or amongst activated documents and codes ■ Usual range of
Boolean and proximity operators for retrieving coded text ■ Auto-code text search hits with existing or new codes.
Linking devices in MAXQDA 2020 Pairs of data segments within text documents, images, and memos can be
linked ■ External links to websites and local files are possible ■ Link memos to one another in map (visual link only) ■
Link memos to codes (functional link) and coded segments to enable retrieval of writing accordingly ■ GEOLinks provide
direct link from data segments or codes to Google Earth locations ■ Hierarchical links between codes in Creative Coding
Maps that can be transformed into the coding schema.
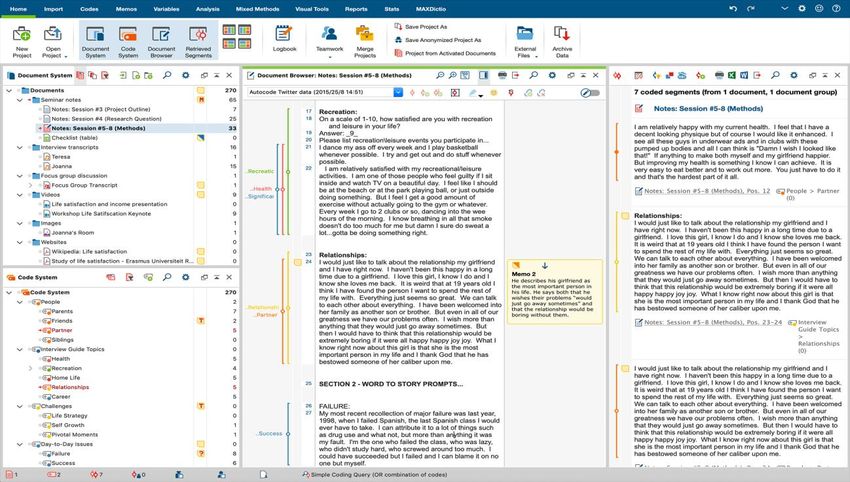
Visual tools in MAXQDA 2020 Document Portrait provides a visual overview of how an individual document
has been coded ■ Document Comparison Chart compares coding across paragraphs within activated documents ■ The
Codeline provides an interactive visual map by paragraph showing how an individual document has been coded. A
single click in any colour block within all three tools provides in-context retrieval ■ Tag clouds display frequently used
words for document(s) or codes in a cloud illustration ■ Document / Code Map display the results of similarity analysis
as clusters of Cases or Codes in a map-like display ■ Charts show sub-code and document variable statistics ■ MAXMaps
is a mapping tool which enables the graphic visualization of all aspects of the project and to embed items not existent
in the project – such as photographs etc. Full (interactive) integration between objects in a map and the rest of the
project. ■ MAXMaps can also be used as a free mind mapping tool completely independently from any project data ■
MAXMaps offers nine automatic templates for focused visualizations, e.g. Case Models or Code Theory Models.
Figure 2. Some of MAXQDA’s range of Visual Tools
Output in MAXQDA 2020 Retrieved segments can be exported to a WORD document, EXCEL or HTML (including
memos and variables) ■ Smart Publisher tool creates a ready-to-print report for all segments of selected codes ■ Output
combinations of memos into one file (all memos, all memos currently displayed in the Memo Manager, all memos
linked to one data file or a set of files, or all memos linked to one code) ■ Any interactive table can be exported to view
CAQDAS Networking Project © Christina Silver, Ann Lewins & Sarah L Bulloch November 2019Software Reviews : MAXQDA 2020
in a spreadsheet application ■ All visual displays can be saved as an image ■ Code system can be exported as code book
with definitions (if are attached as code memos) ■ Print documents including margin view.
Content analysis features in MAXQDA 2020 MAXDictio (add on module with MAXQDA Plus) allows word
frequency across (groups of) texts providing a tabular index with interactive Key Word In Context (KWIC) retrieval ■
Dictionaries can be built to create lists of active words that can govern the functioning of other tools. Indexing options
auto-code selected words and surrounding context ■ Interactive Word Tree displays words including most frequent
words leading to or from the word (combination) in focus ■ Language option can be switched to Japanese language to
facilitate quantitative text analysis for Japanese text ■ Frequency analysis for combinations of up to 5 words ■ Word
frequency analysis can be lemmatized in 14 languages.
Mixed methods features in MAXQDA 2020 MAXQDA 2020 provides a selection of tools specifically designed to
facilitate mixed methods projects ■ Activation by variable allows data files to be activated based on the presence of
variables (e.g. socio-demographic characteristics) ■ The Interactive Quote Matrix generates a display of grouped coded
segments based on respondents' characteristics ■ Crosstabs allows coded comparisons to be made according to groups
of data ■ Quantitizing creates a variable based on the frequency of a code in a document ■ Typology Tables allow the
visualization of variable values based on qualitative typologies previously created ■ Similarity Analysis analyzes which
documents are the most similar based on codes, code frequency and variable values ■ Joint Displays display qualitative
and quantitative data and results in side-by-side displays.
Statistical features in MAXQDA 2020 Stats (add on module with MAXQDA Analytics Pro) offers frequently used
descriptive and inferential statistical methods ■ Statistical analysis of MAXQDA project data (codes / variables) or
external file (.sav SPSS database): frequency tables, descriptive statistics, crosstabs, one-way analysis of variance,
correlation and scales ■ Interactive result tables, in which rows and columns can be moved, deleted or merged while
the results are automatically recalculated.
Reporting and export in MAXQDA 2020 The Smart Publisher is a report generator to create a formatted
Word document with selected coded data, including title page, and tables of contents from editable template that can
be set up to a company's corporate design ■ A codebook can be created and exported, which lists selected codes and
their associated code definition ■ Table overviews of coded segments, memos, codes, links and summaries (incl. coded
segments) can be displayed and exported. ■ Save all project components to one EXCEL file ■ Archiving features pulls
all sources and optionally statistical data, media data, meta data and code system into a folder or zip file
Teamworking in MAXQDA 2020 Merge parts of projects e.g. coding for individual documents, or a document
group, or a whole project’s database can be imported into another ■ Code margin displays can be filtered to hide or
reveal other researcher’s work ■ Intercoder agreement can be calculated to compare coding of the same document
done by two researchers ■ MAXQDA Reader enables those without a license to view project data ■ Finely tune access
to, and rights over specific functions (coding, editing, etc.) in User Management settings
Comment on MAXQDA 2020
• The total equivalence of the Mac and Pc versions of MAXQDA 2020 is welcomed. This significantly helps
collaborative projects that need to share work and makes the teaching of mixed platform users unproblematic.
• The MAXQDA 2020 user interface is compact, appealing and tidy. Tables, visual tools and memos provide
superb interactive contact with different aspects of work keeping the user close to source data at all times.
Auto arranging but resizable windows allow easy customization and isolation of element(s) of work. The user
interface could be rather cramped with larger datasets and therefore it is recommended to work with large or
multiple monitors if possible.
• MAXQDA 2020 is intuitive, simple and efficient. It is easy to learn and to begin working with effectively. It
includes some simple yet appealing features which users often request, including the ability to choose from an
extensive colour palate for codes and print off the margin display easily and satisfactorily.
• MAXQDA 2020 makes good use of colour to visually differentiate various aspects of work. Colour is a powerful
means of organisation and MAXQDA provides several unique uses of colour. These are seemingly simple devices,
but are valued highly by users and when used systematically can be powerful retrieval and filtering devices.
• MAXQDA 2020 has excellent writing tools, including options not provided by other products. MAXQDA has one
of the best memo retrieval systems, which is particularly useful in team situations. The varied nature of memo
CAQDAS Networking Project © Christina Silver, Ann Lewins & Sarah L Bulloch November 2019Software Reviews : MAXQDA 2020
retrieval means it is less important to be systematic than in other software packages. However, the ability to
code the content of memos would be useful.
• Activation allows quick and uncomplicated retrieval without recourse to the search tool. Interrogation of the
dataset in this way is easy to grasp and manipulate. Automatically generated Code Relations and Code Matrix
browsers, and the Code Configuration tool, provide easy ways of viewing co-occurrences which are more
complicated to generate in other products.
• Qual-quant integration supporting mixed methods projects is highly developed in MAXQDA There are several
tools specifically designed to support mixed methods analysis, some of which are unique to MAXQDA. For
example, converting code frequencies into document attributes, the ability to assign weight to coded-segments
and interrogate on that basis.. The Stats module (available in MAXQDA Analytics Pro) also means some
quantitative analysis can be undertaken without exporting to another program. However, currently statistical
analysis is restricted to descriptive and bivariate inferential statistics (not multivariate inferential statistics).
• The focus-group import function is powerful and efficient, resulting in the automatic coding of repeated
speaker sections in focus-group transcripts, group interviews and other data where repeated structures exist
within data documents. The pre-formatting that needs to occur to make this work is very limited, therefore does
not place an extra burden on data preparation. However, it is cumbersome to link responses by the same
participant from two different data sources (e.g. a focus-group and a survey, or an interview and observations)
• Sets of documents and codes in MAXQDA 2020 are very useful as is the ability to save combinations of states
of activations, turning what might be complex multiple step query operations in other packages into simple and
intuitive processes in MAXQDA.
• In the team situation users can be selective about which items they merge together thereby allowing
cumulative comparison of work. The MAXQDA Reader is also a useful way to involve team members who are
not using the software directly.
• Visualisation tools are unusual and easy to operate, with several options unique to MAXQDA 2020. The visual
tools using colour blocks to chart codes in data can be particularly useful if tracking process or the flow of
thought in unstructured narratives. Such tools depend on deliberately assigning colours to codes in a logical
and consistent way. MAXQDA was the first CAQDAS package to incorporate the ability to link to geographical
reference points in mapping tools (e.g. Google EarthTM) using GEOlinks.
• MAXMaps is a useful tool allowing the user to create layers and graphically enhance the map in various ways.
15 different model templates provide powerful ways to visually interrogate patterns and connections in data
based on earlier work.
• MAXDictio (available in MAXQDA Plus) has a useful range of content analysis tools not currently available in
most other code based packages (apart from QDA Miner and DiscoverText). They provide interactive (KWIC)
connections to the source context.
Further Reading
• Bulloch, SL. Silver, C. & Fielding, N. (2017) Using Computer Packages in Qualitative Research: exemplars, developments and
challenges in Willig, C. & Stainton-Rogers, W. (eds.) The SAGE Handbook of Qualitative Research in Psychology. SAGE
• Corbin J & Strauss A (2007) Basics of Qualitative Research: Techniques and Procedures for Developing Grounded Theory - 3rd
Edition, SAGE
• di Gregorio, S & Davidson J (2008) Qualitative Research for Software Users, McGraw Hill, Open University Press, UK (uses a
MAXQDA project as worked example)
• Guetterman, T., Creswell, J. W., & Kuckartz, U. (2015): Using joint displays and MAXQDA software to represent the results of
mixed methods research. In M. McCrudden, G. Schraw & C. Buckendahl (Eds.), Use of visual displays in research and testing:
Coding, interpreting, and reporting data (pp. 145-176). Charlotte, NC: Information Age Publishing.
• Silver C & Lewins A (2010) 'Computer Assisted Qualitative Data Analysis' in Penelope Peterson, Eva Baker, Barry McGaw
(Editors), International Encyclopedia of Education, Vol 6, pp 326-334. Oxford: Elsevier
• Silver C & Lewins A (2014) Using Software in Qualitative Research: A Step-by-Step Guide, Sage Publications
• Silver C. (2018) CAQDAS at a Crossroads: Choices, Controversies and Challenges. In: Costa A., Reis L., Souza F., Moreira A.
(eds) Computer Supported Qualitative Research. ISQR 2017. Advances in Intelligent Systems and Computing, vol 621.
Springer, Cham
• Silver, C. & Bulloch, SL. (2016) CAQDAS at a crossroads: affordances of technology in an online environment in Fielding, N. &
Lee, R. (eds.) The SAGE Handbook of Online Research Methods. SAGE.
• Kuckartz, U. (2014) Qualitative Text Analysis: A Guide to Methods, Practice and Using Software, Sage, London
• Woolf, N. H., & Silver, C. (2018): Qualitative Analysis Using MAXQDA: The Five Level QDA Method. Routledge, New York
CAQDAS Networking Project © Christina Silver, Ann Lewins & Sarah L Bulloch November 2019You can also read