ARE YOU FOR REAL? ENGINEERING A VIRTUAL LAB FOR THE SPORTS SCIENCES USING WEARABLES AND IOT
←
→
Page content transcription
If your browser does not render page correctly, please read the page content below
Proceedings

Are You for Real? Engineering a Virtual Lab for the
Sports Sciences Using Wearables and IoT †
Joel Benesha, Jim Lee *, Daniel A. James and Barbara White
 SABEL Labs, College of Health and Human Sciences, Charles Darwin University, 0810 Darwin, Australia;
 joel.b13@hotmail.com (J.B.); dan@qsportstechnology.com (D.A.J.); Barbara.White@cdu.edu.au (B.W.)
 * Correspondence: jim@qsportstechnology.com or sabellabs.com
 † Presented at the 13th conference of the International Sports Engineering Association, Online, 22–26 June 2020.

 Published: 15 June 2020

 Abstract: In tertiary education, disciplines such as sports science that require experimental
 components in their courses represent a significant challenge for online and distance education.
 This paper demonstrates the design and construction of an enriched experiment, together with the
 prototype software solution which can all be operated remotely using a web-based client. It
 presents research that investigated how to visualise data from internet of things (IoT) sensor
 devices (inertial sensor) used for tracking football sideline throw-ins. In this simple experiment,
 data was collected from one footballer, fitted with a single inertial sensor. A two-dimensional (2D)
 video, three-dimensional (3D) motion capture system and inertial sensor were all used to detect the
 release point of a sideline ball throw-in. In this project, inertial sensor data was used to create a 3D
 model using web graphical language and three.js.

 Keywords: IoT; visualization; virtual technology; augmented technology; wearable technology

1. Introduction
      With the growth of the sports industry, professional sporting people are expected to maintain a
high level of performance over their careers while maintaining a positive attitude towards injury,
pain, exhaustion and fatigue [1]. This normalisation regarding the quality of performance athletes
must achieve means that coaches are now expected to train athletes harder and tougher to achieve a
perfect performance. With technology rapidly evolving, there is a growing demand in the sports
world for equipping coaches, other sporting professionals, and players [2,3] with faster, smarter
communication. Furthermore, in a country such as Australia, where there are vast distances that
often impede a student from attending a class, distance learning is not uncommon. In the sports
science program at Charles Darwin University in the Northern Territory, more than 80% (sometimes
over 90%) of students are distance learners. Offering realistic learning environments can be
challenging.
      The internet of things (IoT) is a collection of internet services enabling communication
capability between computing devices and people through the world wide web [4]. With increasing
adoption into sports sciences, the IoT may provide a means of enhancing sports science education
and athletic performance. However, before this can be achieved, sports science students need to
understand how to analyse and interpret IoT performance data. For distance learners, extended
reality technologies (virtual and augmented) may provide a platform to supplement actual
classroom activities.
      In a sports science context, inertial sensors are devices that contain microsensors that can
measure various outputs [5]. Accelerometers, gyroscopes and magnetometers are now typically
found in inertial sensor devices. A device can have various forms, from smart phones and watches to
devices specifically manufactured for movement analysis. Depending on the device and subsequent

Proceedings 2020, 49, 110; doi:10.3390/proceedings2020049110                   www.mdpi.com/journal/proceedings
Proceedings 2020, 49, 110 2 of 6
application, an inertial sensor can be part of an IoT system. Data obtained from IoT sensors is often
difficult to decipher and there is a need for data visualisation and education to equip the industry
better. Data visualisation, a technique for creating images, diagrams or animations [6], is used to
interpret data obtained from a device and output it in a form where end users can accurately discern
and understand the data.
The aim of this research was to investigate how IoT may be used in education to enrich the
student experience as well as to prepare students for future trends in the industry. In this initial
phase of research, IoT sensor (time series) data from a specific context of a football throw-in was
examined and visualised with the intention of prototyping a process for developing future
interactive technologies in the virtual, augmented and IoT realms as teaching tools for sports
scientists who may later become analysts for coaches and athletes. The specific focus was the
kinematics of elbow extension during a ball throw-in activity. The throw-in was chosen due to the
nature of the action. This action enables a single joint and body segment to be isolated for
assessment. Adding to this, most of the movement (elbow flexion/extension) is in a single orthogonal
plane [7], with a small amount of forearm supination in a second plane. Therefore, a small but
manageable amount of complexity, enough to challenge the visualisation model, was present in the
system of interest.
2. Materials and Methods
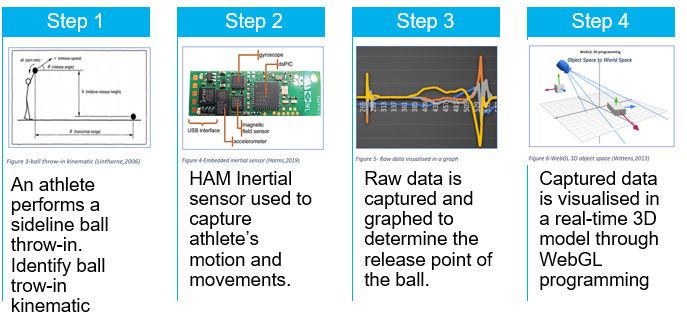
One experienced male football player performed a series of ball throw-in simulations (five
throws in total) (Figure 1). The participant was required to stand and throw a soccer ball from a
static position. Each trial was recorded via a single two-dimensional (2D) video (HDR-PJ240E. Sony
Corporation, Minato, Japan) and a 10-camera three-dimensional (3D) infrared motion capture
(MoCap) system (Optitrack. NaturalPoint, Inc. Oregon, United States of America). These recordings
were aimed to track forearm movement, specifically the elbow.
Figure 1. Ball throw-in experiment using infrared Optitrack cameras.
Synchronisation was carried out where a clear sharp impact on the wrist was detected in the
three capture systems used. This was followed by the throw. A second impact was made prior to
stopping recording. This enabled each throw to be identifiable between the impact boundaries
something akin to a clapperboard effect in both camera systems and sensor data. Furthermore, this
simple and effective synchronisation method has been validated and reported previously [8].
Using this data, an iterative human centred approach [9] was used to build a web application to
visualise the data. To ensure that the end user (a coach or sports science student) would be able to
use the software visualisation, personas were created to represent these end users (a persona is a
fictional representation of the real user based on research) [10]. Personas provide developers with a
clear representation of a typical user that may use the web application. The 3D web visualisation
design in this application targeted coaches, players and analysts. Visualisation of a player’s
performance helped identify areas of performance improvement. Dam & Siang [10] wrote that a
persona with an assigned role addresses the needs, goals and behaviour pattern of the user.Proceedings 2020, 49, 110 3 of 6
“Andrew” was the persona created to gain an understanding of what is expected from a 3D
performance visualisation from a coach’s perspective.
Agile software development was used to develop the visualisation and included six sprints.
After each sprint, testing the software output with users of the application allowed the developer to
quickly gain insights on how a coach may understand, perceive and use the football throw-in as a
visualisation tool for coaching, therefore a teaching tool with real life applications. Feedback from
this guerrilla user testing [11] was assessed in three categories: effectiveness, efficiency and
satisfaction of the coaches when using the 3D model in a real-life application. This included a 3D
visualisation of a ball throw-in that would be useful for real world use. The visualisation model
allows simultaneous visualisation of the player’s performance. Therefore, the coach can fix a player’s
ball throw-in technique immediately. Correcting a player’s technique to improve performance is
extremely crucial in a game environment [3,5]. From these observations it was concluded that it was
important to provide a 3D visualisation model that best communicated the biomechanics. This
critical understanding was reinforced through a chance conversation with an elite football coach.
Prior to visualising the data, the software development process needed to extract the data from
the sensors so that visualisation development could occur. The process of data extraction is
illustrated below (Figure 2). Biomechanical data was captured from the inertial sensor during the
ball throw-in movement and plotted to help understand the significant data that may be used for
visualisation. This data was then incorporated into a 3D model to be visualised through a WebGL
based development. The software environment used Atom as the HTML text editor, Blender as the
animation and rendering software, and WebGL and three.js were selected as the graphical language
for developing the 3D ball throw-in model. A suitable graphics card at a medium range price with
powerful rendering capabilities, the AMD Radeon RX 580, was used to render the 3D graphics.
Figure 2. Development phase that demonstrates the process of data extraction from the throw, to
comparative data capture systems.
3. Results
To facilitate the educational aims, this research developed a 3D visualisation model as a
primary aid for students to understand technological methods, which in turn may assist coaches to
best visualise a player’s performance. When coaches are looking for a competitive advantage over
their opposition [3] the 3D visualisation model attempts to offer clear visual data that may improve
the way data is currently interpreted. This section discusses experimental results of biomechanical
data obtained through observations of kinematics of elbow extension during a ball throw-in activity.
Using the MoCap and inertial sensors, data was captured through video and graphical analyses of
the athlete’s avatar. A comparison of the video and graphical sensor data was used for accurateProceedings 2020, 49, 110 4 of 6
examination of the biomechanical data. Additionally, the software development processes are
elaborated describing the approach used to develop a suitable 3D visualisation model of the ball
throw-in activity. The 3D implementation process outlined successes and failures and many of the
decisions that needed to be made as this area of software development (3D data visualisation) and
compatible development hardware was explored. Potential changes to the processes used were
addressed, including relevant literatures, resources and tools that further support the development
of 3D visualisation model.
3.1. Experimental Data
Nine degrees of freedom (9DOF) of accelerometers, gyroscopes, and magnetometers sensor
data were observed during the experimental stage through video capturing and graphical avatar
data. This process of examination through video capture and graphical sensor data allowed the
detection of the arm movements from starting to stopping point. Events in the graphical data which
matched the video capture were examined to identify the initiation of the throw and release point of
the ball. Events in the biomechanical data of the ball throw-in activity through infrared MoCap data
validated the ball throw-in activity. By observing a 2D graph of sensor data, the rotation of the arm
and the release point of the ball was identified. Additionally, both experiments provided critical
analytical data to construct a data visualisation model, to best communicate the ball throw-in
activity to the coaches. Experimental results obtained serve as a platform for developing future
interactive technologies in the field of virtual, augmented and IoT realms as teaching tools for sports
scientists who may later become analysts for coaches and athletes.
3.2. Software Development Processes
Software development of the 3D visualisation model of the ball throw-in was undertaken using
six sprints with varying degrees of success. Initially, identifying appropriate hardware and software
compatibility for efficient software development was required. The solution was the use of an AMD
Radeon RX 580, a powerful mid-class rendering graphics card. To be able to use the data produced
by the sensors, three different software development technologies (Blender, WebGL and Three.js)
were combined. However, identifying the correct software took significant time, as 3D visualisation
programming is a new field of learning. The approach taken to successfully identify suitable
software was based on research, installing and testing the software and completing software
tutorials. Software development processes for 3D visualisation models required further software
research and experimentation. The combination of reviews of relevant literature and the
experimentation phase enabled growth in the understanding of the fundamental concepts
underpinning the biomechanics of sports as well as specific understanding of the IOT and sensors.
This domain of knowledge was important to be able to create accurate and detailed software
visualisations. As a result, this approach created a concurrent, efficient and effective workflow that
helped develop a 3D visualisation model. Another aspect that worked well was the combination of
multiple software development technology and tools. This was a strategic approach which aimed at
facilitating the development process, coding with more efficiency, and therefore accelerating the
learning curve to still be able to produce a product at the end of the project.
4. Discussion
The aim of this research was to investigate how the IoT may be used in education to enrich the
student experience as well as to prepare students for future trends in the industry. As a result, a
range of resources, development approaches and literatures were identified in the development of
this research that were not implemented or used to better the development process. Usability
validation of the 3D ball throw-in visualisation model is an approach suggested by Eldar &
Fisher-Gewirtzman [12]. The usability validation approach selects a specific part of the 3D model or
the entire 3D model, states a hypothesis for the usability of the 3D model and then takes the problem
to experts of that field for assessment. The experts assess the usability of the 3D model through a listProceedings 2020, 49, 110 5 of 6
of evaluation heuristics and determine whether that visualisation model serves its intended purpose
and if the alternative is appropriate for the problem driven visualisation task. Free3D is another
resource that could have been used to facilitate the development of the software. Free3D offers a free
avatar model framework, that could have been used instead of reinventing the wheel. Hence, the
development process of the 3D football sideline throw-in may have drastically improved through
additional research on more resources, development approaches and literatures that could simplify
the development process.
However, the software development approach had some aspects that could be improved in a
fuller implementation. Trade-offs due to the time constraints, the complexity of 3D development and
the associated learning curve were areas where further development is warranted. The current
development approach did not take into consideration the complexity of the development: however,
using a software sprint methodology allowed a trial and error approach to identify the software
tools and learn the technology. The first development sprint was allocated to gaining in depth
technical understanding of specific tools such as Blender, WebGL and Three.js. Merino et al. [13]
support the approach of the first sprint as a learning sprint through their study on overcoming
issues of 3D software visualisation. Consequently, incorporating learning sprints, using insights
from the literature would have possibly reduced time spent in the first phases of software
development, establishing software skills and appropriate technologies, making the development
process more efficient.
This research demonstrated that inertial sensors can be integrated into an IoT system with the
intention to further develop the processes into a teaching tool. The complexities in time series data
are essentially still there. However, this research concept has been tested through a persona model
that in a real scenario may give a sports scientist a quick analysis tool for performance feedback.
Therefore, in a teaching environment, this can be replicated for sports science students to effectively
learn how to gather and interpret the data.
In a virtual or augmented sense, the IoT phase should be implemented to build the
infrastructure that enables these realities to be utilised. Educating off campus students will be
possible where technologies facilitate an online learning environment that mirrors a sports science
laboratory class. Students will be able to remotely access the system at any time and manipulate the
environment for a learning experience that replicates an actual laboratory. Therefore, students will
be able to measure kinematic data, and in the case here of a soccer ball throw (e.g., joint angle
displacement, velocity, and acceleration, tangential and centripetal accelerations, angle of ball
release, velocity of the ball after release). Furthermore, assessment of competency and application
will also be possible. This will ultimately bring the learning and skill development for off campus,
distance-based sports science students closer in alignment to their in-class peers.
5. Conclusions
This study reports the first phase of research to design and develop a sports science teaching
tool that incorporates wearables, IoT, augmented, and virtual technologies. The ultimate outcome
will contribute to more digitally skilled sports industry professionals. This phase of the project
focused on how to capture and present 3D data visualisation of a sideline ball throw-in. This
solution can now be the basis for development into other sports and activities. While this phase was
IoT focussed, it enabled the road-mapping of the wider educational goals of the project. Through
literature reviews and interviews, several findings emerged identifying current IoT technologies and
an associated data visualisation system based on biomechanical kinematics. The following phases
will take the IoT knowledge and apply it to virtual and augmented realms for effective online
teaching capabilities to distance learners, a trend recently predicted to have a greater focus during
the next decade of tertiary education [14].
Acknowledgments: Appreciation is shown to the player for volunteering his time, and to the professionals who
participated in the small survey to gain insights of the industry needs.
Conflicts of Interest: The authors declare no conflict of interest.Proceedings 2020, 49, 110 6 of 6
References
1. Thompson, H. Performance enhancement: Superhuman athletes. Nat. News 2012, 487, 287–289,
doi:10.1038/487287a.
2. Ray, P.P. Internet of Things for Sports (IoTSport): An architectural framework for sports and recreational
activity. In Proceeding of the IEEE EESCO, Vizag, India, 24–25 January 2015; pp. 79–83.
3. Lee, J.; Wheeler, K.; James, D.A. Wearable Sensors in Sport: A Practical Guide to Usage and Implementation;
Springer Nature: Singapore, 2019; doi:10.1007/978-981-13-3777-2.
4. Ikram, M.A.; Alshehri, M.D.; Hussain, F.K. Architecture of an IoT-based system for football supervision
(IoT Football). In Proceedings of the IEEE 2nd World Forum on Internet of Things (WF-IoT), Milan, Italy,
14–16 December 2015; pp. 69–74, doi:10.1109/WF-IoT.2015.7389029.
5. Lee, J.B.; Ohgi, Y.; James, D.A. Sensor fusion: Let’s enhance the performance of performance
enhancement. Procedia Eng. 2012, 34, 795–800, doi:10.1016/j.proeng.2012.04.136
6. Rowlands, D.D.; James, D.A.; Lee, J.B. Visualization of wearable sensor data during swimming for
performance analysis. Sports Technol. 2013, 6, 130–136, doi:10.1080/19346182.2013.867965.
7. Rowlands, D.; Neville, J. Comparison of center of mass and chest based inertial sensors in the soccer
throw-in. J. Sci. Med. Sport 2010, 12, e38–e39.
8. Lee, J.B.; Mellifont, R.B.; Burkett, B.J. The use of a single inertial sensor to identify stride, step, and stance
durations of running gait. J. Sci. Med. Sport 2010, 13, 270–273, doi:10.1016/j.jsams.2009.01.005.
9. Pratt, A.; Nunes, J. Interactive Design: An Introduction to the Theory and Application of User-Centered Design;
Rockport Publishers: Beverly, MA, USA, 2012.
10. Dam, R.; Siang, T. Personas—A Simple Introduction-The Interaction Design Foundation. Available online:
https://www.interaction-design.org/literature/article/personas-why-and-how-you-should-use-them (accessed
on 9 November 2019).
11. Gothelf, J.; Seiden, J. Lean UX: Designing Great Products with Agile Teams; O’Reilly Media, Inc.: Sebastopol,
CA, USA, 2016; ISBN 9781491953600
12. Eldar, R.; Fisher-Gewirtzman, D. Usability validation of a real time three-dimensional visualization-
mapping model. Int. J. Interact. Des. Manuf. 2019, 1–15, doi:10.1007/s12008-019-00586-3.
13. Merino, L.; Bergel, A.; Nierstrasz, O. Overcoming issues of 3D software visualization through immersive
augmented reality. In Proceeding of the 2018 IEEE Working Conference on Software Visualization
(VISSOFT), Madrid, Spain, 22–25 September 2018; pp. 54–64.
14. Kelly, R. 6 Ed Tech Trends to Watch in 2020. Campus Technology. Available online:
https://campustechnology.com/Articles/2020/02/13/6-Ed-Tech-Trends-to-Watch-in-2020.aspx? (accessed
on 20/Feb/2020).
© 2020 by the authors. Licensee MDPI, Basel, Switzerland. This article is an open access
article distributed under the terms and conditions of the Creative Commons Attribution
(CC BY) license (http://creativecommons.org/licenses/by/4.0/).You can also read