Calculating Wheat Flour Consumption: Sources and Methods - Celeste Sununtnasuk International Food Policy Research Institute (PHND) - Food ...
←
→
Page content transcription
If your browser does not render page correctly, please read the page content below
Calculating Wheat Flour
Consumption: Sources and Methods

            Celeste Sununtnasuk
   International Food Policy Research Institute (PHND)
                  USAID SPRING Project

                Dar es Salaam, Tanzania
                 10-14 December 2013
Overview
• Wheat consumption trends in SSA
• Summary of consumption data needs and
  considerations
• Sources of wheat flour consumption data
  – Benefits and Limitations
  – Data examples
  – Comparisons of wheat flour consumption estimates across
    countries
• Estimating Consumption using HCES
  – Household Consumption → Individual Intake
  – Food Composition Tables (FCTs), Adult Male Equivalents (AME),
    Tolerable Upper Intake Levels (UL)
  – ADePT
Wheat Consumption* Trends in SSA
    *Based on FAOSTAT data and the disappearance method

• Between 2000 and 2009, per capita wheat
  consumption in SSA increased at a rate of
  0.35 kg/yr
• Consumption is expected to increase at an
  even faster rate in the future:
  – 670,000 MT to 1.12 million MT per yr between 2010
    and 2020
  – 770,000 MT to 1.28 million MT per yr between 2020
    and 2030

        Source: Mason, Nicole M, Jayne, T. S., and Bekele Shiferaw. (2012). Wheat Consumption in Sub-Saharan Africa:
        Trends, Dribers, and Policy Implications. East Lansing, MI: Michigan State University International Development
        Working Paper No. 127.
Wheat Consumption, Production and
Net Imports in SSA 1980-2009
Top Net Importers of Wheat
• The top 5 wheat imports in SSA (between
  2000-2009) account for 53% of wheat net
  imports, 64% of total consumption, and 44%
  of the population in the region:
    1.   Nigeria (23.0%)
                               Top Exporters
    2.   Sudan (10.7%)
                               United States: 34%
    3.   Ethiopia (8.2%)       Argentina: 15%
    4.   South Africa (6.6%)   Australia: 8%

    5.   Kenya (4.9%)
Potential Drivers of Demand
• Rising incomes
• Growing populations
• Urbanization
• Women’s participation in the labor force and
  the opportunity costs of time
• Wheat food aid
• Declining price of wheat relative to other
  staples (in countries such as Kenya and
  Nigeria)
Fortification Process
1.   Gather political and industry
     support
2.   Define the target population
3.   Collect baseline data
4.   Select the food vehicle(s)
5.   Estimate costs and secure
     finances
6.   Implement fortification
     program
7.   Food control and inspection
8.   Monitor and evaluate progress
9.   Impact analysis
What can consumption data tell us?
• The current consumption environment
• Baseline information on nutrient intake
• Frequency and quantities of
  fortification vehicle consumption
• Individual consumption
• Food acquisition
Cost-Benefit Analysis
• Overall objective:
  Make projections of possible reduced economic
  burden via wheat flour fortification and provide a
  cost-benefit projection.
• Consumption data needed:
  –   % of population consuming commercial flour and flour
      products
  –   Average kg of wheat flour consumed per person per year
      (among wheat flour consumers)
  –   Projected change in number of wheat flour consumers over 10
      years
  –   Projected change in flour consumption (kg/year) over 10 years
      (among wheat flour consumers)
Conditional vs. Unconditional
• Conditional mean quantity consumed
  – Total quantity consumed divided by the
    number of consumers of wheat flour

• Unconditional mean quantity
  consumed
  – Total quantity consumed divided by the
    total number of persons

    The numerators are the same, but the
           denominators differ!
Changes in Demand:
Consumers vs. Quantities
• Changes in wheat flour demand may
occur because of:
1. Consumers
− Changes in the number of consumers and the
proportion of households consuming wheat flour
(quantity remains constant)
2. Quantity
− Changes in the average quantity of wheat flour
consumed by those already consuming it
(number of consumers remains constant)
3. Consumers and Quantity
− Changes in both factorsAdditional Factors to Consider…
• Wheat extraction rates
• Wheat content estimates for
foods containing wheat flour
• How wheat flour is quantified
(weight vs. monetary)
• Methods for calculating
individual consumption from
household level dataWheat Flour Content Estimates
• Many data sources identify wheat flour and food items
which contain wheat flour
• This requires estimating wheat flour content in various
wheat flour products.
Food Item % Food Item % Food Item %
White bread
60% Crackers 90% Dried Pasta 90%
(European style)
Flatbread Wet/Cooked Pasta:
75% Biscuits and Cookies 60%
(unleavened) • Noodles
Whole wheat bread 75% Cake 55% • Spaghetti 28%
• Macaroni
Sweet breads 65% Pies and Pastries 35% • Other pasta
*Estimates provided by Quentin JohnsonSources of Consumption Data
• Individual Food Consumption Data
– 24-Hour Survey (diary, directly observed, weighed, or recall)
– Food Frequency Questionnaire
• Fortification Rapid Assessment Tool (FRAT)
• Household Consumption and Expenditure Surveys
(HCES)
• FAO Food Balance Sheets
• Industry Production Data
….but how available is the data? What are the benefits
and limitations of each source?General Availability of Data
Household Consumption
and Expenditure Surveys
24 Hour Recall
LESS AVAILABLE MORE AVAILABLE
Industry
FRAT FAO Food Balance Sheets
Food Frequency QuestionnairesSpecificity of Data
Household Consumption
and Expenditure Surveys
FAO Food Balance Sheets
LESS SPECIFIC MORE SPECIFIC
Industry FRAT
24-Hour Recall
Food Frequency Questionnaires24-Hour Recall • Recall and/or food weighing methods are used to account for individual consumption within the previous 24 hours • Food models, photographs, or weighing or volumetric estimation techniques • Often considered the “gold standard” source among nutritionists for food consumption data – But is it? • Recently conducted 24-Hour Recall Surveys – South African National Food Consumption Survey (1999) – Uganda Food Consumption Survey (2008) – Cameroon (2010)
24-Hour Recall
24 Hour Recall: Benefits
• High degree of accuracy (but only if
  administered correctly)
• Account for intra-household distribution of
  food
  − Quantitative estimates of individual diets
• Accounts for foods eaten outside of the home
• Open ended food consumption inquiries
  provide detailed estimates
  − Food items not limited to a predetermined list
  − Can include type of food preparation (raw, boiled, etc.)
  − Four passes approach (Gibson and Ferguson)
24 Hour Recall: Limitations
• Expensive, complex, and difficult to conduct
  – Few are available

• Often conducted regionally or for specific
  target populations
  – Small sample size
  – May not be statistically representative samples
  – Use for national food and nutrition work is questionable

• Conducted once, may not capture
  – Typical diet
  – Seasonality
Food Frequency Questionnaire
• Provides the frequency of consumption of
  foods over a given period of time
  – Typically one week to one year
• Most common method of measuring dietary
  patterns in large studies
• May be semi-quantitative
  – “typical” portion sizes
• Often combined with 24-hour recalls to
  provide estimates of normal diet patterns
Food Frequency Questionnaire
Food Frequency: Benefits
• Easy to conduct
• Captures individual diet patterns
• Longer recall periods better capture a
  “typical” diet and may account for
  seasonality
• Well suited for assessing the reach and
  coverage of fortification programs
Food Frequency: Limitations
• Does not assist with setting fortification levels
  – Cannot account for quantities consumed
• Longer recall periods
  – Less accurate responses
• Predetermined food lists
  – Exclude important food items (nutrient rich or
    food fortification vehicles)
• Does not distinguish food source
  (purchased, produced, etc.)
Fortification Rapid Assessment Tool
(FRAT)
• Developed by PATH Canada in
1997/98
• Designed to assist public health
program managers in designing
fortification programs
• Combine a simplified 24-hour
recall and Food Frequency
Questionnaire
• Collects representative,
quantitative data on the
consumption of food vehicles
among children (6 – 59 months)
and women of reproductive age
(16-45 years)FRAT: Benefits
• Designed specifically to assess consumption
patterns of fortification vehicles
• Collects additional, qualitative information
– Processing and storage of food vehicle
– Availability and ease of obtaining fortification
vehicle
• Can be added on to existing surveys,
including HCES, or implemented on its ownFRAT: Limitations • Surveys focus on food intake of potential food vehicles – Overall nutrient intake analysis is impossible • Conducted specifically for the purpose of designing fortification programs – Only conducted once, cannot measure trends • Targets population subgroups – Women of reproductive age (16 – 45 years) – Children (6 – 59 months) • Smaller sample sizes than HCES – Sample size recommended by FRAT is 210 households – Sample size and representativeness may vary dramatically
FRAT: Wheat flour
• FRAT survey countries in which wheat
  flour was a food vehicle of interest:
                         –   Burkina Faso, 1999
                         –   Cameroon, 2011
                         –   Congo, 2008
                         –   Guinea, 2001
                         –   Mali, 1999
                         –   Mauritania, 2002
                         –   Mozambique, 2010
                         –   Senegal, 2006
FRAT Results: Wheat Flour
Consumption among WRA
Median amount of wheat flour
% Consumed wheat flour, past week
Country, year Total N consumed on previous day (g/day)
of publication (in survey)
Burkina Faso,
840 48 % 83 % 15; 52; 41 % 49 g 65 g 21; 47; 55 g
1999
Cameroon,
912 92 % 98 % 90; 91 % 79 g 90 g 66; 71 g
2011
Congo,
1,050 68 % NA NA 85 g 133 g 76; 76; 68 g
2008
Guinea, 40; 74; 77; NA; 82; 110;
1,050 67 % 98 % 95 g 95 g
2001 42% 85 g
Mauritania, 108
225 88 % 99; 100 % 67 % 77; 130 g 91 g
2002 g
Mozambique,
2,506 92 % 96; 87; 91 % NA NA NA NA
2010
98; 115; 98
Senegal, 2006 840 93 % 99; 98 % 77; 98 % 104g 111 g
g
Source: Hess, Sonja Y., Brown, Kenneth H., Sablah, Mawuli, Engle-Stone, Reina, Aaron, Grant J. and Shawn K.
Baker. 2013. “Results of Fortification Rapid Assessment Tool (FRAT) surveys in sub-Saharan Africa and suggestions
for future modifications of the survey instrument.” Food and Nutrition Bulletin, 34(1): 21-38.FRAT Results: Wheat Flour
Consumption among Children
Median amount of wheat flour
Age % Consumed wheat flour, past week
Country, year consumed on previous day (g/day)
range
of publication
(months)
Burkina Faso,
12 – 36 57 % 88 % 19; 58; 62 % 32 g 30 g 15; 38; 40 g
1999
Cameroon,
12 – 59 94 % 97 % 90; 95 % 49 g 71 g 40; 49 g
2011
Congo,
12 – 59 67 % NA NA 67 g 67 g 59; 56; 59 g
2008
Guinea, 39; 74; 78; NA; 63; 49;
12 – 36 68 % 96 % 48 g 48 g
2001 51% NA g
Mauritania,
12 – 36 92 % 96; 96 % 79 % 66 g 66 g 46 g
2002
Mozambique,
6 – 59 81 % 84; 78; 81 % NA NA NA NA
2010
Senegal, 2006 12 – 59 91 % 96; 94 % 76; 98 % 65 g 65 g 62; 66; 60 g
Source: Hess, Sonja Y., Brown, Kenneth H., Sablah, Mawuli, Engle-Stone, Reina, Aaron, Grant J. and Shawn K.
Baker. 2013. “Results of Fortification Rapid Assessment Tool (FRAT) surveys in sub-Saharan Africa and suggestions
for future modifications of the survey instrument.” Food and Nutrition Bulletin, 34(1): 21-38.Household Consumption and
Expenditure Surveys (HCES)
• Large scale, multi-purpose, recurring
HH surveys, including:
– Household Income and Expenditure
Surveys (HIES)
– Household Budget Surveys (HBS)
– Integrated Household Surveys (IHS)
– Living Standards Measure Surveys (LSMS)
– Welfare Monitoring Surveys (WMS)
• Generally representative at a
subnational (regional or state) level
• Detailed information on household
food acquisition and consumptionHCES: Global Coverage
Population covered by Population covered by
Region at least one survey in at least one survey in
WDR 1990 (%) WDI 2008 (%)
East Asia 85 96
East Europe & Central Asia 21 98
Latin America 55 98
Middle East & North Africa 11 79
South Asia 95 98
Sub-Saharan Africa 6 92
Total 65 95
WDR: World Development Report. WDI: World Development Indicators.
Source: Ravaillon M. Global poverty measurement: Current practices and future challenges.
http://sites.nationalacademies.org/PGA/sustainability/foodsecurity/PGA_060826Calculating Quantities from Wheat
Consumption Module
2. Multiply food items by % 3. Sum kg of wheat flour
wheat flour content before consumed per week and
calculating quantity multiply by 52 to get
consumed kg/yr average.
4. Add all household
wheat consumption
1. Identify food items estimates, and apply
containing wheat flour Adult Male Equivalents
(AME) approach to
estimate individual
consumption of wheat
flour.**
**Some food items will be
listed in volumetric units and
will need to be converted to
kg equivalents.HCES: Variations
• Data capture methods
– Diary approach (with multiple visits) versus recall (periods
vary)
• Method of food acquisition
– Consumption from own production may not be asked or
asked about only a subset of foods
• Quantitative measures
– Sometimes only expenditure levels are reported, not food
quantities
• Food lists
– Number and types of foods vary
• What is measured:
– Distinguishing food purchased and food consumedHCES: Variations
• General statements are challenging to
make because HCES are diverse.
• What we judge to be strengths and
shortcomings depend on:
– General survey characteristics: the particular
type of survey (i.e., NHBS, LSMS, HIES, etc.)
– Country-specific characteristics: How the survey
was designed and implemented in a country,
and how the data was processed
– Specific issues / applications of interestHCES: Benefits
• Nationally representative
– Representative at subnational (regional, provincial/state,
or district) level
• Detailed consumption data
• Already being conducted, paid for and
processed
– HCES costs are about 2% the cost of a 24HR survey
• HCES are routinely, periodically updated
(generally once every 3-5 years, and largely
dependent on funding)HCES: Limitations
• A mixture of food acquisition and food
consumption
– Acquisition is likely to be greater than consumption
– Food categories are more likely to report foods as
commodities as opposed to food that is ready-to-eat
• Units of measurement may not be standardized
– May have a common name, but not a common metric
(e.g., heap, bunch, etc.)
• Recall period may be too long to be accurate, too
short to reflect “usual intake”HCES: Limitations
• Food consumed away from home is often not
asked about and, when it is, is likely to be under-
reported
• Predetermined food item lists may not be specific
enough
– Processed foods may be underreported
• Unit of analysis: Household level data, not individual
level
– To analyze nutrition status, it is necessary to make some
assumptions about the intra-household distribution of the
foods acquiredHCES Data
• International Household Survey
Network (IHSN)
– Central Data Catalog provides searchable
metadata from thousands of surveys and
censuses conducted in low- and middle-income
countries
– Often include the questionnaires, resource
manuals, and survey reports
www.ihsn.orgIHSN Website
IHSN Survey Catalog
HCES Surveys
Country          Year                           Survey                           # of Households
                           Questionnaire Unifié sur les Indicateurs de Base du
Burundi          1998                                                                 6,688
                                                Bien-être
                             Employment, Informal Sector and Household
DRC            2005/2006                                                              4,715
                                       Consumption Survey
Ethiopia         2000         Household Income and Expenditure Survey                16,672
Kenya          2005/2006         Integrated Household Budget Survey                  13,390
Malawi           2004        Malawi Second Integrated Household Survey               11,280
Mozambique       2002      Questionário de Indicadores Básicos de Bem-Estar           8,700
Rwanda         2005/2006    Integrated Household Living Conditions Survey             6,378
South Africa     2000            Income and Expenditure Survey 2000                  26,263
Tanzania         2000             Tanzania Household Budget Survey                   22,718
Uganda         2002/2003          Uganda National Household Survey                    9,711
Zambia           2006             Living Conditions Monitoring Survey                19,560
Zimbabwe       2007/2008    Income, Consumption and Expenditure Survey                 ?
HCES: Recall Methods
Recall Method Recall Period
Country Diary (Visit to
Recall Period Diary (Days
Interview Diary Both Illiterate HHs
(Days) Recorded)
every X days)
Burundi X 15
DRC X 15
Ethiopia X 7
Kenya X 7
Malawi X 7
Mozambique X 14 7 2
Rwanda X NA*
South Africa X 30
Tanzania X 7
Uganda X 7
Zambia X 14
Zimbabwe X 7HCES: Food Items and Acquisition
Expenditure Food Food
Number Consumption Gifts, In-
(X) or Food Acquired Consumed
Country of Food
Quantity (Q) from from
from Own Kind,
Items Production Other
Reported? Purchases Purchases
Burundi 32 X X X X
DRC 500 Q
Ethiopia 224 Q X X X
Kenya 162 Q X X X X
Malawi 115 Q X X X
Mozambique 332 Q X X
Rwanda 151 Q/X X
South Africa 122 X
Tanzania 135 Q X X X
Uganda 58 Q
Zambia 36 Q X X X
Zimbabwe 179 Q X X XWheat Flour and Products
Wheat flour and food items containing wheat flour reported in HCES:
Wheat Wheat Wheat Flour
Country Flour (Whole Grain)
Bread Cakes Biscuits/Scones Pasta
Products
Burundi
DRC
Ethiopia
Kenya
Malawi
Mozambique
Rwanda
South Africa
Tanzania
Uganda
Zambia
Zimbabwe Wheat Flour Consumption
100%
90%
80%
70%
% of Population
60%
47.9%
50%
40%
30%
21.0%
17.3%
20%
10%
0.6% 0.6% 1.8%
0%
National Rural UrbanWheat Flour Consumption (Extended)
100% 94.4%
90%
79.0%
80%
70%
62.5%
% of Population
60%
50%
40% 33.0% 35.2%
28.9%
30%
20%
10%
0%
National Rural UrbanBread Consumption (HCES)
100%
87.8%
90%
80%
70%
% of Population
60%
50.4%
50%
40% 33.2%
26.7%
30% 19.6%
15.6% 16.0%
20% 12.9%
10.1%
10%
0%
National Rural UrbanFood Balance Sheets • Developed by the Food and Agricultural Organization (FAO) of the United Nations • National food accounts, supply/utilization accounts, food disappearance data, and food consumption level estimates – Provides supply data • Most commonly used data for estimating national diet patterns, levels, and trends
Food Supply (vs. Consumption)
• Supply is determined as:
      Total quantity produced
             + Imports
             - Exports
             - Qty. used for Feed and Seed
             - Storage and Transportation Losses
      = Total food available for human consumption

Total food available/Total population = Per capita
consumption
FAOSTAT http://faostat.fao.org/site/354/default.aspx
Food Balance Sheets

                    2. Select most recent year

1. Select country

                                       3. Click on “show data”
Food Balance Sheets
5. Food supply quantity
4. Identity Fortification Vehicle 6. Multiply by extraction rateFood Balance Sheets: Benefits
• Provide data from 1961-2009
– Able to demonstrate long-term trends in national
food supply
• Low cost and highly accessible
• May be used to suggest which nutrient
inadequacies might be common in the
population due to nutrient availability
– Only at the aggregate level and to a limited
extent
– Focus mainly on staplesFood Balance Sheets: Limitations • Data limited to primary commodities and minimally processed foods – Data for wheat, not wheat flour • Provides supply, not demand, estimates • Cannot provide coverage estimates – Unconditional estimates – Who are the consumers? Where are they located? – How much of the food item is purchased? • Lengthy delays in updating annual FBS figures – Most recent data available is for 2009
Changes in Wheat Supply, 1989-2009
                      (kg/person/year)
                 70

                 60

                                                                                       Burundi

                 50
                                                                                       DRC
                                                                                       Ethiopia
Kg/Person/Year

                                                                                       Kenya
                 40                                                                    Malawi
                                                                                       Mozambique

                 30
                                                                                       Rwanda
                                                                                       South Africa
                                                                                       Tanzania
                 20                                                                    Uganda
                                                                                       Zambia

                 10
                                                                                       Zimbabwe

                 0
                      89 90 91 92 93 94 95 96 97 98 99 00 01 02 03 04 05 06 07 08 09

                                                   Year
% Change 1989 – 2009
% change in per capita wheat supply (kg/person/year) 1989-2009
Zimbabwe 15.7%
Zambia 45.5%
Uganda 975.0%
Tanzania 221.2%
South Africa 15.8%
Rwanda 436.8%
Mozambique 252.9%
Malawi 42.2%
Kenya 88.0%
Ethiopia 61.6%
DRC 22.2%
Burundi 95.7%
0% 100% 200% 300% 400% 500% 600% 700% 800% 900% 1000%Industry Data
• Industry data from millers can provide
important consumer information, such as:
– market share
– where (e.g. what regions) products are shipped
– accurate milling extraction rates
• However, millers may be hesitant to disclose
private business information
– Often report production capacity, rather than actual
production
• Supply-side rather than demand-side dataDiscussion • Consumption data is needed throughout the food fortification process: – Needs assessment – Feasibility Assessment and Program Design – Program Baseline – Program Monitoring – Impact Evaluation • Is there a right source of consumption data for each application?
Discussion
• Each data source has its strengths and weaknesses,
  there is no single “gold standard”
• Each source and method may be better suited for
  particular applications than others
• Tradeoffs will exist between the degree of validity
  and accuracy, and cost
• Potential bias and error for each method must be
  taken into consideration when interpreting results
• Some of the weaknesses may be corrected for
   – Household Consumption and Expenditure Surveys, in
     particular
Thank you
Questions?
Celeste Sununtnasuk
International Food Policy Research Institute (IFPRI)
C.Sununtnasuk@cgiar.orgHousehold Consumption and
Expenditure Surveys: A Tool for
Estimating Food and Nutrient Intake
Celeste Sununtnasuk
International Food Policy Research Institute (IFPRI)
USAID SPRING Project
Dar es Salaam, Tanzania
10-14 December 2013A Tool for Better Understanding...
1. Diet and dietary patterns
2. Key food sources of essential micronutrients
3. Regional variations in diet
4. Seasonal variations in diet & food security
5. Designing fortification programs &
estimating their impacts
6. Food markets
7. Harmonizing portfolios of nutrition programs
63Cost, Frequency and Availability
• Already being conducted, paid for and
processed
– Cost of a nutrition analytic file based on typical 24HR
survey (8,500 HHs): $2.3 million
– Cost of a nutrition analytic file from already processed
HCES data: $40,000
– HCES costs are about 2% the cost of a 24HR survey
(Source: Fiedler, Martin-Prevel & Moursi, 2011)
• HCES are routinely, periodically updated
(generally once every 3-5 years)Understanding the Diet
Why is this so important?
• We need a good understanding of an
individual’s
– Overall nutrient intake
– Key sources of micronutrients
– Bioavailability of nutrients
to establish safe fortificant levels with the
appropriate fortification vehiclesEx: Sources of Energy in Uganda
Dietary Diversity: Sources of Energy by Food Groups
Uganda
Average dietary energy
Average dietaryconsumption (kcal/person/day)
energy consumption (kcal/person/day)by food group
1078
391
176 139
91 44 65 81 85
35 31 19Fortificant Levels
• Where to get them? Bureau of standards
and regulations
• What do we assume about their levels?
– Are they at the plant?
– At retail?
– At the household taking into account how foods
are prepared and consumed?
• Losses
• Bioavailability
• Current population intakeCalculating Individual Consumption
and Nutrient Intake
• HCES provide consumption data at the
household level
• How do you calculate individual
consumption and nutrient intake?
– Calculate total household consumption of each
food item
– Match food items with items listed in country-
specific Food Composition Tables (FCTs)
– Apply Adult Male Equivalents (AMEs) conceptFood Composition Tables (FCTs) • Provide the nutrient content per 100g of edible food • How precise are they? • How unambiguously can they be matched to the HCES food item list?
UNPS: Consumption Module 56 Food Items
HarvestPlus FCT
Nutrient Content per 100g of Edible Food
>700
Food ItemsCalculating Adult Male Equivalents
• The Adult Male Equivalent (AME)
– An expression of household food intake that
accounts for the composition of the household
and allows the direct comparison of food or
energy intakes of households of different sizes
and compositions
• Individual AMEs are divided by total
household AMEs, to estimate the
intrahousehold distribution of foodAdult Male Equivalents (AMEs)
ADULT MALE EQUIVALENT
MALE AGE (y) FEMALE
0.216721311 0 -1 0.216721311
0.311475410 1 -2 0.278688525
0.368852459 2 -3 0.344262295
0.409836066 3 -4 0.377049180
0.442622951 4 -5 0.409836066
0.483606557 5 -6 0.434426230
0.516393443 6 -7 0.467213115
0.557377049 7 -8 0.508196721
0.598360656 8 -9 0.557377049
0.647540984 9 -10 0.606557377
Adult males, 0.704918033 10 -11 0.655737705
0.770491803 11 -12 0.704918033
age 18-30 y, are 0.836065574 12 -13 0.745901639
the benchmark 0.909836066 13 -14 0.778688525
for comparison 0.983606557 14 -15 0.803278689
1.040983607 15 -16 0.819672131
1.090163934 16 -17 0.819672131
1.114754098 17 -18 0.819672131
1 18 -30 0.786885246
0.967213115 30 -60 0.770491803
0.803278689 60 -150 0.688524590Ex: Rice Consumption, AMEs
SEX AGE (y) AME HH AME IND AME
Female 60 0.68852 3.61475 0.19048
Female 30 0.77049 3.61475 0.21315
Female 11 0.70492 3.61475 0.19501
Male 40 0.96721 3.61475 0.26757
Male 5 0.48361 3.61475 0.13379
Total Household consumption of rice: 1,571.43 g
Individual consumption (not using AMEs):
1,571.43 g ÷ HH size = 314.26 g per person
Individual consumption (using AMEs):
Female, 60: 299.32 g
1,571.43 g x Individual AME =
Female, 30: 334.95 g
Female, 11: 306.45 g
Male, 40: 420.47 g
Male, 5: 210.24 gCalculating Nutrient Adequacies
• How do we determine whether or not
someone is deficient in a specific
nutrient?
– If nutrient intake is below the corresponding Estimated
Average Requirement (EAR)
– Probability approach for iron
• How do we determine if nutrient intake
is excessive?
– If intake exceeds the Tolerable Upper Level Intake (UL) for
the age and sex of the individualEstimated Average Requirements
(EARs)
ESTIMATED AVERAGE REQUIREMENT
AGE GENDER STATUS IRON (mg/d) VITAMIN A (µg/d) ZINC (mg/d) FOLATE (µg/d)
1 0-6 mos. Both .27 (AI) 400 (AI) 2 (AI) 65 (AI)
2 6-12 mos. Both 6.9 500 (AI) 2.5 80 (AI)
3 1-3 y Both 3 210 2.5 120
4 4-8 y Both 4.1 275 4 160
5 9-13 y Male 5.9 445 7 250
6 9-13 y Female 5.7 420 7 250
7 14-18 y Male 7.7 630 8.5 330
8 14-18 y Female NPNL 7.9 485 7.3 330
9 14-18 y Female P 23.0 530 10.5 520
10 19-30 y Male 6.0 625 9.4 320
11 19-30 y Female NPNL 8.1 500 6.8 320
12 19-30 y Female P 22.0 550 9.5 520
13 31-50 y Male 6.0 625 9.4 320
14 31-50 y Female NPNL 8.1 500 6.8 320
15 31-50 y Female P 22.0 550 9.5 520
16 51-70 y Male 6.0 625 9.4 320
17 51-70 y Female 5.0 500 6.8 320
18 >70 y Male 6.0 625 9.4 320
19 >70 y Female 7.0 500 6.8 320
NPNL= Non-pregnant, Non-lactating P = Pregnant AI = Average IntakeTolerable Upper Intake Level (UL)
TOLERABLE UPPER INTAKE LEVEL
AGE GENDER STATUS IRON (mg/d) VITAMIN A (µg/d) ZINC (mg/d) FOLIC ACID (µg/d)
1 0-6 mos. Both 40 600 4 ND
2 6-12 mos. Both 40 600 5 ND
3 1-3 y Both 40 600 7 300
4 4-8 y Both 40 900 12 400
5 9-13 y Male 40 1,700 23 600
6 9-13 y Female 40 1,700 23 600
7 14-18 y Male 45 2,800 34 800
8 14-18 y Female NPNL 45 2,800 34 800
9 14-18 y Female P 45 2,800 34 800
10 19-30 y Male 45 3,000 40 1,000
11 19-30 y Female NPNL 45 3,000 40 1,000
12 19-30 y Female P 45 3,000 40 1,000
13 31-50 y Male 45 3,000 40 1,000
14 31-50 y Female NPNL 45 3,000 40 1,000
15 31-50 y Female P 45 3,000 40 1,000
16 51-70 y Male 45 3,000 40 1,000
17 51-70 y Female 45 3,000 40 1,000
18 >70 y Male 45 3,000 40 1,000
19 >70 y Female 45 3,000 40 1,000
NPNL= Non-pregnant, Non-lactating P = PregnantDietary Reference Intakes
WHO Nutrient Recommendations
Footnotes 1. These estimated levels consider only wheat flour as the main fortification vehicle in a public health program. If other mass- fortification programs with other food vehicles are implemented effectively, these suggested fortification levels may need to be adjusted downwards as needed. 2. Estimated per capita consumption of
Ex: 2008 UFCS
• 24-hour recall conducted in three regions of Uganda to
determine
– Food intake and nutrient inadequacies
– Adequacy of mass fortification
• Sample
– Children, 24-59 months
– Women, 15-49 years
– Central (Kampala), and rural Western and Northern regions
• After calculating dietary intakes and accounting for
existing interventions
– The WHO recommended fortificant levels for folic acid and
vitamin A for populations consumingEx: 2010/2011 Cameroon
• Combined FFQ and 24-hour recall conducted in Cameroon to
asses potential fortification vehicles (vegetable oil, wheat
flour, sugar, and bouillon cube)
• Sample
– Children, 12-59 months
– Women, 15-49 years
– 3 ecological zones (north, south, large cities)
• Consumption of fortifiable foods varied by ecological
zone and socioeconomic status
– Lower SES groups were less likely to consume fortifiable foods and
consumed less amounts
• Micronutrient inadequacy greatest in the north, lower SES
groups, and children
Source: Engle-Stone, Reins, Ndjebayi, Alex O., Nankap, Martin, and Kenneth H. Brown. 2012. “Consumption of potentially
fortifiable foods by women and young children varies by ecological zone and socio-economic status in Cameroon.” The Journal of
Nutrition, 142(3): 555-565.Ex: Cameroon
Amount of fortifiable foods consumed in the previous day (g/d)
**bouillon cubes in tenths of g/d
100 100
90 90
80 80
70 70
60 60
50 50
40 40
30 30
20 20
10 10
0 0
National South North Large Cities National South North Large Cities
Vegetable Oil Wheat Flour Sugar Bouillon Cube Vegetable Oil Wheat Flour Sugar Bouillon Cube
Women ChildrenEx: Cameroon
• Before coverage data was available, a preliminary
decision was made to fortify vitamin A
• But coverage turned out to be relatively low….
Proportion of Cameroonian women consuming fortifiable foods at least once in previous week
**Food Frequencies listed above (number of times consumed in previous week)
100% 14 14 14 11 13
8 7 7
90% 7 10
7 7
80% 6
70%
60% 9 12
50%
5
40%
30%
20%
10%
0%
National South North Large Cities
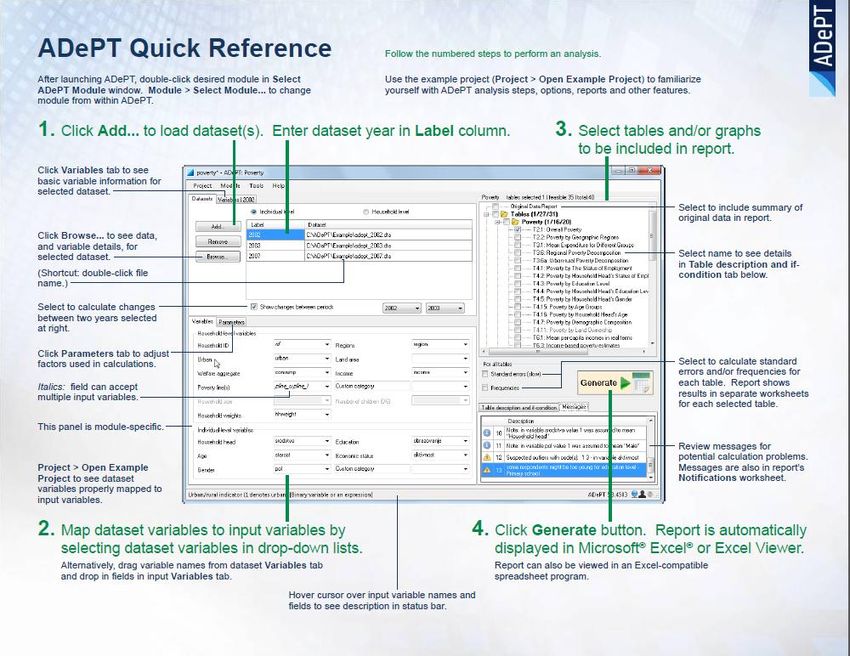
Vegetable Oil Wheat Flour Sugar Bouillon CubeADePT • Automated DEC’s Poverty Tables • Developed in collaboration between the FAO statistics division and World Bank • Food Security module can produce indicators from consumption data collected in household surveys – Consumption of calories and micronutrients – Availability of micronutrients and amino acids – Distribution of calories – Proportion of people undernourished
Food Security Module
Levels of Data • Household − Size − Region − Area • Individual − Age − Gender − Height − Relationship to HH head • Food − Item code − Unit of quantity − Monetary value • Country − FCT − Vitamins, minerals, etc.
Improving HCES • To date, HCES have been overwhelmingly used only as a source of data for secondary data • How much could HCES be strengthened to collect more relevant and precise data for food and nutrition analysis?
Shared Agenda for Improvements • Standardizing units of measure • Better capturing food away from home • Improving the food item list • Optimizing the recall period • Distinguishing consumption and acquisition • Collecting more information about individual consumption
Thank you

                           Questions?

Celeste Sununtnasuk
International Food Policy Research Institute (IFPRI)
C.Sununtnasuk@cgiar.orgYou can also read