Multi-city Working Group June 23, 2020 - San Mateo County ...
←
→
Page content transcription
If your browser does not render page correctly, please read the page content below

Multi-city Working Group
                          June 23, 2020

RICAPS technical assistance is available through the San Mateo County Energy Watch program, which is
funded by California utility customers, administered by Pacific Gas and Electric Company (PG&E) under
the auspices of the California Public Utilities Commission and with matching funds provided by C/CAG.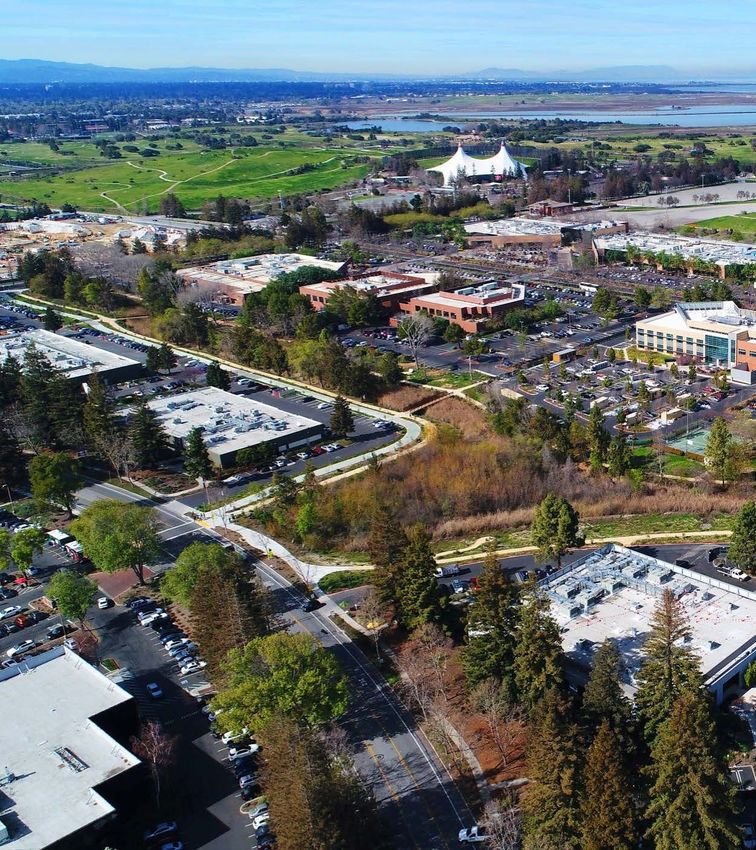
Agenda
•   Teleworking: Now and Post COVID-19
•   Employee Commute Surveys
•   Community GHG Inventories Transportation Data
•   VMT Modeling
•   Streetlight Data
•   Google Transportation Data
•   Final Announcements


Commute.org Mission

Reduce SOVs traveling to, from or through San Mateo County

Telework
Considerations During
COVID-19
What is the long-term fate of telework?
Applicable to
some

Not all roles and workplaces are able or suited
for telework and in varying degrees.
Reminder to support all modes of commuting.

Organizational
Strategy
vs.
COVID mitigation

Those experiencing telework for the first time
are doing so through a pandemic lens rather
than a scenario driven by internal policy.

Current
Conditions

Some factors that won't apply post-pandemic:
kids at home, distancing, viral transmission,
sanitation, government guidelines.

About half

Employees returning to work onsite
Bay Area traffic levels
US CFOs surveyed whose companies will
telework long-term.

Too soon to tell

How much employers will "stick" to telework
when no longer bound to public health.
Impacts on workplace culture and recruitment.
Adding to Bay Area flight
Post-vaccine and economic recovery
Note observations, learnings, experiences
Gather data with a grain of salt. Shifts in performance, cost-benefit
analysis, employee morale, managment's preconceptions, resistance, or
embrace of telework.

Get grounded in your own organization's stance
Telework as an operational strategy, as workplace culture, as an
environmental principle of your workplace.

Cities and telework initiatives (along with other
commute modes)
How to incentivize, partner, or plan in ways financial or otherwise.
virada@commute.org
       rebecca@commute.org

     Connect with us
Getting Back to Work
                Safe
                 Telework
             Bike to Work
Matthew Petrofsky, County of San Mateo How are cities thinking about tracking employee commute emissions this year?
Breaking Down Community
GHG Emission Inventories
Part 2: Transportation
Process

General Calculation: Usage x Emissions Factor = Emissions

   Determine                  Determine
               Gather Usage               Calculate
   Emission                   Emissions               Share!
                   Data                   Emissions
    Sources                    Factors
Determine Sources
Emission sources include:
– On-Road
• Passenger vehicles
• Commercial transport
• Public Transportation
– Off-Road
• Farm equipment
• Airport ground support (does not
include planes)
• Small-engine equipment
– Lawnmowers
– Leafblowers
– BoatsDetermine Methodology
• Origin-Destination Method Vs. In-Boundary Method
Origin-Destination In-Boundary
Localized model Data readily available for all
jurisdictions
Removes non-local “pass-through” More likely to include trips that only
trips pass through jurisdiction
• Different jurisdictions in San Mateo County use different
methodologies
• Results can vary drastically and are not comparable
(consistent methodology should be used)
• Both are commonly used outside of San Mateo CountyGather Usage Data
• Usage data is generally measured in VMT
– In-Boundary VMT is calculated using the annual
Caltrans Highway Performance Monitoring
System Report
– Origin-Destination VMT data is requested from
MTC
• Usage data for trains is estimated based on
National Transit Database and State Rail Plan
– Includes Caltrain and freight trains
• Off-road emissions are estimated using the
CARB Offroad 2007 model
– Pieces of this model are currently being updated
for 2021Emissions Factors
• The multiplier that gets us from usage to
CO2e
• Transportation
– On-road emissions are modeled using
the CARB EMFAC 2017 Model
• Estimates MPG and vehicle mix
• MTC provides a daily VMT to Annual VMT
conversion factor
– Off-road emissions are modeled using the
CARB Offroad 2007 Model
• Provides emissions directly from the modelData Considerations
• HPMS VMT Corrections
– In 2014, it was found that a Linear Referencing System was overestimating
mileage.
– As a result maintained mileage reported in past years has fluctuated significantly
but is mostly resolved as of 2018.
• Model Maintenance
– Models are built at a point in time and must be maintained as new information is
available.
– Older models that are updated may have outdated assumptions (ie. CARB
Offroad 2007)
• Timing of data availability
– Emission factors need to be verified and are not immediately available
– VMT Estimates from Caltrans typically run 2 years behindCalculate Emissions • Final step to estimate CO2e • Combines usage data and emissions factors • Template spreadsheet used for all 21 jurisdictions • Followed by QA/QC
Next Month:

Part 3: Waste, Wastewater and Water Emissions

           QUESTIONS?
Using Activity-based Travel Models to Aid Climate Action Plan Development Harold Brazil Metropolitan Transportation Commission RICAPS Webinar June 23, 2020
Local Community GHG Emission
Requirements

•   Local governments in California are being asked to reduce GHG
    emissions 15% from current levels by 2020 (with an ultimate state-wide
    goal of 80% reductions by 2050)
•   15% reduction from this level would actually constitute a 30%
    reduction by 2020
            (as an example, a community’s GHG emissions could
            continue to grow 20% plus over that time period if
            unchecked)
•   Local governments have broad influence and, in some cases, exclusive
    authority over activities that contribute to significant direct and
    indirect greenhouse gas emissions through their planning and
    permitting processes, local ordinances, outreach and education efforts,
    and municipal operations
Geographical Boundary Method: A geographical boundary–based estimate captures all daily VMT on a roadway network within a specified geographic area. This geographical boundary–based estimate includes local trips within the specified area plus interregional travel that does not have an origin or destination within the geographic area. Local Communities Need To Estimate The VMT That They Are Responsible For - Not “Passing Through” VMT
Activity Based Travel Demand Modeling
Approach
Travel Model One operates on a synthetic population that includes representative
households and person for each individual household and person in each county of the
Bay Area region – both in the base year and in forecast years
A series of travel-related choices are simulated for each household and per within each
household; these choices are include:
• Usual workplace and school location         • Non-mandatory tour frequency,
• Household automobile ownership              destination and scheduling
• Daily activity pattern                      • Tour travel mode
• Work/school tour frequency and              • Stop frequency and location
scheduling                                    • Trip travel mode
• Joint non-mandatory tour frequency,         • Parking location choice
 party size, participation, destination and   • Vehicle Trip Assignment
scheduling
Modeling Framework
Origin-destination (OD) Method: Tracks all the
vehicle trips generated within a geographic area
across the entire network to their ultimate
destinations and isolates the daily VMT as follows:

1. Internal-internal (II): All daily trips made entirely
   within the study jurisdiction.

2. One-half of internal-external (IX): One-half of daily
   trips with an origin within the study jurisdiction and
   a destination outside of this jurisdiction.

3. One-half of external-internal (XI): One-half of daily
   trips with an origin outside the study jurisdiction
   and a destination within this jurisdiction.

4. External-external (XX): Trips through the study
   jurisdiction are not included because the study
   jurisdiction cannot implement policies that
   influence the trip-making behavior.
Demand: Triptable with                   Supply: Highway Network
Origins and Destinations                 Defines Trip Paths

                     Travel Assignment
Travel Segmentation Approach
Person categories:
– Live in the jurisdiction/work in the jurisdictions;
– Live in the jurisdiction / work outside the jurisdiction;
– Live in the jurisdiction / non-worker;
– Live outside the jurisdiction / work in the jurisdiction
– Live outside the jurisdiction / work outside the jurisdiction; and
– Live outside the jurisdiction / non-worker;
Travel categories:
– Trips that both begin and end within the jurisdiction;
– Trips that either begin or end within the jurisdiction;
– Trips that neither begin nor end within the jurisdiction.Sample Output source: http://capvmt.us-west-2.elasticbeanstalk.com/data
Supplemental Calculations
• Commercial Vehicle (Truck) Emission Estimates
  - EMFAC generated County Level Commercial Vehicle Inventory
  - Longitudinal Employment Household Dynamics (LEHD)

• Daily to Annual Estimate Conversions
  - Caltrans Performance Measurement System (PeMS) Data

• Speed Adjusted – County Specific Emission Rates
  - Model One Vehicle Activity Data
  - EMFAC Emission Rate Calculation
Source - https://onthemap.ces.census.gov/

                                            Source - http://pems.dot.ca.gov
COVID-19 Pandemic + Likely Recession:
Near-Term versus Longer-Term Impacts on Plan Bay Area 2050
• Regional Growth Forecast: significant economic impacts are being integrated into
forecast years 2020-2029, even as the region’s long-term potential likely remains strong.
• Revenue Estimates: revenue assumptions from early years of planning cycle are being
adjusted downward to reflect likely year 2020 recession; assumed years of potential
revenue measures can be shifted back based upon board direction.
• External Forces: staff are proposing an accelerated growth rate of telecommuting to the
California Air Resources Board, which has a regulatory role in Plan Bay Area 2050.
• Public Engagement: in addition to more webinars, staff will present a refreshed approach
for summer 2020 public engagement activities, including “virtual” public workshops.
• Implementation Plan: the short-range Implementation Plan will be able to identify
actions MTC/ABAG can take to tackle shared challenges in partnership with local
jurisdictions, non-profits, and the private sector.
Final Blueprint: with regards to longer-range strategies, the public, stakeholders, and elected officials will also be
able to provide further input and direction via the Final Blueprint phase this summer.What specific modifications are being made to the first
decade of the Regional Growth Forecast?
HISTORICAL TRENDLINE PRE-COVID FORECAST ADJUSTED FORECAST
Jobs Jobs Jobs
Smoothed Near-Term
COVID-19 Trendline Economic
Pandemic Cycle
Smoothed
Trendline
Great
Recession
Dot-Com
Bust
2020 2020 2030 2020 2030
Consistent with our overall approach, we are integrating data in the early years of the planning period on economic peaks and troughs,
while recognizing uncertainty with regards to timing of future peaks and troughs in the decades beyond (e.g., smoothed trendline).Thank You! • Speaker Contact: Harold Brazil, Air Quality Planner/Analyst Metropolitan Transportation Commission (415) 778-6747; hbrazil@bayareametro.gov
WHO IS C/CAG?

• Congestion Management Agency for San Mateo County
• Active Transportation, Stormwater, Airport, Travel
  Demand Management, and much more
• 21 Member Agencies make up the Joint Powers Authority
• Focus on improving quality of life for residents
WHAT IS
   STREETLIGHT
      DATA?

• Big Data for Mobility
• Make it easy, affordable and
  intuitive to incorporate
  transportation and mobility
  behavior into important
  decisions throughout the world.
Local Received requests from Local Jurisdictions regarding procurement
Interest possibilities
Data Set Provide robust and thorough data and analysis tools
WHY C/C AG
WANTED Run Ability to run traffic analyses multi-modally in house
STREETLIGHT Analyses
DATA
Increase Such powerful tools can help save time and money
Efficiency
Opportunity Utilize the technology available acting as a leader for innovationWHAT MAKES UP STREETLIGHT DATA?
STREETLIGHT'S
      PRIVACY POLICY

• Collects anonymized information
     • Requires suppliers to de-identify devices
• All data is archival
• Layered on top of publicly available U.S.
  Census Data
C ASE STUDY: CUT THROUGH TRAFFIC MITIGATION ANALYSIS • Problem with driver cut through traffic with GPS apps • City implemented turn restrictions and ramp meters • Goal: Evaluate effectiveness • StreetLight was able to create before and after analysis using origin and destination data • City discovered the results were effective
C ASE ST U DY: ME ASU R I NG
     C Y C L I NG’S E C ONOMI C I MPAC T

• High rate of bicycle tourism, but needed accurate data
  to improve facilities
• Committee Goal: measure economic impact
• Analyzed what percent of cyclists were visitors
• StreetLight used origin and destination methods to
  determine visitor activity and spending
• Committee was able to show justification for facilities
HOW CAN WE USE THIS LOCALLY? • Use data to develop plans • Bicycle and Pedestrian Network for Active Transportation Plan • Travel Demand Model • Traffic count analysis • Guide funding decisions • Layering of Census and in house data to guide community level investment
DISCUSSION QUESTION:
HOW DO YOU THINK YOU COULD USE
       STREETLIGHT DATA?
THANK YOU! QUESTIONS?
Mikaela Hiatt
mhiatt@smcgov.orgEnvironmental Insights Explorer Helping civic leaders build a more resilient, sustainable and thriving world
At Google, we strive to build sustainability
         into everything we do
Global Global solar air quality potential Project Air View Project Sunroof Global Global Global forests water fishing
Our mission
Catalyze positive social and
environmental impact at scale
using Geo’s understanding of the
real world
of global emissions are
70%   attributable to cities
Help deliver on sustainable
and equitable outcomes
Climate + Health + Economy
North Star

 Help cities reduce their carbon emissions by
more than 1 billion tons of CO2 per year by 2025
Data        Time

Data access is
limited and costly
                     Expertise   Resources
Environmental Insights Explorer In partnership with
$4.1M in grants to
support city climate plan
implementation projects
Granular Geo data, privacy-safe aggregation
 + deep expertise in ML, analytics, and UX
01 Estimate building emissions

02 Measure annual transit activity

03 Identify CO2 reduction opportunities

04 Capture air quality measurements
Transportation emissions

Location data from Google
Maps can be used to measure
annual transit activity, infer
traffic modes, and estimate
emissions
While EIE algorithms are not yet designed for
          high temporal resolution,

EIE has conducted validations across multiple
     cities, with hourly and daily intervals
In Boulder CO, hourly ground truth samples
consisted of 76,000+ vehicles
across a 3-day periodCorrelation to ground truth
road sensors is 93%
Demonstrating that EIE captures a consistent
subset of real-world vehicle volume,
even at hourly temporal scaleThe results show the EIE model aggregate difference was ~6.1% Pearson correlation: 93% Sample: 76,560 vehicles
Our largest analysis to date uses ground truth data
             across three M50 roadways in Dublin

             Sample contained nearly 11,000,000 vehicles,
                 aggregated by day across 2018 Nov

M50 Toll
M50 South, Sandyford
M50 North, Ballymun
Road sensor data from M50 in Avg Daily Traffic Volume of nearly 11M vehicles Sample: 10,969,110 vehicles
We did not have AVO data for these roads; based on Dublin’s Canal Cordon Report,
   we used an Average Vehicle Occupancy of 1.37

 Pearson
 Correlation:
 99%

Sample: 10,969,110 vehicles
https://www.nationaltransport.ie/wp-content/uploads/2019/04/Canal_Cordon_Report_2018.pdf
The average error was biased by a constant AVO, due to weekends, when AVO
   tends to increase

 MAPE: 17.5%

 Weekday
 Error: 15.6%

 Weekend
 Error: 22.8%

Pearson correlation: 99%
Sample: 10,969,110 vehicles
https://www.nationaltransport.ie/wp-content/uploads/2019/04/Canal_Cordon_Report_2018.pdf
Model is sensitive to AVO, improving it on the margins can drastically alter
   performance

Pearson correlation: 99%
Sample: 10,969,110 vehicles
When adjusting AVO to 1.6, the error is significantly reduced

 MAPE: 4.4%

 Weekday
 Error: 3.7%

 Weekend
 Error: 6.2%

Pearson correlation: 99%
Sample: 10,969,110 vehicles
Error exacerbated by uncertainty in Vehicle Occupancy
           and weekday/weekend cadence

   Opportunities to improve AVO can result in more
               precise measurements

 More improvement are coming, however in its current
state EIE data has shown it can be a reliable indicator of
                     traffic volume
Hyperlocal air quality Street View cars capture hyperlocal air quality measurements on roads around the globe
Measure                      Plan                        Act                    Track

Estimate your city’s    Run scenarios based on       Inform mitigation goals   Monitor progress in
  greenhouse gas       granular levels of data and    and identify reduction    meeting climate
 (GHG) emissions           adjustable inputs              opportunities         protection goals
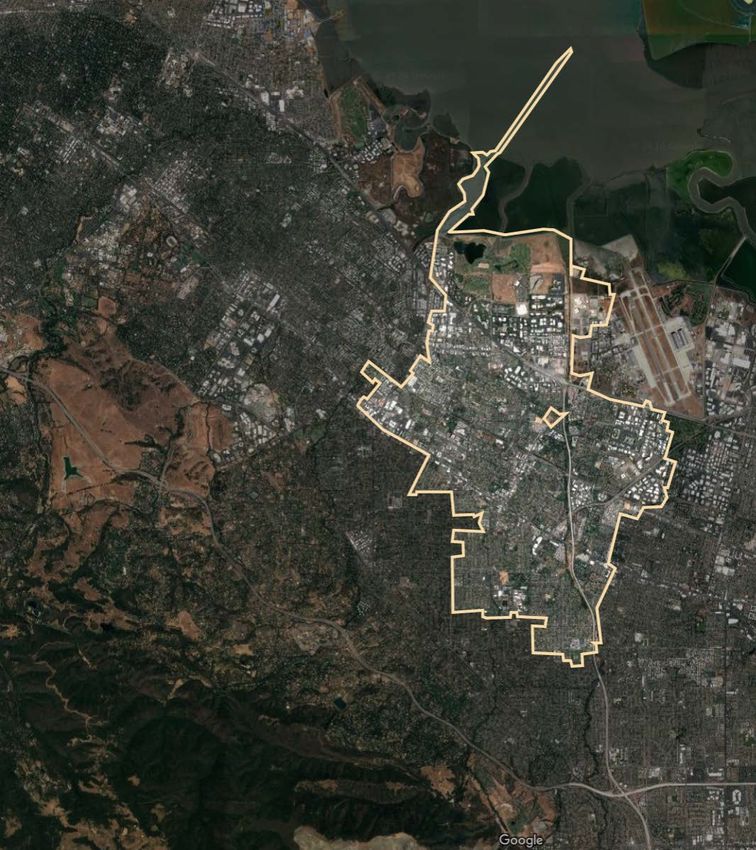
Measure: GHG emissions

   Mountain View, California
Mountain View plans to create parallel GHG
inventory using EIE transport data for VMT
and leveraging multi-modal data for
planning purposes
Measure + Plan + Act + Track: GHG emissions

   Dublin, Ireland
Dublin’s Smart City Programme targets to
increase bike trips across the city up to 20%
by 2025 and track the progress year-over-
year to understand the effectiveness of their
policy
1,000+                          73   North America
                                                                     34   Europe

                                                                                   6   Asia

Additional cities,
counties, states
accessible today.                             5      South America

                                                                                              4   Oceania
insights.sustainabilty.google
Insights Workspace 01 Test drive EIE data 02 Incorporate data into planning efforts 03 Share data across departments and the public
2020 Transport GHG Data ~ Group Discussion

 What critical questions do you have about transportation
mobility, ambient air pollution, and GHG emissions after the
     shelter-in-place orders over the last few months?
Coming Up… Next RICAPS Webinar – Tuesday, July 28 RICAPS CAP Template -- “Public-friendly” version available by end of next week
THANK YOU!
 John Allan, jallan@smcgov.org
 Denise Lin, dlin@smcgov.org
 Kim Springer, kspringer@smcgov.org
 Susan Wright, swright@smcgov.org
You can also read