Monitoring and Visualization of the Large Hadron Collider Optical Private Network
←
→
Page content transcription
If your browser does not render page correctly, please read the page content below
Monitoring and Visualization of the Large Hadron
          Collider Optical Private Network
        Patricia Marcu, David Schmitz                      Andreas Hanemann                            Szymon Trocha
          German Research Network (DFN)               German Research Network (DFN)               Poznan Supercomputing and
         c/o Leibniz Supercomputing Centre             Alexanderplatz 1, 10178 Berlin             Networking Center (PSNC)
     Boltzmannstr. 1, 85748 Garching, Germany                    Germany                      Noskowskiego 12/14, Poznan, Poland
              {marcu, schmitz}@dfn.de                        hanemann@dfn.de                    szymon.trocha@man.poznan.pl

   Abstract—The Large Hadron Collider (LHC) experiments at            is challenging. Researchers all over the world are increasingly
CERN result in vast amounts of data which are interesting             using dedicated optical paths to create high-speed network
for researchers around the world. For transporting the data           connections, and different groups of users may want to use
to 11 data distribution centers, an optical private network
(OPN) has been constructed as the result of a collaboration           monitoring applications for specific research purposes. They
of several academic networks. The multi-domain nature of this         need access to network measurement data from multiple
collaboration poses new challenges, in particular to network          involved network domains, visualize network characteristics
monitoring. This has been addressed by adopting the multi-            and troubleshoot related issues [3].
domain tool set perfSONAR. In the implemented solution, the
                                                                         A quick overview and visualization of the network status is
network users can access network monitoring information from
various measurement points through the LHCOPN Weathermap              necessary to establish demarcation points that help distinguish
visualization tool. This paper details the tool itself and its        network issues within LHCOPN from those in the sites.
operation within the LHCOPN using perfSONAR tools. It serves          The deployment of monitoring tools and the use of common
as a blueprint for the support of future data-intensive large-scale   services should provide a unified network information view
projects.
                                                                      across all domains [4]. Typical off-the-shelf solutions do not
                                                                      provide such functionality.
                       I. I NTRODUCTION
                                                                         This paper is organized as follows. Section II includes a
   The significant increase in the availability of high-speed         description of requirements for multi-domain network moni-
research networks has led to the deployment of large-scale            toring. In section III we describe the state-of-the-art of existing
distributed computing environments that are able to serve a           solutions for large scale network monitoring. Section IV is
large number of geographically separated users by exchanging          introducing the measurement methods in LHCOPN. In section
large amounts of data. Direct communication between sites             V we present our system design, and section VI provides a
and computing facilities is now necessary in many working en-         detailed description of our implementation of the LHCOPN
vironments. This results in greatly expanded requirements for         Weathermap software. Section VII provides conclusions and
high-speed, dedicated networks that cross multiple domains.           future work.
The European Research Network GÉANT [1] and National
Research and Educational Networks (NRENs) in Europe are                                     II. R EQUIREMENTS
high-capacity telecommunication networks which are based on
optical technologies and components that provide wavelength-             The monitoring of the LHCOPN, i.e. Tier-0 and Tier-
based services to the research community.                             1 centres, and the links between them poses several new
   A representative project is the provisioning of the network-       challenges:
ing infrastructure for the Large Hadron Collider (LHC) at                  a) Multi-domain monitoring: The LHCOPN itself is
CERN in Switzerland. Its research experiments are expected            based on resources that are supplied by several academic
to produce 15 petabytes of data per year. Therefore, a multi-         networks such as GÉANT, European NRENs, Internet2, ESnet
domain LHC Optical Private Network (LHCOPN) was estab-                and Canarie. Therefore, a solution has to be found to collect
lished [2], dedicated to support data exchange. The LHCOPN            monitoring data from all these self-administered networks to
consists of Tier-0 and Tier-1 centers connected by End-to-End         form a joint view of the resulting network.
(E2E) links. These E2E links connect organizations (Tier-1                 b) Monitoring of different layers: While academic net-
centers) that are located in different countries and cross the        works have been used to monitor the network layer, the
shared network infrastructure of different providers (GÉANT,         LHCOPN requires E2E links on the data link layer to be
NRENs) towards the Tier-0 centre at CERN.                             monitored. These are based on heterogeneous technologies, as
   One of the most important and difficult issues related to this     the different participating networks use different technologies.
dedicated network is network management. The monitoring               E2E links are formed by combining technologies such as SDH
and troubleshooting optical networks and individual E2E links         and SONET, native Ethernet or Ethernet over MPLS, where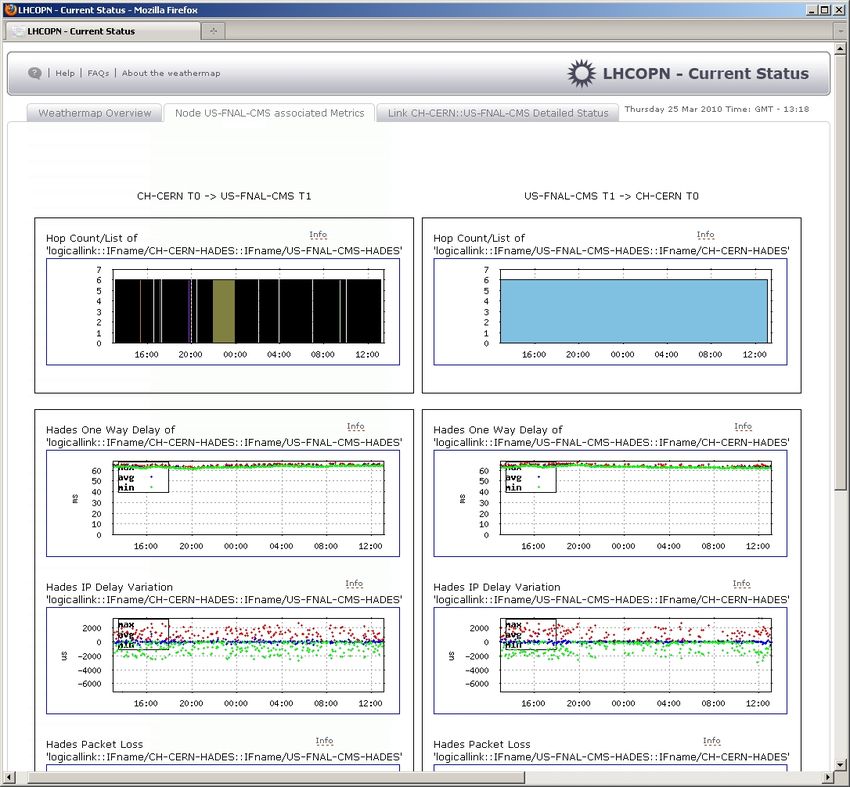
each domain is dependent on the data that it can retrieve from         There are already several tools which can visualize perf-
the network management system of its vendor.                        SONAR measurement data [12]. One of them is perfsonarUI
     c) Joint view of all metrics: In the visualization a view      which can be used for troubleshooting by allowing a direct
has to be formed by combining E2E link and IP-related               interaction with perfSONAR measurements.
monitoring data and by linking these data in a suitable manner.        All principles of the perfSONAR protocol will be taken
In doing so, it must be considered that there are also several      into account in the customization for the LHCOPN, especially
data sources on the IP level, in particular the retrieval of SNMP   its multi-domain-monitoring feature. Furthermore, this will be
data from routers and the results of active measurements.           done with respect to the different layers monitoring also devel-
                                                                    oped within the GN2/GN3 projects. The missing requirement
                   III. S TATE OF THE ART
                                                                    for this customization is the joint view on all metrics. Also,
   The issue of multi-domain monitoring is not only a chal-         a global overview of the LHCOPN was needed, in which
lenge in the context of the LHCOPN, but also in the gen-            different layer views coexist. This customization was achieved
eral operation of networks. In 2004 a collaboration of the          by a dedicated version of the Customer Network Management
GN2/GN3 project (between Internet2, ESnet, RNP and others)          (CNM) tool [13] (in a browser-based version).
was started to jointly develop a communication protocol and
tool set under the name perfSONAR [5], [6]. This development                     IV. M EASUREMENTS IN LHCOPN
has made necessary by the limitations of existing tool sets           To understand the metrics displayed in the LHCOPN Weath-
which were tied to single domain monitoring and limited to          ermap, it is necessary to know how the measurements are
metrics that can be monitored. Such limitations apply e.g. to       carried out. The deployment of the perfSONAR measurement
the MonALISA [7] tool set. Apart from being used in the             tools at each Tier-1-centre is therefore shown in Figure 1.
LHCOPN, the perfSONAR tools are also used within the
networks that participate in the collaboration and in other
locations, as the software is open source.
   The introduction of hybrid networks and the possibility to
deliver E2E links that involve multiple domains has led to the
need to monitor these links. Therefore, a special tool called
E2EMon (E2E Monitoring Tool) [8] has been developed over
the recent years. Every domain which provides a segment of
such an E2E link needs to have an E2EMon Measurement
Point (MP) in place which retrieves data from the local
network management system to provide status information for
the link segment. Due to the heterogeneity of technologies on
the layer below IP, it is only useful to provide an operational
and administrative up/down status for each link segment. The
status data for the segments are used for E2EMon to calculate
status data for the whole E2E link.
   For IP-level monitoring, the HADES, BWCTL and RRD
MA tools are of interest, as they provide relevant metrics                            Fig. 1.   Tier-1 site configuration
and are integrated into the perfSONAR framework. They
can therefore easily become part of an overall management              Three measurement servers are located at each centre. One
solution.                                                           of the servers is used to host an RRD MA to collect utilization,
   • HADES (Hades Active Delay Evaluation System) [9]               interface errors and output drop data related to the router
      uses dedicated hardware boxes to perform active tests         located at the Tier-1 centre.
      in the network to measure delay, jitter, packet loss and         The second server is the HADES box which conducts one-
      traceroute (with respect to IPPM recommendations [10]).       way delay [14], IP delay variation (jitter) [15], packet loss
      For precise timing, GPS antennas are installed in addition    [16], and traceroute tests with any other HADES box in the
      to the hardware boxes. Networking Time Protocol (NTP)         LHCOPN every minute. It is connected to a GPS antenna for
      can also be used but with less precision.                     precise timing.
   • BWCTL (Bandwidth Test Controller) [11] carries out                In addition, the HADES box hosts a BWCTL MP which
      throughput tests with TCP or UDP.                             is used for throughputs with the Tier-0 centre every 8 hours.
   • RRD MA/SQL MA (Round Robin Database Measure-                   The BWCTL MP is hosted on a different interface to avoid
      ment Archive/Structured Query Language Measurement            interference with HADES measurements. The third server is
      Archive) are tools that provide archived measurement          used for the Telnet/SSH MP, a tool that allows configuration
      data. Typically, they store data retrieved via SNMP from      data to be retrieved from the routers. It is only mentioned
      routers to provide information about link utilization,        here for completeness, but does not carry out any regular
      interface errors and output drops.                            measurements.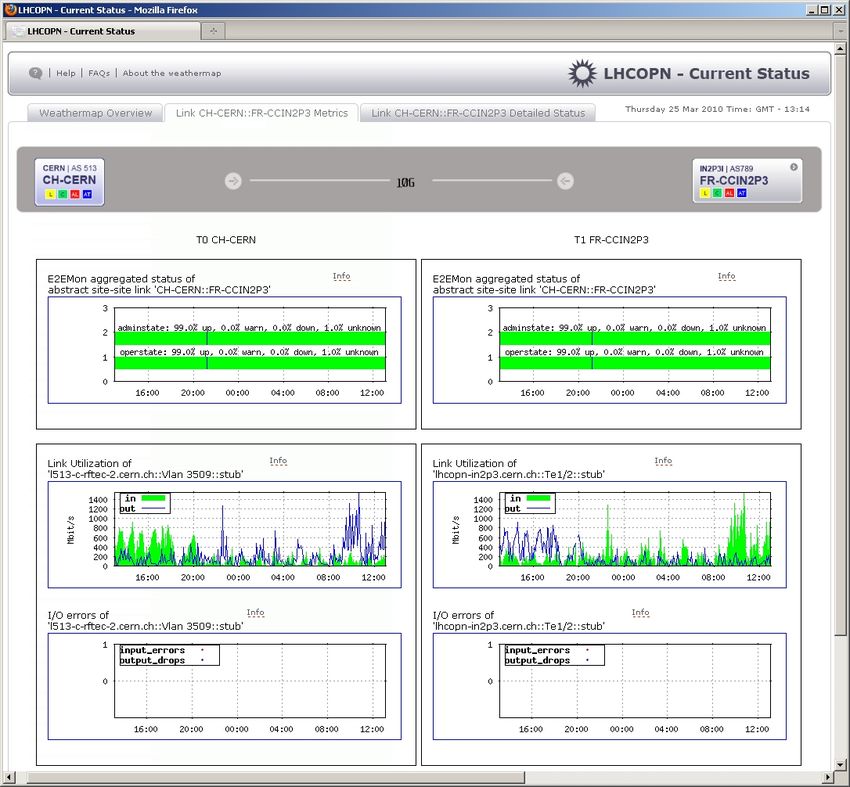
In addition to these measurements on the IP level, data is abstract links are non-directed (i.e. bidirectional) links between
also collected for the E2E links. The links start at the Tier-0 the abstract nodes.
centre or at one of the Tier-1 centers (backup links), end at one The metric used for this abstract layer is the aggregated
of the Tier-1 centers and typically cross several administrative status for each abstract link. It is computed every 5 minutes
domains (e.g. GÉANT, European NRENS, Internet2 or ESnet). from the E2EMon status of all associated E2E links. For a
The status of each link is then calculated based on the NMS single E2E link the status is retrieved in the E2EMon system
data from each domain involved. by polling all E2EMon MPs every 5 minutes.
The four status values of the abstract links are computed as
V. T OOL D ESIGN follows:
The measurements that are carried out have to be displayed • DOWN: if one associated E2E link is down
in a suitable manner which means in this case that a trade- • WARNING: if no associated E2E link is down and at
off between correct display and usability has to be made. least one has the status warning
For example, HADES measurements are not directly located • UNKNOWN: if no associated E2E link is down or
on the routers, so that delay data is not exactly measured indicates a warning and if the status of at least one of the
at the location of utilization measurements. Events on the associated E2E links is unknown (could not be measured
short link between router and HADES box can lead to wrong or the measurement could not be obtained)
interpretations. • UP: if the status of each associated E2E link is up
Even more difficult considerations have to be made for E2E
The list of E2E links associated with an abstract link may
link status data and its relation to IP metrics. By default the
include links which are currently missing (unknown) from the
IP data in the network uses the direct way via an E2E link.
accessible E2E Link topology.
However, if the E2E link fails (including the optical protec-
Currently, the rules do not take into account the case where
tion), then the IP protection performs a rerouting. Although
one associated E2E link is missing in the known E2E link
IP packets are still transferred, they take another route on the
topology, and its backup link exists already. In this case, the
optical level. Therefore, it is necessary to clearly distinguish
aggregated status for the abstract link is computed only from
between optical and IP level.
the non-missing E2E link.
For this reason, a data model is introduced in the following
that covers all topology information per network layer and B. HADES topology
all necessary topology mapping information for the LHCOPN
Weathermap. The HADES [9] boxes have been deployed at the Tier-0
With respect to the requirements stated in Section II, the and Tier-1 LHCOPN locations to provide QoS measurements.
operators of the LHCOPN should have a global view on their The HADES topology is made up of the abstract nodes, so
network. They should also have layer-related, location-related it can easily link them to E2E measurements and directed
and metric-related views on the LHCOPN. An E2E view is (uni-directional) HADES links between them. A HADES link
needed to check the availability of the E2E links involved. is determined by its source and targeted abstract nodes. As
Therefore, different layers (topologies) have been defined: E2E HADES links correspond to pairs of abstract nodes, they are
link, HADES, BWCTL and Router Topology. identified by ordered pairs of abstract locations.
HADES measurements are run as a full mesh between
A. E2E Link topology all nodes. To prevent users from being overloaded with too
To satisfy the LHCOPN requirement for multi-domain mon- much data, the visualization in the Weathermap is limited to
itoring accessed through a global view, a layer based on the measurements that relate to paths where E2E links exist.
E2E link has been specified to form the main view. This layer The metrics on the HADES layer are IP performance
gives an overview of the whole LHCOPN respectively on metrics (IPPM) computed for each HADES link (one way
dedicated E2E links involved in the LHCOPN. For each link delay [14], IP delay variation (jitter) [15] and packet loss[16])
that is displayed in the topology two kinds of abstractions can as well as the hop list/count metric. As the links are directed
be involved. A link represented here can be an E2E Link or between two different HADES end points A and B, the metrics
it can be an E2E link plus another E2E link which serves as exists for A → B and B → A. All these metrics have a
optical (1+1) protection. The other kind of abstraction that is time resolution of 5 minutes. The HADES metrics are stored
involved, is that for each E2E link the status is derived from in a HADES Measurement Archive (based on the SQL MA)
data retrieved from multiple NMS. In the following a detailed which are used to store and publish historical monitoring data
description of the E2E Link topology, whose representation in produced by the HADES Measurement Points.
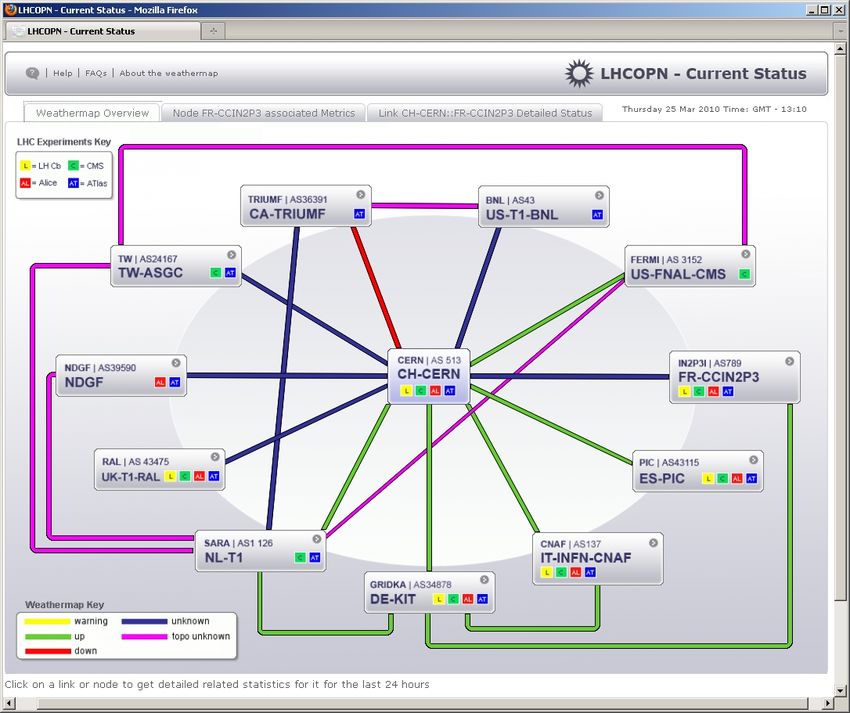
the LHCOPN Weathermap is shown in Figure 2, is given.
The topology consists of abstract nodes and abstract links. C. BWCTL topology
Abstract nodes represent the Tier-0 and Tier-1 LHCOPN Similar to HADES, BWCTL verifies available bandwidth
locations and are named accordingly. They abstract the exact from each endpoint to other points to identify throughput
location where measurements are conducted in order to allow problems. In the LHCOPN BWCTL, nodes are included within
easy linking of this topology to the other topologies. The the HADES boxes by using a second interface card.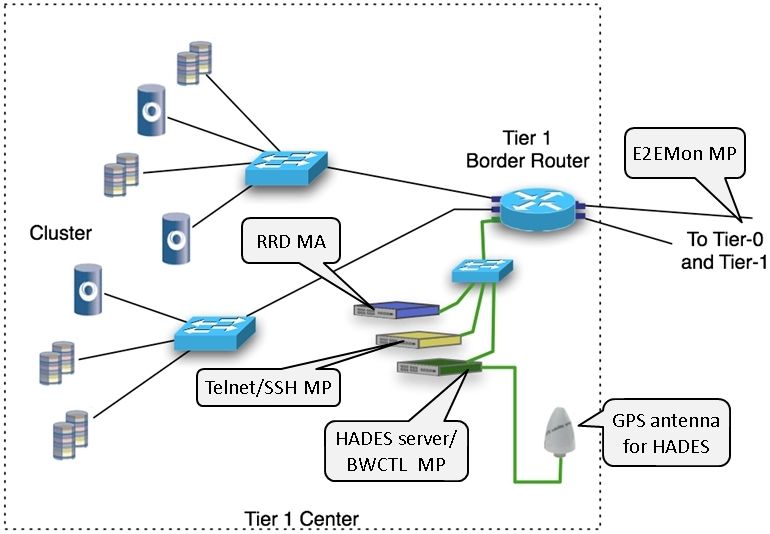
Fig. 2.   A view on the E2E Link Topology Tab in the LHCOPN Weathermap tool

   Each BWCTL end point address is associated with an                  of links). Also, one E2E link can contribute to a single VLAN
abstract node. This is a 1:1 mapping but the IDs of the                only.
BWCTL end point and of the abstract node are not the same                 The metrics used on the IP topology are utilization, input
(BWCTL IP addresses vs. location names).                               errors and output drops for each end point of an IP link. These
   On this layer, the needed metrics are minimum, medium and           metrics have a time resolution of 5 minutes.
maximum BWCTL throughput (stored in the SQL MAs). As
the BWCTL links are directed between two different BWCTL                            VI. I MPLEMENTATION HIGHLIGHTS
end points A and B, these BWCTL metrics exist for both
                                                                       A. Data retrieval, filtering and integration
directions A → B and B → A.
                                                                         The data retrieval is concerned with the fetching and updat-
D. Router topology                                                     ing of topology information, topology mapping information,
   Information about the IP links between two different IP             metric mapping information (see section V), as well as the
interfaces is needed to determine the status of the links              actual metric data fetching. The measurements in LHCOPN
between two IP interfaces within the LHCOPN (these are                 as well as metric data fetching were outlined in Section IV.
VLANS in their terminology).                                             The abstract topology and its associated E2E links have
   The IP topology consists of the abstract nodes which relate         to be imported from a structured, static configuration file
here to IP interfaces and IP links (pairs of IP interfaces). One       provided by LHCOPN users or, in future, from an online
IP link corresponds to a VLAN in the LHCOPN terminology.               configuration file.
The current assumption is that one abstract link is associated           The E2E Link topology is fetched from the E2EMon ex-
with one IP interface pair only. This means that, if one abstract      port interface together with their individual E2E link states
link has two or more E2E links, they both contribute (in an            and have to match the ones (associated with abstract links)
aggregated manner) to the same IP link (back-up link or bundle         specified above.
Fig. 3. A possible representation of the link status tab Fig. 4. A possible representation of the node status tab
The HADES topology is imported from metadata of the The content of the other two tabs (Metric tab and E2E Link
LHCOPN HADES MA. The topology mapping (abstract node tab) is shown when clicking either on an abstract link or an
1:1 HADES node) is trivial, and has to be altered to show links abstract node in the map. So by clicking and choosing the
that are interesting to the Weathermap (links that correspond selected abstract element, data corresponding to this abstract
to an abstract link). link or node is loaded in the metric tab and E2E link tab.
The BWCTL topology is imported from metadata in the 2) The Metric Tab: The metric tab shows statistical graphs
LHCOPN BWCTL SQL MA. The mapping between BWCTL of metrics associated to particular abstract links.
nodes (BWCTL IP addresses) and abstract nodes is statically If an abstract link in the overview map is selected, data for
configured. this specific link is shown. If a Tier-1 abstract node is selected,
Potential LHCOPN IP interface address pairs are imported the abstract link from the Tier-0 abstract node (CERN) to this
from the metadata of various LHCOPN RRD MAs and then selected Tier-1 abstract node location is selected. If the Tier-0
need to be altered according to the abstract link to IP interface abstract node (CERN) is selected, data for all abstract links
address pair mappings specified above. from CERN to any Tier-1 is displayed.
In the metric tab, 24-hour metric graphs of various metrics
B. Visualization of the network layers (see section V) are presented for the
To meet the requirements of LHCOPN users, a visualization chosen abstract link. The list of visualized metrics is different
consisting of three tabs has been designed: Overview Map Tab, depending whether the selected abstract element is a node or
Metric Tab and E2E Link Tab. a link.
1) Overview Map Tab: In this tab (see figure 2) a map Metrics for an abstract link: Selecting an abstract link in
consisting of abstract nodes and abstract links (described in the overview map displays the following metrics for this link
section V-A) is shown. This overview map indicates the current (see figure 3) in the Metric tab:
status using four colors: RED, YELLOW, GREEN and BLUE • The graph of the E2E aggregated status associated with
for the current abstract link status DOWN, WARNING, UP the abstract link itself. This is based on the data model in
and UNKNOWN (defined in Section V-A). section V-A and is visualized in the previously mentioned
In addition to that, the fifth status (MAGENTA) does not status colors.
represent a value of the metric’s aggregated status, but instead • The RRD MA metrics graphs (see Section IV) for the
indicates that there is a serious mismatch in the topology map- single IP link associated with the abstract link. These are
ping concerning the abstract link; namely that all associated visualized for both IP interfaces at both end points of the
E2E links (from the point of view of the abstract topology) are IP link.
unknown to the E2E topology (from the point of view of the All the metrics are measured and updated every 5 minutes.
E2E topology). This status is called topology unknown and Metrics for an abstract node: Selecting an abstract node
indicates that no aggregated status for the abstract link could in the overview map (all Tier-0 to Tier-1 abstract links related
be computed. to the selected abstract node) displays statistic graphs of thefollowing metrics for the chosen abstract links are shown (see other projects are going to be investigated. For projects that
figure 4): want to use dynamic circuits, the perfSONAR group is already
• The Hop count metric graph is divided into differently investigating suitable monitoring methods.
colored areas, indicating different routes. ACKNOWLEDGMENTS
• The HADES metrics are visualized as scatter plot graphs
This work is part of the Multi-Domain Networking Service Ac-
(values are dots), each with a 5 minute time resolution. tivity within the GN3 project which is co-funded by the European
For one way delay and jitter the minimum, medium and Commission.
maximum is needed.
• BWCTL metric graphs are visualizing the minimum,
R EFERENCES
medium and maximum BWCTL throughput. [1] GÉANT, “Géant Homepage,” http://www.geant.net/, 2010.
[2] E.-J. Bos, E. Martelli, and P. Moroni, “LHC Tier-0 to Tier-1 High-Level
3) E2E Link Tab: The metric tab specified in the previous Network Architecture,” CERN, Tech. Rep., 2005.
section, shows metrics on different (network) layers in a more [3] J. W. Boote, E. L. Boyd, J. Durand, A. Hanemann, L. Kudarimoti,
R. Lapacz, N. Simar, and S. Trocha, “Towards Multi–Domain
end-to-end like fashion between the Tier-0/Tier-1 locations. Monitoring for the European Research Networks,” in Selected
In addition to this, the E2E link tab presents a section status Papers from the TERENA Networking Conference. TERENA, Oct.
view for the focused abstract link. This is done by wrapping 2005. [Online]. Available: http://www.terena.org/publications/tnc2005-
proceedings/
the HTML page for the E2EMon section status for each E2E [4] M. K. Hamm and M. Yampolskiy, “Management of Multidomain End–
link associated to the focused abstract link in the map overview to–End Links. A Federated Approach for the Pan–European Research
tab. Network 2,” in Moving from Bits to Business Value: Proceedings of
the 2007 Integrated Management Symposium. Mnchen, Germany:
If the selected abstract element in the map overview tab is IFIP/IEEE, May 2007, pp. 189–198.
an abstract link, the E2EMon segment status is shown for all [5] A. Hanemann, J. Boote, E. Boyd, J. Durand, L. Kudarimoti, R. Lapacz,
E2E links associated to this. N. Simar, M. Swany, S. Trocha, and J. Zurawski, “Perfsonar: A service-
If the selected abstract element in the map overview tab is oriented architecture for multi-domain network monitoring,” in Proceed-
ings of the 3rd International Conference on Service-Oriented Computing
an abstract Tier-1 node, the E2EMon segment status is shown (ICSOC 2005). Amsterdam, The Netherlands: ACM, December 2005,
for all E2E links associated with this focused abstract link. pp. 241–254.
[6] “perfSONAR project,” http://www.perfSONAR.net.
C. Client and Access Point [7] “MONitoring Agents using a Large Integrated Services Architecture
(MonALISA),” http://monalisa.caltech.edu/, California Institute of Tech-
The client is implemented as a dynamic HTML page with nology.
some java script code used for the tabbing interface. [8] M. Hamm and M. Yampolskiy, “E2E Link Monitoring: System
Design and Documentation,” GN2 Project, Tech. Rep., 2008. [Online].
To speed up the access, some graphical parts of the content Available: https://wiki.man.poznan.pl/perfsonar-mdm/images/perfsonar-
are created and cached in advance: mdm/1/12/GN2-JRA4-06-010v240.pdf
• The current 24-hour statistic plot of any network element [9] “HADES,” http://www.win-labor.dfn.de/cgi-bin/hades/selectnew.pl?-
config=, WiN - Labor, RRZE, Erlangen.
necessary as specified in section V, are usually updated [10] V. Paxson, G. Almes, J. Mahdavi, and M. Mathis, “Framework for IP
on a 5 minutes basis. Performance Metrics,” USA, Tech. Rep., 1998.
• The overview map which includes the link status color is [11] “Bandwidth Test Controller (BWCTL).” [Online]. Available:
http://www.internet2.edu/performance/bwctl/bwctl.man.html
updated every 5 minutes. [12] A. Hanemann, V. Jeliazkov, O. Kvittem, L. Marta, J. Metzger, and
• Internal to the HTML dynamic generation scripts, addi- I. Velimirovic, “Complementary Visualization of perfSONAR Network
tional data base content caching is performed to speed up Performance Measurements,” in Proceedings of the International Con-
ference on Internet Surveillance and Protection (ICISP), vol. 2006. Cap
access further. Esterel, France: IARIA/IEEE, Aug. 2006.
[13] “CNM for GN3 project homepage,” http://sonar1.munich.cnm.dfn.de/.
VII. C ONCLUSION AND FURTHER WORK [14] G. Almes, S. Kalidindi, and M. Zekauskas, “A One-way Delay Metric
In this paper the monitoring of the LHCOPN has been for IPPM,” USA, Tech. Rep., 1999.
[15] C. Demichelis and P. Chimento, “IP Packet Delay Variation Metric for
explained with a focus on the LHCOPN Weathermap. While IP Performance Metrics (IPPM),” USA, Tech. Rep., 2002.
the support structure is ready to fulfill its needs, it will [16] G. Almes, S. Kalidindi, and M. Zekauskas, “A One-way Packet Loss
only prove its usefulness in day-to-day operations once the Metric for IPPM,” USA, Tech. Rep., 1999.
LHC experiments are running, and large amounts of data are
actually transferred via the network.
Besides continued improvements to the already existing
tools, an alarm tool is currently under development. It is
designed to be quite flexible in terms of alarm generation,
to be suitable for different user needs.
The perfSONAR services used for the LHCOPN and the
Weathermap are likely to be relevant to future large scale
projects in Europe. A collection of such projects can be found
in the roadmap of the European Strategy Forum on Research
Infrastructures (ESFRI) [17]. For the Weathermap, this means
that different ways of customization to meet the needs ofYou can also read