Inuit Statistical Profile 2018 - www.itk.ca - Inuit Tapiriit Kanatami
←
→
Page content transcription
If your browser does not render page correctly, please read the page content below
Inuit Statistical
Profile 2018

                    www.itk.ca
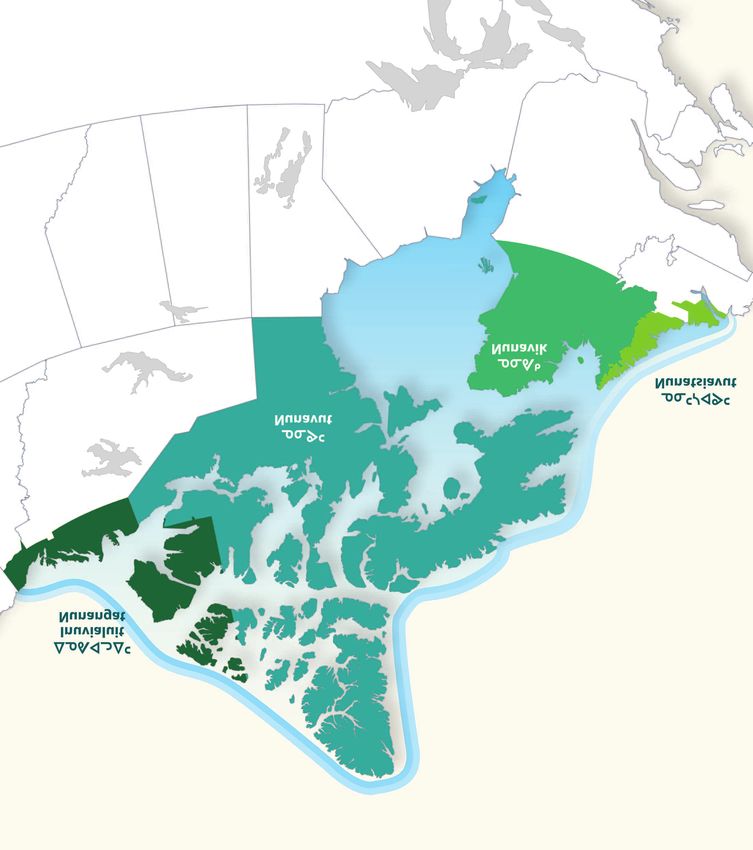
About Inuit Tapiriit Kanatami
Inuit Tapiriit Kanatami (ITK) is the national representational organization for the 65,000 Inuit in Canada,
the majority of whom live in Inuit Nunangat, specifically, the Inuvialuit Settlement Region (Northwest
Territories), Nunavut, Nunavik (Northern Québec), and Nunatsiavut (Northern Labrador). Collectively,
these four regions make up Inuit Nunangat, our homeland in Canada. It includes 51 communities and
encompasses roughly 35 percent of Canada’s landmass and 50 percent of its coastline. Consistent with
its founding purpose, ITK represents the rights and interests of Inuit at the national level through a
democratic governance structure that represents all Inuit regions.

The comprehensive land claim agreements that have been settled in Inuit Nunangat form a core
component of our organization’s mandate. These land claims have the status of protected treaties under
section 35 of the Constitution Act, 1982, and we remain committed to fully implementing them in
partnership with the Crown. ITK advocates for policies, programs, and services to address the social,
cultural, political, and environmental issues facing our people.

ITK is governed by a Board of Directors composed of the following members:

   • Chair and CEO, Inuvialuit Regional Corporation
   • President, Makivik Corporation
   • President, Nunavut Tunngavik Incorporated
   • President, Nunatsiavut Government

In addition to voting members, the following non-voting Permanent Participant Representatives also sit
on the Board:

   • President, Inuit Circumpolar Council Canada
   • President, Pauktuutit Inuit Women of Canada
   • President, National Inuit Youth Council

Vision
Canadian Inuit are prospering through unity and self-determination

Mission
Inuit Tapiriit Kanatami is the national voice for protecting and advancing the rights and interests of Inuit
in Canada

Copyright © Inuit Tapiriit Kanatami, 2018

ISBN: 978-1-989179-00-0

Inuit Statistical Profile 2018

Contents
Message from ITK’s President . . . . . . . . . . . . . . . . . . . . . . . . . . . . . . . . . . . . . . . . . . . . . . . . . . . . . . . . . . . .4

Introduction . . . . . . . . . . . . . . . . . . . . . . . . . . . . . . . . . . . . . . . . . . . . . . . . . . . . . . . . . . . . . . . . . . . . . . . . . . . .5

Map of Inuit Nunangat . . . . . . . . . . . . . . . . . . . . . . . . . . . . . . . . . . . . . . . . . . . . . . . . . . . . . . . . . . . . . . . . . .6

Summary Infographic: Social and Economic Inequity in Inuit Nunangat . . . . . . . . . . . . . . . . . . . .7

List of Indicators

       1.      Number of Inuit and Population Growth . . . . . . . . . . . . . . . . . . . . . . . . . . . . . . . . . . . . . . . . . . . . .8

       2.      Age Distribution . . . . . . . . . . . . . . . . . . . . . . . . . . . . . . . . . . . . . . . . . . . . . . . . . . . . . . . . . . . . . . . . . . . .9

       3.      Fertility Rates . . . . . . . . . . . . . . . . . . . . . . . . . . . . . . . . . . . . . . . . . . . . . . . . . . . . . . . . . . . . . . . . . . . . . .10

       4.      Infant Mortality, Sudden Infant Death and Preterm Birth . . . . . . . . . . . . . . . . . . . . . . . . . . . .11

       5.      Life Expectancy . . . . . . . . . . . . . . . . . . . . . . . . . . . . . . . . . . . . . . . . . . . . . . . . . . . . . . . . . . . . . . . . . . . .12

       6.      Housing . . . . . . . . . . . . . . . . . . . . . . . . . . . . . . . . . . . . . . . . . . . . . . . . . . . . . . . . . . . . . . . . . . . . . . . . . . .13

       7.      Tuberculosis (TB) Rates . . . . . . . . . . . . . . . . . . . . . . . . . . . . . . . . . . . . . . . . . . . . . . . . . . . . . . . . . . . . .14

       8.      Smoking Rates . . . . . . . . . . . . . . . . . . . . . . . . . . . . . . . . . . . . . . . . . . . . . . . . . . . . . . . . . . . . . . . . . . . . .15

       9.      Food Insecurity . . . . . . . . . . . . . . . . . . . . . . . . . . . . . . . . . . . . . . . . . . . . . . . . . . . . . . . . . . . . . . . . . . . .16

       10. Income . . . . . . . . . . . . . . . . . . . . . . . . . . . . . . . . . . . . . . . . . . . . . . . . . . . . . . . . . . . . . . . . . . . . . . . . . . . .17

       11. Suicide Rates . . . . . . . . . . . . . . . . . . . . . . . . . . . . . . . . . . . . . . . . . . . . . . . . . . . . . . . . . . . . . . . . . . . . . .18

       12. Education . . . . . . . . . . . . . . . . . . . . . . . . . . . . . . . . . . . . . . . . . . . . . . . . . . . . . . . . . . . . . . . . . . . . . . . . . .19

       13. Harvesting Country Food . . . . . . . . . . . . . . . . . . . . . . . . . . . . . . . . . . . . . . . . . . . . . . . . . . . . . . . . . .20

       14. Language . . . . . . . . . . . . . . . . . . . . . . . . . . . . . . . . . . . . . . . . . . . . . . . . . . . . . . . . . . . . . . . . . . . . . . . . . .21

       15. Strength of Family Ties . . . . . . . . . . . . . . . . . . . . . . . . . . . . . . . . . . . . . . . . . . . . . . . . . . . . . . . . . . . . .22

Conclusion . . . . . . . . . . . . . . . . . . . . . . . . . . . . . . . . . . . . . . . . . . . . . . . . . . . . . . . . . . . . . . . . . . . . . . . . . . . .23

Inuit Tapiriit Kanatami                                                                                                                                                    3     www.itk.ca
Inuit Statistical Profile 2018

Message from ITK’s President
More and more, Inuit require statistics to guide decision-making and to inform the development
of programs and policies aimed at improving the health and wellness of our families and
communities. But finding the data we need to tell our own stories in an Inuit-specific, culturally
appropriate way can be challenging. Data-based indicators are rarely developed with the unique
cultural, historical and environmental realities of Inuit in mind. These indicators, developed often
by those with little knowledge of who we are as a people, are often inappropriately applied to the
Inuit context and can perpetuate harmful, negative stereotypes.

However, some standard, existing indicators of the health and wellness of our people, communities
and lands can inform the work we do. Many of the indicators in this Inuit Statistical Profile 2018
illustrate the gaps that exist between Inuit and other Canadians. They can bring attention to our
concerns and, if used appropriately, can provide evidence that leads to action and change. For
example, tuberculosis data have helped inform ITK’s Inuit-Specific Tuberculosis Strategy, aimed at
reducing TB rates among our people across Inuit Nunangat. Data can be used to track improved
educational outcomes among Inuit, thus informing the objectives laid out in the National Strategy
on Inuit Education.

Inuit want to move from a place of exclusion from data activities to a place of inclusion where
these activities are governed by Inuit. We want to be able to determine the questions asked of us
and to lead discussions on new indicators that accurately reflect our many strengths. As outlined
in the National Inuit Strategy on Research, which was released early this year, it is time for Inuit
self-determination in collecting, verifying, analyzing, and disseminating Inuit-specific data and
information.

The upcoming Inuit Health Survey will provide Inuit across Canada with an opportunity to show
the many benefits that an Inuit-governed and -determined undertaking can bring. We look
forward to the time when we are able to showcase more Inuit-determined indicators and statistics
that tell the many good news stories of resilience and strength that existing data sources cannot
tell.

Nakummek,

Natan Obed

Inuit Tapiriit Kanatami                                                                           4    www.itk.ca
Inuit Statistical Profile 2018

Introduction
The Inuit Statistical Profile 2018 provides a series of data-based indicators designed to provide
insights into some of the important issues and challenges facing Inuit in Canada. Data from
indicators can provide evidence needed to guide program planning, to track progress over time,
determine interventions and to advocate for change.

In previous years, ITK has developed similar Statistical Profiles. This edition contains up-to-date
statistics, graphs and tables on a variety of topics. For each indicator, interpretive text summarizes
some of the main stories behind the numbers and limitations of the data are provided. The
statistics come from various sources, including:

•   The 2007-2008 Inuit Health Survey (as part of International Polar Year)
•   ITK’s National Inuit Suicide Prevention Strategy
•   The Public Health Agency of Canada’s Tuberculosis Reporting System
•   Statistics Canada’s Census, Aboriginal Peoples Survey and Canadian Birth-Census
    Cohort Database

Some indicators focus on the situation of Inuit nationally while others speak to the situation in
Inuit Nunangat as a whole. In a few cases, data are provided as well for each Inuit region in Canada.
There are no recent, national level sources of data for Inuit children.

Most indicators included here are not developed by Inuit and do not adequately measure the
reality of our people, communities, cultures and histories. As we move forward with our goal of
self-determined research and data collection, there will be many opportunities to develop new
indicators that are Inuit-relevant, reflecting the realities of our lives and experiences. These
new indicators will move beyond a deficits-based perspective and will provide us with data that
showcase our resilience, resourcefulness, generosity and many other strengths.

In the meantime, existing data can point to unacceptable gaps that exist between Inuit and others
in Canada. While most indicators are not strengths-based, they can provide us with evidence to
highlight some of the changes that need to be made to ensure that Inuit live healthy and fulfilling
lives.

Inuit Tapiriit Kanatami                                                                             5    www.itk.ca
Inuit Statistical Profile 2018 Inuit Nunangat Inuit Tapiriit Kanatami 6 www.itk.ca
Inuit Statistical Profile 2018

Summary Infographic: Social and
Economic Inequity in Inuit Nunangat
Many statistics point to social and economic inequities that impact our health and wellbeing.

    Inuit                                                                          All Canadians
    52%          of Inuit in Inuit Nunangat
    live in crowded homes* 1
                                                                                   9%     of all Canadians live in
                                                                                   crowded homes* 1

    34%         of Inuit aged 25 to 64 in
    Inuit Nunangat have earned a high
                                                                                   86%        of all Canadians aged 25 to
                                                                                   64 have earned a high school diploma1
    school diploma1

    70%         of Inuit households
    in Nunavut are food insecure 2
                                                                                   8%      of all households
                                                                                   in Canada are food insecure 3

    $23,485              The median
    before tax individual income for Inuit
                                                                                   $92,011             The median before
                                                                                   tax individual income for non-Indigenous
    in Inuit Nunangat 1                                                            people in Inuit Nunangat1

    72.4 years                                                                     82.9 years
    The projected life expectancy                                                  The projected life expectancy for
                                                                                                                     4
    for Inuit in Canada† 4                                                         non-Indigenous people in Canada

    12.3        The infant mortality rate
    per 1,000 for Inuit infants in Canada.
                                           5
                                                          IMR                      4.4       The non-indigenous infant
                                                                                    mortality rate per 1,000 for Canada.
                                                                                                                        5

    63%       of Inuit adults in Inuit
    Nunangat smoke daily 6
                                                                                   16%         of all adults in Canada
                                                                                   smoke daily 6

    181/100,000                                               TB                   0.6/100,000
    The tuberculosis rate for Inuit in                                             The tuberculosis rate for non-Indigenous
    Inuit Nunangat 7                                                               people in Canada 7

    29%         the growth rate of the Inuit
    population in Canada from 2006 to 2016 1
                                                                                   11%        the growth rate of the total
                                                                                   population of Canada from 2006 to 20161

*    Should not be compared with crowding data for previous years. Based on the suitability definition (whether the dwelling has
     enough bedrooms for the size and composition of the household). The previous figure was based on the number of persons
     per room definition.
†    Should not be compared with previous life expectancy data. The figure is a national 2017 projection of life expectancy for Inuit.
     Previous figures were for 2004-2008 for all residents of Inuit Nunangat, including non-Inuit.
1    Statistics Canada, 2016 Census. (crowded homes: 98-400-X2016163; high school diploma 98-400-X2016265;
     income: unpublished custom table provided to ITK; employment: 98-400-X2016266; population growth:
     http://www.statcan.gc.ca/daily-quotidien/171025/dq171025a-eng.pdf).
2    Grace M. Egeland, Inuit Health Survey 2007-2008: Nunavut (Ste-Anne-de-Bellevue, QC: Centre for Indigenous Peoples’ Nutrition
     and Environment, May 2010), 12.
3    Shirin Roshanafshar and Emma Hawkins. Health at a Glance: Food Insecurity in Canada (Ottawa, ON: Statistics Canada,
     March 25, 2015).
4    Custom table based on Statistics Canada’s Projections of the Aboriginal Population and Households in Canada, 2011 to 2036.
5    Sheppard et al 2017. “Birth outcomes among First Nations, Inuit and Metis populations.” Health Reports Vol. 28. No. 11.
6    Statistics Canada, http://www.statcan.gc.ca/pub/89-653-x/89-653-x2014003-eng.htm#a3.
7    Public Health Agency of Canada, Canadian Tuberculosis Reporting System — April, 2018.

Inuit Tapiriit Kanatami                                                                                                                 7   www.itk.ca
Inuit Statistical Profile 2018
Number of Inuit and Population Growth
In 2016, over 65,000 Inuit lived in Canada. Of these, the majority, 73%, lived in the Inuit homeland
of Inuit Nunangat. Between 2006 and 2016, the Inuit population in Canada grew at a rate nearly
three times that of the total Canadian population (29% versus 11%)1.
Inuit in Canada, Inuit Nunangat and Elsewhere, 2006 and 2016
Geographic # of Inuit, # of Inuit, Growth,
areas 2016 2006 2006 to 2016
Inuit in Canada 65,030 50,345 29.2%
Inuit in Inuit Nunangat, total 47,330 39,425 20.1%
Inuit in Nunatsiavut 2,285 2,160 5.8%
Inuit in Nunavik 11,800 9,565 23.4%
Inuit in Nunavut 30,135 24,595 22.5%
Inuit/Inuvialuit in Inuvialuit Region 3,115 3,105 0.3%
Inuit outside Inuit Nunangat 17,690 10,920 62.0%
Source
Statistics Canada, Census of Population, 2006 and 2016.
Interpretation
This table shows information on the number of Inuit nationally and regionally. The growth of the national and regional level Inuit
populations over time is also shown.
Technical Note
The census misses some Inuit. Excluded from the Inuit population counts are those who are homeless, those living in institutions such
as prisons and hospitals and others.
Bibliography
Statistics Canada. Census of Population, 2016.
http://www12.statcan.gc.ca/census-recensement/2016/dp-pd/dt-td/Rp-eng.cfm?LANG=E&APATH=3&DETAIL=0&DIM=0&FL=
A&FREE=0&GC=0&GID=0&GK=0&GRP=1&PID=110443&PRID=10&PTYPE=109445&S=0&SHOWALL=0&SUB=0&Temporal=2017&TH
EME=122&VID=0&VNAMEE=&VNAMEF=
1 The total population of Canada includes both Inuit and non-Inuit.
Inuit Tapiriit Kanatami 8 www.itk.caInuit Statistical Profile 2018
Age Distribution
The Inuit population is young and growing, with 33% under the age of 15 compared to 17% of
the total population of Canada1. While seniors make up 5% of the Inuit population, 16% of the
total population of Canada is made up of those aged 65 and over. It is essential to have adequate
resources and appropriate programs in place to ensure that the unique health, education and
general wellbeing needs of young Inuit are met. A continuing acknowledgement and deep respect
for elders, as culture bearers, teachers and advisors will help ensure that traditional Inuit ways of
knowing and being are passed on from one generation to the next.
Age distribution of Inuit and total population of Canada, 2016
Age group Total Inuit population Total Canadian population
# % # %
All ages 65,030 34,460,060
0-4 7,380 11 1,891,500 5
5-9 7,595 12 2,011,280 6
10 - 14 6,520 10 1,914,270 6
Subtotal 0 - 14 21,495 33 5,817,050 17
15 - 24 11,990 18 4,231,725 12
25 - 34 9,910 15 4,576,575 13
35 - 44 7,475 11 4,507,775 13
45 - 64 11,090 17 9,847,035 29
65 and over 3,060 5 5,479,905 16
Source
Statistics Canada, Census of Population, 2016.
Interpretation
This table shows the age distribution of Inuit and the total population of Canada1. Population counts are provided for various age
groups and the percent distribution of both the Inuit and total population is shown.
Technical Note
The census misses some Inuit. Excluded from the Inuit population counts are those who are homeless, those living in institutions such
as prisons and hospitals and others who are not counted.
Bibliography
Statistics Canada. Census of Population, 2016.
http://www12.statcan.gc.ca/census-recensement/2016/dp-pd/dt-td/Rp-eng.cfm?LANG=E&APATH=3&DETAIL=0&DIM=0&FL=A&FREE=
0&GC=0&GID=0&GK=0&GRP=1&PID=110443&PRID=10&PTYPE=109445&S=0&SHOWALL=0&SUB=0&Temporal=2017&THEME=122&VID
=0&VNAMEE=&VNAMEF=
1 The total population of Canada includes both Inuit and non-Inuit.
Inuit Tapiriit Kanatami 9 www.itk.caInuit Statistical Profile 2018 Fertility Rates The Inuit population is one of the youngest in Canada. On average, Inuit women have 2.7 children compared to 1.6 children for non-Indigenous women in the country. This emphasizes the need for good pre- and post-natal care and supports and resources in Inuit communities for both infants and their mothers. Total fertility rates, 2011 Group Fertility rate 2011 Inuit women 2.7 First Nations women with status 2.7 First Nations women without status 1.5 Métis women 1.8 Non-Indigenous women 1.6 Source Statistics Canada, Women in Canada, 2016. Interpretation This table shows the total fertility rate for various groups of women in Canada. The total fertility rate is the average number of children that the average woman gives birth to in her lifetime. Bibliography Statistics Canada. 2016. Women in Canada. Statistics Canada, Catalogue no. 89-503-X. http://www.statcan.gc.ca/pub/89-503-x/2015001/article/14313-eng.htm Inuit Tapiriit Kanatami 10 www.itk.ca
Inuit Statistical Profile 2018

Infant Mortality, Sudden Infant Death
and Preterm Birth
For the 2004 through 2006 period, the Inuit infant mortality rate was almost three times that for
non-Indigenous infants and the sudden infant death syndrome (SIDS) rate was over eight times the
non-Indigenous rate. The rate of preterm birth for Inuit infants in Canada was almost double that
for non-Indigenous infants. These high Inuit rates point to an urgent need to address underlying
causes such as lack of access to timely, adequate and culturally appropriate pre- and post-natal
care, environmental issues and insufficient public health programs and targeted interventions.

Infant mortality rate, Sudden Infant Death Syndrome (SIDS) and preterm birth rate
for Inuit and non-Indigenous infants in Canada, 2004 through 2006

         14
                     12.3
         12                                    Inuit in Canada                                                    11.4
                                               Non-Indigenous population
         10

          8
                                                                                                                            6.7
  Rate

          6
                               4.4
          4
                                                         2.5
          2
                                                                  0.3
          0
               Infant mortality rate                    SIDS rate                                            Preterm birth rate
              (per 1,000 live births)            (per 1,000 live births)                                      (per 100 births)

 Source
 2006 Canadian Birth-Census Cohort Database
 Interpretation
 Data are shown for three birth outcome measures – the infant mortality rate, the Sudden Infant Death Syndrome or SIDS rate and the
 preterm birth rate. The green bars are for Inuit infants in Canada while the gold bars are for non-Indigenous infants.
 Technical Note
 The infant mortality rate reflects children dying before their first birthday. SIDS is the sudden, unexplained death of a child under the
 age of one year that cannot be explained after thorough investigation. Both rates are expressed per 1,000 live births. Preterm births are
 those prior to 37 weeks of pregnancy (full-term pregnancy is 40 weeks) and are expressed as a percentage of all births.
 These rate for Inuit infants at the national level cannot be directly calculated due to the lack of an Indigenous identifier on many provincial
 data bases. Data here are from a data linkage. Rates here are not comparable with those from other sources because of methodology
 differences.
 Excluded are Inuit who did not take part in or were missed by the 2006 Census, and those whose records could not be linked.
 Bibliography
 Sheppard, A. et. al. 2017. “Birth outcomes among First Nations, Inuit and Métis populations”. Statistics Canada, Health Reports Vol. 28,
 no. 11. Catalogue no. 82-003-X.

Inuit Tapiriit Kanatami                                                                                                                    11     www.itk.ca
Inuit Statistical Profile 2018
Life Expectancy
Life expectancy is one of the most fundamental indicators of the overall health and wellness of a
population. It is influenced by many factors such as access to good quality health care, nutrition,
living conditions, lifestyle and others. A significant life expectancy gap of over ten years exists
between Inuit in Canada and Canada’s non-Indigenous population. Investments that address the
social determinants of physical and mental health and that lead to more accessible, culturally
appropriate health care would increase Inuit life expectancy and narrow the unacceptable gap
with others in Canada.
Life expectancy at birth (projected) for Inuit and non-Indigenous population
of Canada, 2017
90 Inuit in Canada
Non-Indigenous population
84.8
85 82.9
80.9
Life expectancy (years)
80
75 74.0
72.4
70.8
70
65
60
Total, Males Females
both sexes
Source
Statistics Canada, custom tabulation based on “Projections of the Aboriginal Population and Households in Canada, 2011 to 2036”.
Interpretation
This chart shows national level data on life expectancy which is the average number of years a person can expect to live. Green bars are
for Inuit in Canada while gold bars are for the non-Indigenous population. The first two bars are for both sexes combined, followed by
bars for males and females.
Technical Note
National level life expectancy data for Inuit cannot be directly calculated due to the lack of an Indigenous identifier on many provincial
data bases. Data here are projected. These figures are based on a three year average for 2016-2018. Data are not comparable with data
from other sources because of methodology differences. Inuit-specific data are not available for Inuit Nunangat.
Bibliography
Statistics Canada, custom tabulation based on “Projections of the Aboriginal Population and Households in Canada, 2011 to 2036”
catalogue #91-552-X.
Inuit Tapiriit Kanatami 12 www.itk.caInuit Statistical Profile 2018
Housing
Crowded housing is associated with high rates of communicable disease (such as tuberculosis),
stressors that can lead to friction and violence between family members, poor conditions in which
children must learn and study, and other challenges. Rates of inadequate housing conditions for
Inuit living in Inuit Nunangat are unacceptably high by any measure. Among Inuit in Inuit Nunangat,
52% live in crowded homes. This is almost six times the rate for non-Indigenous people in Canada.
Almost one-third of Inuit live in homes in need of major repair. This clearly shows the inequity
between Inuit and others with regard to housing suitability and gives concrete evidence to what
most Inuit already know anecdotally: that Inuit face a housing crisis which needs to be addressed.
Percent of people in crowded homes and homes in need of major repair, 2016
60 Inuit in Inuit Nunangat
First Nations on Reserve
52 Non-Indigenous people in Canada
50
44
40 37
Percent (%)
31
30
20
9
10
6
0
Crowded homes Homes in need of major repairs
Source
Statistics Canada, Census of Population, 2016.
Interpretation
This chart shows information for Inuit (green bars), First Nations on reserve (beige bars) and non-Indigenous people (gold bars) for two
indicators of housing. The first three bars focus on the percent of people in crowded homes. The next set of three focus on the percent
in homes needing major repairs.
Technical Note
Crowded home: There are many definitions of crowding. The one used here is based on Canadian Mortgage and Housing Corporation’s
“suitability” definition. Accommodations are suitable if the dwelling has enough bedrooms for the size and composition of the household
based on the age, sex, and relationships among household members. While this is a commonly used measure for southern Canada, it
may be less appropriate for Inuit.
Data from this definition cannot be compared with those based on other definitions (ie: more than one person per room).
Major repair: e.g. dwellings with defective plumbing or electrical wiring and dwellings needing structural repairs to walls, floors or ceil-
ings, as reported by the census respondent.
http://www12.statcan.gc.ca/census-recensement/2016/ref/dict/dwelling-logements003-eng.cfm
The census misses some Inuit. Excluded from the Inuit population counts are those who are homeless, those living in institutions such
as prisons and hospitals and others.
Bibliography
Statistics Canada. Census of Population, 2016.
http://www12.statcan.gc.ca/census-recensement/2016/dp-pd/dt-td/Rp-eng.cfm?LANG=E&APATH=3&DETAIL=0&DIM=0&FL=A&FREE=
0&GC=0&GID=0&GK=0&GRP=1&PID=110519&PRID=10&PTYPE=109445&S=0&SHOWALL=0&SUB=0&Temporal=2017&THEME=122&VID
=0&VNAMEE=&VNAMEF=
and
http://www12.statcan.gc.ca/census-recensement/2016/dp-pd/dt-td/Rp-eng.cfm?LANG=E&APATH=3&DETAIL=0&DIM=0&FL=A&FREE=
0&GC=0&GID=0&GK=0&GRP=1&PID=110520&PRID=10&PTYPE=109445&S=0&SHOWALL=0&SUB=0&Temporal=2017&THEME=122&VID
=0&VNAMEE=&VNAMEF=
Inuit Tapiriit Kanatami 13 www.itk.caInuit Statistical Profile 2018
Tuberculosis (TB) Rates
The tuberculosis rate for Inuit in Canada is comparable to rates in many third world countries.1
The average rate of active TB among Inuit in Inuit Nunangat was over 300 times the rate for the
Canadian-born non-Indigenous population. Rates in each Inuit region were higher than those
for others in Canada and ranged from 1.5/100,000 in the Inuvialuit region to 248.4/100,000 in
Nunatsiavut.
High rates in many Inuit communities are rooted in multiple factors, including inadequate housing,
food insecurity, poverty, stigma, and the enduring impacts of government-led TB control measures
during the 1940’s and 1950’s.2 During this period, many Inuit were transported south by ship to
TB hospitals thousands of kilometres from their families and communities. Those who survived
did not return home for several years. In some situations, the fate of those who did not return
remains unknown. The unacceptably high Inuit TB rates point to a need for more effective
approaches to TB prevention, control, and care for Inuit. Recently, the Government of Canada has
committed to the elimination of TB across Inuit Nunangat by 2030.3
Average rate of active tuberculosis by region 2006 to 2016
248.4
250 233.0
Average rate of active TB/100,000
Rate for Inuit
200 Nunangat (2016)
179.1 181
150
50
1.5 0.6
0
Inuvialuit Region Nunavut Nunavik Nunatsiavut Canadian-born
non-Indigenous
population (2016)
Source
Public Health Agency of Canada, Canadian Tuberculosis Reporting System.
Interpretation
This chart shows average rates of active tuberculosis (TB) per 100,000 population. The four bars on the left show Inuit-specific TB rates
based on a 2006 to 2016 average for each Inuit region. The rate for the Canadian born non-Indigenous population on the far right is for
the year 2016. The line shows the rate for Inuit Nunangat for 2016.
Technical Note
Given the small size of the Inuit population, the regional rates are subject to fluctuations. TB outbreaks in a few communities can cause
the rate for a given year to spike while fewer cases in other years result in a rate drop. For this reason, an 11 year Inuit-specific average
rate is provided for each Inuit region. The rate for the Canadian-born non-Indigenous population is for 2016 as it is less impacted by
small counts.
Bibliography
Public Health Agency of Canada, Canadian Tuberculosis Reporting System, April 2018.
https://itk.ca/ending-tuberculosis-backgrounder/
1 For international rates, see the World Health Organization tuberculosis country profiles: http://www.who.int/tb/country/data/profiles/en/
2 Inuit Tapiriit Kanatami, March 2013. Inuit-Specific Tuberculosis (TB) Strategy.
http://www.itk.ca/wp-content/uploads/2013/03/20130503-EN-FINAL-Inuit-TB-Strategy.pdf
3 Government of Canada. https://www.canada.ca/en/indigenous-services-canada/news/2018/03/
eliminating-tuberculosis-across-inuit-nunangat-by-2030-at-least-a-50-reduction-by-2025.html
Inuit Tapiriit Kanatami 14 www.itk.caInuit Statistical Profile 2018
Smoking Rates
From 1991 to 2012, the daily smoking rate among Inuit adults aged 15 and over in Inuit Nunangat
declined from 68% to 63%. The decline in smoking rates in recent years is encouraging, although
the gap with the total population of Canada remains large. The 2012 Inuit daily smoking rate was
over three times the rate for the overall population of Canada1. Inuit have the highest rate of lung
cancer in the world2. These data outline the need for Inuit-specific policies, programs, services
and strategies to reduce the rate of smoking among Inuit.
Percent of Inuit daily, occasional and non-smokers aged 15 and over in Inuit Nunangat,
1991, 2001 and 2012
Daily smoker (%)
Occasional smoker (%)
80
Non-smoker (%)
68 67
70 63
60
50
Percent (%)
40
30 25 27 27
20
8 10
10 6
0
1991 2001 2012
Time Period
Source
Statistics Canada, Aboriginal Peoples Survey (APS), 1991, 2001, and 2012.
Interpretation
This chart shows smoking data for Inuit in Inuit Nunangat aged 15 and over. Data are shown for three time periods: 1991, 2001 and
2012. The top line is for daily smokers. The centre line is for non-smokers while the bottom line is for occasional smokers.
Bibliography
Custom tables from Health Analysis Division, Statistics Canada based on Aboriginal Peoples Survey data.
1 The total population of Canada includes both Inuit and non-Inuit.
2 Young et. al. 2016. Cancer among circumpolar populations: an emerging public health concern.
International Journal of Circumpolar Health 75: 29787
Inuit Tapiriit Kanatami 15 www.itk.caInuit Statistical Profile 2018
Food Insecurity
Far too many Inuit struggle with food insecurity. Some reasons include the high cost of food in
Inuit communities, poverty, the cost of supplies required for harvesting and the decline in some
animal species such as caribou. Adults in food insecure households often have poorer physical
and mental health, including higher rates of heart disease, diabetes and depression. Food
insecurity impacts children’s cognitive, academic and psychosocial development. For Inuit, the
impacts of food insecurity also extend to cultural well-being because of the continued importance
of country foods such as seal, whale, and fish harvested from the local environment.
In Nunatsiavut, 44% of households are food insecure, similar to the 46% for households in the
Inuvialuit Settlement Region. The rate of food insecurity is highest in Nunavut where 70% of
households are food insecure.1 Conversely, 8% of all households in Canada are food insecure2.
Percent of food insecure households by region, 2007-2008
100
Food insecure 91
Food secure
80
70
Percent (%) of households
60 56
54
44 46
40
30
20
8
0
Nunatsiavut Nunavut Inuvialuit Canada
Settlement Region
Region
Source
Inuit Health Survey, 2007-2008 and the Canadian Community Health Survey (CCHS), 2007-08.
Interpretation
This chart shows data for the percent of households in Nunatsiavut (far left), Nunavut, the Inuvialuit Settlement Region and Canada as
a whole (far right) that are food insecure (green bars) and food secure (gold bars). Data for Canada are for all households in the country,
both Inuit and non-Inuit.
Technical Note
Food security is “a situation that exists when all people, at all times, have physical, social and economic access to sufficient, safe and
nutritious food that meets their dietary needs and food preferences for an active and healthy life”.3 Data for Canada are for all households
in the country, excluding those on reserve.
Bibliography
Inuit Health Survey 2007-2008, Regional reports for Nunavut, Nunatsiavut and the Inuvialuit Settlement Region:
https://www.mcgill.ca/cine/files/cine/adult_report_nunavut.pdf
https://www.mcgill.ca/cine/files/cine/adult_report_-_nunatsiavut.pdf
https://www.mcgill.ca/cine/files/cine/adult_report_-_inuvialuit.pdf
Canadian Community Health Survey 2007-08, http://www.statcan.gc.ca/pub/82-625-x/2010001/article/11162-eng.htm
1 Comparable data are not available for Nunavik.
2 All Canadian households include Inuit and non-Inuit.
3 World Food Summit, 1996 http://www.fao.org/forestry/13128-0e6f36f27e0091055bec28ebe830f46b3.pdf
Inuit Tapiriit Kanatami 16 www.itk.caInuit Statistical Profile 2018
Income
For Inuit in Inuit Nunangat in 2015, the median income for those aged 15 years and over was
$23,485 compared with $92,011 for non-Indigenous people in this region. This represents an
income gap of almost $70,000. The cost of living in Inuit Nunangat is high with many Inuit
struggling to buy healthy food, hunting and fishing supplies, clothing and other necessities. In
addition, many Inuit families are large and low incomes must be spread thin in an effort to meet
the basic needs of family members.
Median individual income, Inuit and non-Indigenous population aged 15 and over
by region, 2015
Region Inuit population Non-Indigenous population
Total, Canada $24,502 $34,604
Inuit Nunangat $23,485 $92,011
Nunatsiavut $23,211 $51,584
Nunavik $25,627 $79,328
Nunavut $24,768 $84,139
Inuvialuit region $22,523 $101,494
Outside Inuit Nunangat $27,665 $34,597
Source
Statistics Canada, custom tabulation, 2016 Census.
Interpretation
This table shows the total median income for Inuit and non-Indigenous populations aged 15 and over in the various regions across
Canada. The median income is the midpoint – half of incomes fall below this point while half are above.
Technical Note
Income includes income from all sources including employment, investments, government transfers such as Canada Pension, Old Age
Security, Employment Insurance, child benefits etc. Excluded are those without income. When interpreting income data for Inuit, it is
important to keep in mind the high cost of food, clothing and other necessities in Inuit communities and the larger family size. Smaller
incomes must be stretched further across Inuit Nunangat.
The census misses some Inuit. Excluded from the Inuit population counts are those who are homeless, those living in institutions such
as prisons and hospitals and others.
Bibliography
Statistics Canada. 2016 Census. Custom tabulation prepared for ITK.
Inuit Tapiriit Kanatami 17 www.itk.caInuit Statistical Profile 2018
Suicide Rates
The four Inuit regions in Canada have rates of suicide that range from five to 25 times the rate of
suicide for Canada as a whole. The high rates of suicide in Inuit Nunangat are a symptom of the
social and economic inequities that have existed between Inuit Nunangat and most other regions
of Canada since Inuit began to be impacted by colonization and the transition off the land into
permanent settlements. The stress our people experienced during this transition, coupled with
the prejudice and social inequities families faced in settlements, led to enduring social challenges
that create risk for suicide in our communities. Suicide among Inuit is a preventable public health
crisis that can and must be addressed.
Suicide rates for Inuit in Inuit regions and total population of Canada1, 1999-2013
300 275.3
259.3
238.8
250
200 181.2
Suicide rate/100,000
150 129.2
119.7 116.7
100 113.5
109.6
61.4
50 32.1 60.4
11.9 10.8 11.3
0
1991 to 2003 2004 to 2008 2009 to 2013
Time Period
Inuvialuit Region Nunavik
Nunavut Nunatsiavut
Total Canada
Source
Inuit Tapiriit Kanatami (ITK), National Inuit Suicide Prevention Strategy, 2016.
Interpretation
This chart shows data on suicide rates for three different time periods – 1999-2003, 2004-2008 and 2009-2013. Rates are provided for
each of the four Inuit regions and the total population of Canada over time.
Technical Note
Data for Inuit living outside Inuit Nunangat are not available because death certificates in the provinces are not coded by Indigenous
identity the way they are in the territories.
Bibliography
Inuit Tapiriit Kanatami. 2016. National Inuit Suicide Prevention Strategy.
https://www.itk.ca/wp-content/uploads/2016/07/ITK-National-Inuit-Suicide-Prevention-Strategy-2016.pdf
1 The total population of Canada includes both Inuit and non-Inuit.
Inuit Tapiriit Kanatami 18 www.itk.caInuit Statistical Profile 2018
Education
In 2016, 45% of Inuit in Canada reported having a high school diploma, compared to 86% of the
non-Indigenous population in the country. Figures for Inuit varied from one region to the next.
Inuit outside Inuit Nunangat were more likely than Inuit elsewhere to have completed high school.
The difference between Inuit and the non-Indigenous population in Canada is a result of several
factors including the impact of residential school attendance on many generations of Inuit, children
often having to learn in a second language, insufficient numbers of Inuit teachers and culturally
irrelevant curriculum, among others. Addressing the Inuit education deficit will fulfill the goal of
graduating bilingual Inuit students, grounded in Inuit culture, history and world view who have
the skills and knowledge to contribute to Inuit Nunangat, Canada and the world with pride and
confidence.
Percent of non-Indigenous and Inuit populations aged 25 to 64 with a high school
diploma or equivalency certificate, 2016
90 86
80
% with high school diploma or equivalency
72
70
60 54
50 45
41
40
34 32
29
30
20
10
0
Non-indigenous Inuit in Inuit Nunatsiavut Nunavik Nunavut Inuvialuit Outside
population in Canada Nunangat region Inuit
Canada Nunangat
Source
Statistics Canada, Census of Population, 2016.
Interpretation
This chart shows the percent of Inuit aged 25 to 64 years with a high school diploma or equivalency. Data for various regions are
provided. The first gold bar shows the percentage for the non-Indigenous population in Canada. Green Inuit-specific bars are for Inuit
in Canada, in Inuit Nunangat, each Inuit region and outside Inuit Nunangat.
Technical Note
Included are those with a GED and a regular high school diploma. Excluded are those who did not finish high school but who obtained
a post-secondary certificate, diploma or degree.
The census misses some Inuit. Excluded from the Inuit population counts are those who are homeless, those living in institutions such
as prisons and hospitals and others.
Bibliography
Statistics Canada. 2016 Census of Population. Table 98-400-X2016265
Aboriginal Identity (9), Secondary (High) School Diploma or Equivalency Certificate (14), Labour Force Status (8), Registered or Treaty Indian
Status (3), Residence by Aboriginal Geography (10), Age (13A) and Sex (3)
Inuit Tapiriit Kanatami 19 www.itk.caInuit Statistical Profile 2018
Harvesting Country Food
Country foods from the land and sea provide a healthy and nutritious food source for many Inuit.
Our harvesting, sharing and country food consumption reinforces family and community ties and
contributes to the continuity of an ancient tradition. In Inuit Nunangat, the overwhelming majority
(70%) of Inuit adults take part in harvesting activities and half (51%) gather wild plants and berries.
Inuit men are more likely than Inuit women to hunt, fish and trap while the reverse is true for
gathering activities. This provides clear evidence of the resilience and importance of the Inuit
traditions of harvesting and gathering these foods.
Percent of Inuit in Inuit Nunangat aged 18 and over who harvested in previous year, 2012
90
82 Both sexes
80 Men
70 Women
70
59 60
60
51
Percent (%)
50
42
40
30
20
10
0
Hunting, fishing, trapping Gathering wild plants, berries
Source
Statistics Canada, Aboriginal Peoples Survey (APS) 2012.
Interpretation
This chart shows data for the percent of Inuit men and women aged 18 and over in Inuit Nunangat who reported harvesting or gathering
at least once in 2011. Data on the left are for those who hunted, fished and /or trapped. Data shown are for both sexes combined,
males and females. Similar numbers are shown on the right for those who gathered wild plants and/or berries.
Technical Note
Information is for those who did any of these activities at least once in the past year. The percentages include those who harvested on
a regular basis, along with those who rarely harvested.
Bibliography
Statistics Canada. 2012. Aboriginal Peoples Survey (APS). Custom tabulation for ITK.
Inuit Tapiriit Kanatami 20 www.itk.caInuit Statistical Profile 2018
Language
It has been said that “our language is who and what we are and the health of our language lies at
the core of our well-being”1. At the national level, 64% of Inuit of all ages reported being able to
speak Inuktut2 well enough to have a conversation. However, less than half (45%) said that Inuktut
was the language used most often at home, the place where language is most likely to be passed
on from one generation to the next. While there are many Inuktut speakers in Nunavik and
Nunavut, there is a smaller percentage of speakers in Nunatsiavut and the Inuvialuit region, largely
because of their different histories and experiences with colonialism, including the residential
school system, that have contributed to language decline. In all regions, Inuktut is under threat
and resources and programs must be in place to ensure the promotion and protection of its many
dialects across Inuit Nunangat and among Inuit in southern Canada.
Percent of Inuit reporting being able to converse in Inuktut2, using Inuktut at home
and with Inuktut as their mother tongue, 2016
Able to converse Inuktut used most Inuktut mother
in Inuktut [%] at home [%] tongue [%]
Language by age group
Inuit of all ages in Canada 64% 45% 57%
0-14 years 65% 48% 56%
15-24 years 64% 46% 57%
25-64 years 64% 42% 58%
65 years and over 61% 46% 61%
Language by Inuit region
Nunatsiavut 21% 5% 17%
Nunavik 99% 95% 98%
Nunavut 89% 58% 77%
Inuvialuit region 22% 1% 16%
Outside Inuit Nunangat 11% 2% 10%
Source
Statistics Canada, Census of Population, 2016.
Interpretation
This table shows information for three indicators of language strength: a) % able to converse in Inuktut b) % reporting using Inuktut as
the language used most at home and c) % reporting Inuktut as their mother tongue. The top section of the table provides information
for Inuit at the national level by age while the bottom section shows information for each indicator for each Inuit region.
Technical Note
Mother tongue is the first language learned at home in childhood and still understood. Included in the mother tongue data is a small
number of Inuit who speak an Indigenous language other than Inuktut.
Language information is based on self-assessment, rather than a formal assessment tool. While information on the percentage of Inuit
who can speak Inuktut well enough to have a conversation is useful, it can hide some important changes. For example, due to ongoing
language erosion, it is likely that many younger Inuit who report being conversant in Inuktut cannot speak the language to the same
level of proficiency as older Inuit.
The census misses some Inuit. Excluded from the Inuit population counts are those who are homeless, those living in institutions such
as prisons and hospitals and others.
Bibliography
Statistics Canada. 2016 Census of Population. Table 98-400-X2016265.
Aboriginal Identity (9), Secondary (High) School Diploma or Equivalency Certificate (14), Labour Force Status (8), Registered or Treaty Indian
Status (3), Residence by Aboriginal Geography (10), Age (13A) and Sex (3).
1 Mary Simon, 2008 Arctic Indigenous Language Summit, Tromso, Norway.
2 There are several dialects of Inuktut spoken throughout Canada including Inuvialuktun, Inuinnaqtun, and various others.
Here, these are collectively known as the Inuktut. While some dialects have many speakers, others have a smaller number.
Inuit Tapiriit Kanatami 21 www.itk.caInuit Statistical Profile 2018
Strength of Family Ties
Strong connections with family members in the community can provide social support that
contributes to overall wellbeing and that can protect against a number of health problems.1 Half
(50%) of Inuit aged 18 and over in Inuit Nunangat reported that they had very strong ties with
family members in another household within their community. An additional 22% reported
having strong ties.
Strength of ties with family in another household in the community, Inuit population
in Inuit Nunangat aged 18 and over, 2012
3% Very Weak
4% Weak
21% Moderate 50% Very Strong
22% Strong
Source
Statistics Canada, Aboriginal Peoples Survey (APS), 2012.
Interpretation
This chart shows the strength of family ties with family members in other households within the community reported by Inuit aged 18
and over living in Inuit Nunangat. Strength of ties ranges from very strong to very weak.
Bibliography
Statistics Canada. 2012. Aboriginal Peoples Survey (APS). Custom tabulation prepared for ITK.
1 Public Health Agency of Canada. “What makes Canadians healthy or unhealthy?”
http://www.phac-aspc.gc.ca/ph-sp/determinants/determinants-eng.php
Inuit Tapiriit Kanatami 22 www.itk.caInuit Statistical Profile 2018 Conclusion Statistics can provide a wealth of information. They can show improvements in education outcomes, bring emerging health concerns to the attention of public health officials and provide evidence to advocate for resources required to ensure the health of our languages and cultures. In some cases, they can point to unacceptable gaps between Inuit and others that must be addressed. Inuit look forward to working together in partnership to meet the challenges high- lighted by statistics. As we move towards self-determination in research and data activities, Inuit-specific data-based indicators will better reflect our lives and circumstances. Strengths-based indicators will allow us to tell our own stories in our own ways, and to showcase our many strengths. These Inuit-informed indicators will provide more balance to future editions of the Inuit Statistical Profile. Inuit Tapiriit Kanatami 23 www.itk.ca
75 Albert St., Suite 1101
    Ottawa, ON Canada K1P 5E7
(   613-238-8181

    @ITK_CanadaInuit
    InuitTapiriitKanatami
    @InuitTapiriitKanatami

    www.itk.ca

www.itk.ca
You can also read