Influence of the vitiated air from the the urban and rural - E3S Web of Conferences
←
→
Page content transcription
If your browser does not render page correctly, please read the page content below
E3S Web of Conferences 180, 04013 (2020)                                 https://doi.org/10.1051/e3sconf/202018004013
TE-RE-RD 2020

       The influence of the vitiated air from the
       treatment plants on the urban and rural
       development
       Fanel-Viorel Panaitescu1,*, Mariana Panaitescu1 and Nicolaie Ion2
       1
         Constanta Maritime University, Department of Engineering Sciences in Mechanics and
       Environment, 900663 Mircea cel Batran street 104, Romania
       2
         POLITEHNICA University, Doctoral School of Electrical Engineering, 060042 Independentei Spl.
       313, Romania

                     Abstract. In order to reduce the emissions produced by the operational
                     flow of a wastewater treatment plant, regardless of whether they are
                     located in urban or rural areas, the quality of air must be analyzed. For this
                     reason, the Constanta Nord treatment plant was chosen as a study location.
                     This is near the Mamaia resort and does not fall within the recommended
                     sanitary protection norms, according to NP-032-1999 (at least 300 m from
                     the last house). Therefore, it was necessary to take measures to reduce the
                     repellent gases generated in the neighborhood of wastewater treatment
                     plants. The solution is in attention of all wastewater treatment plants from
                     the world because this depend on operational flux management and health
                     of population.The research consists of: description of the technological
                     flow of the treatment plant and in particular of the deodorizing installation
                     of the contaminated air, choosing a work scenario for a day with 2 shifts
                     per hour, respectively 6 shifts per hour, the air flow needed to treat the
                     vitiated air (the deodorization plant components) and the efficiency of the
                     regulation system from the point of view of energy consumption. Also,
                     possible leakage of dangerous gases into the atmospheric air was
                     monitored (H2S, Cl2, CO), taking into account the fact that in the
                     immediate vicinity there is the Mamaia resort, the student housing and
                     rural locations Palazu and Mamaia village.

       1 Introduction
       Europe’s air quality has been improving in recent decades. However, many people continue
       to be negatively affected by air pollution, especially in cities. Given its complexity, tackling
       air pollution requires taking coordinated action at many levels [1]. The level of emissions of
       pollutants released into the atmosphere may be reduced significantly through the
       implementation of environmental policies and strategies such as:
       - greater use of renewable energy sources (wind, solar, hydro, geothermal, biomass);
       - replacement of conventional fuels with alternative fuels (biodiesel, ethanol);

       *
           Corresponding author: viopanaitescu@yahoo.ro

© The Authors, published by EDP Sciences. This is an open access article distributed under the terms of the Creative Commons
Attribution License 4.0 (http://creativecommons.org/licenses/by/4.0/).
E3S Web of Conferences 180, 04013 (2020)                         https://doi.org/10.1051/e3sconf/202018004013
TE-RE-RD 2020

      - the use of plants and equipment with high energy efficiency (low consumption, high
      yields).
          “Policy makers and governments has focused their attention on air quality in the urban
      areas only. Air quality in rural areas remains a neglected issue so far” [2]. More than 100
      substances in rural areas have been identified, like solids, vapors, gases.There are many
      natural sources of air pollution like:SO2, Nox, carbonaceous particles, non-carbonaceous
      primary particles, ozone, volatile organic compounds (Voc; e.g. isoprene). The causes of air
      pollution in rural locations are natural (contaminants from animals, plants and land
      resources- spores, pollens, moulds, fur, feather, hair, dander, dust, grit, etc, forest fire, coal
      fires, dust storm, sand storm, meteorological factors, topography, air movements and
      climate ) and anthropogenic (human activities) [3], [4], [5], [6], [7], [8].
          Along with the existing causes in the rural environment adjacent to urban areas, the
      influences of urban pollution are added as a result of meteorological and anthropogenic
      factors. These caused are called trans-boundary pollution [2]. One of these sources is the
      pollution generated by uncontrolled emissions into the atmosphere from wastewater
      treatment plants. The SO2 concentration in air would threaten physical health and even
      cause respiratory system diseases [4]. A study found that higher SO2 and NO2 particles
      would increase risks of suicide [5], [7].
          For this reason, the Constanta Nord wastewater treatment plant (WWTP) was chosen as
      a study location (Figure 1). This is near the Mamaia resort and does not fall within the
      recommended sanitary protection norms, according to NP-032-1999 (at least 300 m from
      the last house). Therefore, it was necessary to take measures to reduce the repellent
      emissions generated in the neighbourhood of wastewater treatment plants.

      Fig. 1. The sewage treatment plant in North Constanta –View after covering the objectives that gave
      repellent gases

          The paper proposes a solution for optimizing the process of air deoderization and
      optimization of operating costs and energy for this solution. The solution is in attention of
      all wastewater treatment plants from the world because this depend on operational flux
      management.
          There are three units of air deodorization stations in the sewage treatment plant North
      Constanta. These units purify the air resulting from the operation of bioreactors, secondary
      settler tank, distribution chambers and the connection pipes.We propose a study on the
      quality of the treated air, but at the same time, the study will focus on the consumption of

                                                      2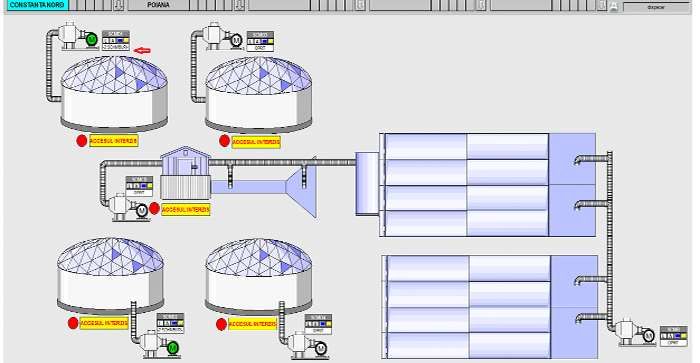
E3S Web of Conferences 180, 04013 (2020)                     https://doi.org/10.1051/e3sconf/202018004013
TE-RE-RD 2020

      electricity. We will also try to identify the possibilities of reducing the electricity
      consumption that is absorbed from the grid using oxygen detectors on bioreactors.

      2 Plant description

      2.1 Operational flow

      The operational technological flow in Constanta North Wastewater Treatment Plant
      (WWTP) (Figure 2) contents: primary stage, secondary stage and tertiary stage.

      Fig. 2. Operational flow in WWTP Constanta-North.

      Major processes of treatment includes [9], [10]: a) physical treatment-remove suspended
      large solids by settling or sedimentation and eliminate floating greases; b) biological
      treatment-degradation or consumption of the dissolved organic matter using the means of
      cultivated in activated sludge or the trickling filters; c) chemical treatment-remove other
      matters by the means of chemical addition or destroying pathogenic organisms through
      disinfection; d) advanced treatment- removing specific constituents using processes such as
      activated carbon, membrane separation, or ion exchange. Particular treatment processes are:
      a) sedimentation; b) coagulation and floculation; c) activated sludge; d) sand filters; e)
      membrane separation; f) disinfection.

      2.2 The deodorization plant

      Three deodorization units were designed using H2S concentrations to reflect the odor levels
      to be removed. To treat the waste air from these surfaces and processes, we selected several
      activated carbon treatment systems based on the volumes corresponding to the objectives,
      the number of air changes required, the anticipated levels of H2S contaminant and the
      imposed emission limits. Although there are several odorous substances at a treatment
      plant, the deodorization units were designed using H2S concentrations to reflect the odor
      levels that need to be removed [9], [10].

                                                    3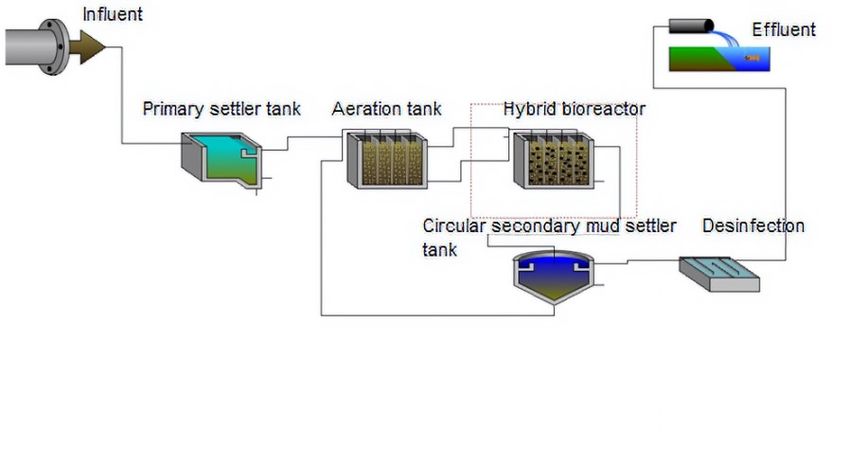
E3S Web of Conferences 180, 04013 (2020)                      https://doi.org/10.1051/e3sconf/202018004013
TE-RE-RD 2020

      2.2.1 Second settling deodorization plant

      The deodorization units that equip each of the secondary settler tanks extract the air from
      the free space between the surface of the water, the walls and the roof of the settler tank
      through a suction tube and lead it into the air treatment compartment composed of two
      parallel activated carbon blankets which they absorb H2S as well as other odorous gases as
      well as suspended particles. This treated air is then discharged into the atmosphere through
      a chimney.. The deodorization units of the secondary settler tanks are installed outdoors on
      concrete platforms specially designed  ed for them. Each secondary settler tank has a
      deodorization unit. The deodorization units of the decanters are designed to make 2 shifts of
      the entire volume of air per hour (Figure 3)) and 6 shifts of the whole volume of air per hour
      (Figure 4) when an operator
                                erator wishes to enter the settler tank. The air flow requiring
      treatment is calculated based on the number ACH - the number of air exchanges per hour,
      from the capsule volume. For decanters, the volume of air between the surface of the water
      in the decanter and the roof is 8872 m3. The two projected situations take into account 2
      ACH when the operators are not in this space and 6 ACH when they are the operators in
      this space.

      Fig. 3. Operational flow-2 shifts per hour

      Fig. 4. Operational flow-6 shifts per hour

                                                   4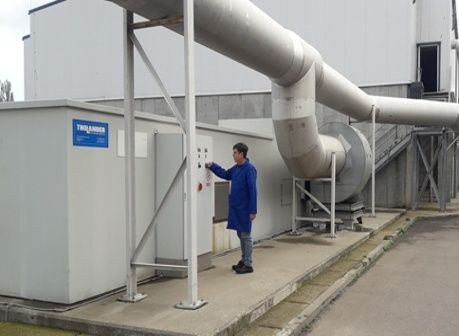
E3S Web of Conferences 180, 04013 (2020)                       https://doi.org/10.1051/e3sconf/202018004013
TE-RE-RD 2020

      2.2.2 Bioreactors deodorization plant

      Bioreactor deodorization unit extracts air from the free space between the water surface and
      roof from the four bioreactors and leads it to the air purification compartment composed of
      two parallel activated carbon blankets that absorb H2S and other odorous gases as well as
      particles. in suspension. This treated air is then released into the atmosphere through a
      chimney.
          The bioreactor deodorization unit is designed to operate a volume of 44,000 m3 / h
      which represents the aeration rate of the bioreactor plus 10% for compensation if there is air
      leakage through the roof (Figure 5). The roof of the bioreactor is not designed to allow
      personnel to enter. The operational staff will not be able to get under the roof because the
      air in it does not have enough oxygen to hold the breath. The bioreactor deodorization unit
      is installed outdoors, on a concrete platform.
          The four bioreactors are provided with roofs that form eight separate air spaces (two
      cells per bioreactor).The operation on the two shifts (2 shifts per hour, respectively 6 shifts
      per hour) implies a monitoring of the odor treatment units at the secondary settler tanks.

         Fig. 5. View of the bioreactor distribution chamber

      2.2.3 Deodorization plant. Distribution rooms-connection pipes

      The deodorization unit of the pipes and the distribution chambers extracts the air from the
      free space between the surface of the water, walls and roof, leads it to the treatment
      compartment composed of a series of three layers of activated carbon for the absorption of
      H2S and other obnoxious gases plus suspended particles. This treated air is then released
      into the atmosphere through a chimney. The deodorization unit of the distribution rooms
      and the channel is installed outdoors, on a concrete platform (Figure 6).

                                                       5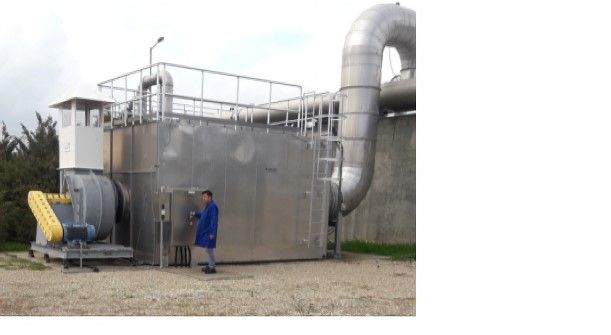
E3S Web of Conferences 180, 04013 (2020)                          https://doi.org/10.1051/e3sconf/202018004013
TE-RE-RD 2020

         Fig. 6. Deodorized air defective station mechanical cleaning stage

          The deodorization unit of the distribution chambers and the connection pipes is
      designed to provide 2 shifts of the entire air volume per hour and 6 shifts of the entire air
      volume per hour when an operator wishes to enter the closed spaces. The air flow requiring
      treatment is calculated based on the number of ACH shifts, the number of air exchanges per
      hour, from the capsule volume. For the distribution room, the closed volume of air is 1070
      m3.

      3 Research and methods

      3.1 Design scenarios

      The design scenarios provide for 2 (ACH) shifts when the operators are not in the
      encapsulated space and 6 (ACH) shifts when they are operators in the encapsulated
      enclosure. The clean air comes through the ventilation slots left on the roof of the rooms.
      Being a very short section, the diameter of the manifold pipe is chosen: 1200 mm since,
      whenever it is possible and even necessary to stop and isolate one or maximum of two
      biorectors, it has been provided that the system of collecting pipes of the vitiated air will be
      equipped with elements of adjustable closing of the extracted air flow. Thus, four damps
      with a diameter of 600 mm were introduced into the installation, equipped with butterfly
      type lenses and devices for regulating the flow of extracted air. Keeping the constant
      velocity of 10.16 m / s of air flow through the piping system, from the central tube of 1200
      mm diameter, two pipes, left / right, of 900 mm diameter, each of them ensuring the
      extraction of the vitiated air from two bioreactors. Further, each of these two pipes is
      branched into two pipes of 600 mm diameter, one for each bioreactor (table 1). Due to the
      production of reinforced concrete beams, four in number, in each bioreactor, with the role
      of creating supports for the new roofs in zone A of the bioreactors, each bioreactor can be
      considered to be composed of two distinct cells, cell 1 and cell 2, separated through the
      concrete beam to which we refer. For the extraction of the vitiated air from the two cells of
      each pipe of 600 mm diameter, equipped with a damper of the same diameter, another two
      pipes, one of 600 mm diameter each, for cell 1 and another 450 mm diameter for cell 2 are
      branched.
            The dimensions of the pipes for extracting the foul air are calculated so that the air
      speed is kept below 10.16 m / s, which prevents excessive pressure losses in the pipe.For
      the distribution and channel chambers there are 4 types of supply pipes (Table 1).

                                                       6
E3S Web of Conferences 180, 04013 (2020)                          https://doi.org/10.1051/e3sconf/202018004013
TE-RE-RD 2020

                           Table 1. Pipeline distribution and construction elements.

                  Location         Flow [m3 /h]        Velocity [m/s]        Dimensions [mm]
                     Total         7020                   10.16                   500
                 Settler tanks     2148                   10.16                   300
                 distribution
                   chamber
                 Settler tanks
                 distribution
                                   1980
                chamber plus                              10.16                   300
                  connection
                   channel
                 Bioreactors       4128                   10.16                   450
                 distribution
                   chamber
                Pumps station      2310                   10.16                   300
                 Distribution      582                    10.16                   200
                chamber plus
                pumps station

      3.2. Experimental research
      The vitiated air in these enclosures passes through the deodorizing station in which there is
      a mixture of tree bark that retains and filters, so that at the exit of the deodorizing station a
      clean air is given to the atmosphere. As this deodorizer station is equipped with an
      extractor.
           The values of parameters for the repellent gases at the inlet and outlet of the
      contaminated air enclosures were measured (Table 2. When the sensors detect exceedances
      of the repellent gases values, a red light signal illuminates which expresses the exceeding of
      the standard limit value.

                                    Table 2. The inlet standard air parameters.
               Gas                Threshold alarm             Danger threshold              Unit

               CH4                        20                         40                    % LIE
                O2                        19                         23                    % Vol.
               Cl2                        0,5                         1                     Ppm
               H2S                         5                         10                     Ppm
               CO                         30                         60                     ppm

          During our scenario, overruns were reported for H2S, Cl2 and CO. During the study,
      operational parameters (inlet/outlet) are monitored with SCADA program, air parameters
      with Dräger X -am 5000 gas analyzer and GasSens system (Table 3).
         The values of repellent gases were recorded for the case study:

                                                      7
E3S Web of Conferences 180, 04013 (2020) https://doi.org/10.1051/e3sconf/202018004013
TE-RE-RD 2020
Table 3. The recorded values of repellent gases parameters.
Location H2S [% LIE] Cl2 [ppm] Oxygen [% vol.]
Rare Grills 6.5 0.7 21
Desander 7.1 0.75 18
Settler tanks 0.75 17
distribution 7.3
chamber
Bioreactors 6.7 0.6 15
distribution
chamber+
recirculation
pumps
GasSens is an online monitoring system for detecting dangerous gases in atmospheric
air. It is designed for gas leak detection from cylinders, pipelines or gas supply equipment
and for alarms, in virtually any environment from industrial installations. There are systems
for monitoring different gases:
Sensor / transmitter -it consists of an electrochemical gas sensor, directly coupled to
a NEMA 4X transmitter. This component measures the concentration of gas and converts
the measurement result into a digital signal for transmission to a receiver module. It is
installed in the area where a leak or accumulation of gas is possible, either on the wall or
supported by the tube for electrical cables through which the interconnecting conductors
pass. Sensors / transmitters can be optionally fitted with Auto-Test, an electrochemical gas
generator that automatically tests the sensor response daily and warns of any sensor
problems. For hazardous areas there are explosion-proof sensors / transmitters.
Receiver module - receives digital data from the sensor / transmitter and ensures the
LED display of the gas concentration, two regulated gas alarm values, three gas alarm
relays, an isolated output of 4-20 mA, as well as an alarm and a relay for damage.
Power supply module - provides 12 V DC power supply. for one or two receiver
modules, as well as the power supply for a siren and for charging an external battery.
NEMA 4X enclosures (for alarm modules only). Four standard enclosures are
available for mounting the receiver and power supply modules. The polystyrene enclosures
are suitable for outdoor environments, and the digital displays and alarm indicators are very
visible through a transparent polycarbonate window at the front.
Explosion-proof enclosures (for gas monitors / sensors only). There are two versions
that allow the use of receiver and power supply modules in hazardous areas. One version is
suitable for only one receiver module, and the second version is large enough to receive
both a power source and a receiver.
Siren - an alarm siren, piezoelectric, of 12 V c.c. can be fitted for all NEMA 4X
enclosures. The siren is connected to the receiver module and emits intermittent sounds
when it reaches the set value for warning, respectively continuous sounds when it reaches
the set value for alarm. The siren can be switched off by pressing the A / R switch on the
front panel of the receiver.
Strobe lamp- provides light status alert.
Backup Battery - provides a 12 V DC, 4 AH battery and control circuits for charging,
in a separate NEMA 4X enclosure. The backup battery is connected directly to the power
supply module to ensure the backup power supply of the detection system.
8E3S Web of Conferences 180, 04013 (2020) https://doi.org/10.1051/e3sconf/202018004013
TE-RE-RD 2020
The concentrations of gas emissions recorded at the exit from the deodorization
installation are less than the allowable limit, so the impact is insignificant.
3.3 Solutions for optimizing energy consumption and monitoring oxygen
levels in bioreactors
Under anoxic conditions, the denitrification process takes place, and under aerobic
conditions the nitrification process takes place in the four lines of the bioreactors [11].
Therefore, in the Constanta-Nord treatment plant, four blowers are installed in
operation, 1 and 2 assistance and stand-by to cover the required oxygen in the bioreactors.
The electricity consumption of the turbochargers has an important weight in the general
energy consumption per each stage station (table 4)[12]. The difference in consumption is
due to the fact that during operation, many equipments have interruptions due to various
maintenance reasons, or some have a discontinuous operating flow. Thus, each of the four
THOLANDER turbochargers has a rated power of 355kW, while the FLYGT C 3400
intake pumps have a rated power of 125kW each (five pumps), and FLOTTWEG
centrifuges have a rated power of 55kW each (4 centrifuges).
Table 4. Distribution of equipment by processes in Constanta WWTP.
Share of equipment
Stage/ Share of equipment consumption [%]
Power [kW]/ consumption[%]
Einstal/Einstal.total
Energy [kWh] Pinstal/Pinstal.total
Mechanical stage:
P=768.83 [kW]
25.372 20.815
E=4132112.4
[kWh]
Biological stage:
P=1924.68
[kW] 63.516 69.035
E=13704521.4
[kWh]
Mud treatment
stage:
P=325.86 10.754
10.136
[kW]
E=2012138 [kWh]
TOTAL: 99.642 9.986
P=3019.37 [kW]
E=19848771.8
[kWh]
For our case study the electricity consumption for a full day of operation with 2 shifts
per hour is 136 kWh (19.02 2020), and for 24 hours of operation with 6 shifts per hour is
182 kWh (20.02.2020) (Table 5).
9E3S Web of Conferences 180, 04013 (2020) https://doi.org/10.1051/e3sconf/202018004013
TE-RE-RD 2020
Table 5. Operating hours index and electricity consumption index secondary deodorization stations.
Operating hours The hourly energy Energy
Operating consumption
6 shifts/hour consumption
hours index
Operating [hours] index/shifts/hour
time 2 shifts/ [kWh]
[kWh]
hour [hours]
7/2 shifts 127/2
18.02. 47/6 shifts shifts
4466 7642
2020 168/6
shifts
4491 7763 6/2 shifts 136/2
19.02. 46/6 shifts shifts
2020 175/6
shifts
8/2 shifts 143/2
20.02. 49/6 shifts shifts
4515 7862
2020 182/6
shifts
We observe the hourly energy consumption of 2 shifts which is about 6 kWh and in the
case of 6 shifts per hour it is 46 kWh. Moreover, the air flow is 18000m3 / h, in case of
operation with 2 shifts per hour, flow that does not ensure an acceptable quality for the air
inside. The air flows in the two situations are 18000 m3 / h, respectively 53232 m3 / h.
We analyze the efficiency of the regulation system in terms of energy consumption
(turbochargers have a significant share in station consumption (over 68%).
Description of the proposed solution:
Small bubble diaphragm diffusers absorb pressurized air. Bioreactor air supply lines
are equipped with air control valves, each tank having an air control valve.
Two oxygen flow meters (a main probe and a reference probe) are installed at each
bioreactor to adjust the volume of air intake in the bioreactor in question. The air flow at
each separate bioreactor line is measured and recorded by four flow meters.
The control of the aeration systems mainly comprises a concentration of two separate
control cycles.
The assessment of ambient air quality is regulated by Law 104/2011 on quality ambient
air transposing Directive 2008/50 / EC of the European Parliament and of the Council on
ambient air quality [13], [14]. In Constanta county, air quality is monitored by continuous
measurements in 7 stations automated located in representative areas. Pollutants in the area
of Constanta Nord treatment plant, Mamaia resort and Mamaia village, are monitored by
CT-3 and CT-6 stations, respectively: sulfur dioxide (SO2), nitrogen oxides (NOx / NO /
NO2), carbon monoxide (CO), ozone (O3), benzene, particulate matter (PM10) and weather
parameters (wind direction and speed, pressure, temperature, solar radiation, humidity
relative, precipitation). Also, possible leakage of dangerous gases into the atmospheric air
was monitored (H2S, Cl2, CO), taking into account the fact that in the immediate vicinity
there is the Mamaia resort, the student housing and rural locations Palazu and Mamaia
village (Table 2, Table 3).
In order to protect the population from the possible effects of pollution due to the
processes in the treatment plant and taking into account the location conditions, the
10E3S Web of Conferences 180, 04013 (2020) https://doi.org/10.1051/e3sconf/202018004013
TE-RE-RD 2020
hydrological and climatological conditions, it is recommended to reduce the impact of
repellent gases:
-rehabilitation of the ecological balance in the area of WWTP by monitoring emissions
and their impact on fauna, flora and population, as well as by planting dendrological
material;
- removing sludge from the site;
- controlling the wastewater treatment and sludge treatment process and monitoring
parameters of these processes;
- covered structures for sludge treatment and storage;
- avoiding crossing urban and rural areas;
- avoiding wrong operational maneuvers due to human errors;
- execution of works without causing discomfort to the inhabitants by generating
noxious substances, dust, noise and vibration;
- operation at the optimal designed parameters of the technological equipment and
means of transport to reduce nuisance and noise that could affect the human factor.
4 Conclusions
We have done a study on the quality of the treated air, but at the same time, the study will
focus on the optimization of energy consumption and oxygene level in bioreactors. We will
also try to identify the possibilities of reducing the electricity consumption that is absorbed
from the grid using oxygen detectors on bioreactors.
We analyzed the reduction of energy consumption at large consumers in the station and
mainly at the deodorization station by proposing work on 2 shifts, respectively 6 shifts /
hour, as well as the regulation of air flow, respectively oxygen level.
The control system tests the oxygen concentration in the aerobic bioreactor and
maintains its value of about 1.5%.
The quick control valve system is set to operate in the 15% -65% opening range. When
the oxygen detector detects reaching the 1.5% threshold, the valves open and the air flow
increases; at the same time, the power consumed by the turbocharger obviously increases.
In addition to H2S, Cl2 and CO are also monitored. The deodorization stations aim to
purify the air from the enclosures so that the limits of the concentrations of H2S, Cl2 and
CO are within the accepted limits. The control of gas emissions outside is done through the
monitoring system of the deodorization station, and the impact of these repellent gases has
proven, experimentally, to be insignificant.
This paper has financial support from the Constanta Maritime University under assistance
project PN-III-P1-1.2-PCCDI-2017-0404 /31PCCDI/2018, Holistic on the Impact of Renewable
Energy Sources on Environment and Climate-HORESEC.
11E3S Web of Conferences 180, 04013 (2020) https://doi.org/10.1051/e3sconf/202018004013
TE-RE-RD 2020
References
1. Campi, M.C., Cleaner air benefits human health and climate change, Nature Journal
29-01 (2018)
2. Majra, J.P., Air quality in rural areas, J. Intechopen, 7- 27, DOI 10.5772/16890 (2011)
3. Fang PQ., Medical and health undertakings development report in China. People’s
(Publishing House Press, Beijing 2014)
4. Peel J L, Tolbert P E, Klein M., Ambient air pollution and respiratory emergency
department visits. Epidemiology J., 16( 2) 164– 174 ( 2005)
5. Bakian AV, Huber RS, Coon H, et al., Acute air pollution exposure and risk of suicide
completion, American J. Epidemiology, 181( 5) 295– 303 ( 2015)
6. Mikael F, Raisa V, Pilvikki A, et al., Rural-urban Differences in Health and Health
Behaviour: A Base-line Description of a Community Health-promotion Programme for
the Elderly, Scand J. Public Health, 34 632– 640 (2006)
7. Lilian CG, Ana CG , Ricardo TJ, et al., Air pollution and your brain: what do you
need to know right now, Prim Health C. Res. Dev. J., 16( 4) 329– 345 ( 2014)
8. Chen S, Chen T., Air Pollution and Public Health: Evidence from Sulfur Dioxide
Emission of Coal-fired Power Stations in China, Econ Res J, 8 158– 183 (2014)
9. A. Ghiocel, M. Panaitescu, V. Panaitescu, Methods of efficiency of treatment plants.
Use of biogas obtained from the fermentation of sludge in thermal power plants (Case
study: WWTP Constanța Nord), J.Stiinta si inginerie 7, 28-74 (2015)
10. I.I. Panaitescu , A.A. Scupi, F.V. Panaitescu, M. Panaitescu, Efficient use of the pumps
in the wastewater treatment plant, Proc. Of Int. Conf. Energy-Environment (CIEM),
(2013).
11. E.T. Gligor, Contributions to the energy optimization of installations and equipment
within wastewater treatment plants Doctorate Thesys (Romania, Oradea, 2011)
12. Robescu Dan, ş.a., The reliability of processes, facilities and equipment for treatment
and purification of water, (Technical Ed. Bucharest, 2002)
13. Law no. 104 / 15.06.2011 on ambient air quality published in the Official Gazette of
Romania, Part I, 452 - 28, (2011).
14. Directive 2008/50 / EC of the European Parliament and of the Council of 21 May 2008
on ambient air quality and cleaner air for Europe, Official Journal of the European
Union (OJEU) L 152 11-06 (2008).
12You can also read