Constructed Wetland-Microbial Fuel Cells for Sustainable Greywater Treatment - MDPI
←
→
Page content transcription
If your browser does not render page correctly, please read the page content below

water
Communication
Constructed Wetland-Microbial Fuel Cells for
Sustainable Greywater Treatment
Ignacio Araneda 1,2 , Natalia F. Tapia 2,3 , Katherine Lizama Allende 1    ID
                                                                                and
Ignacio T. Vargas 2,3, * ID
 1   Department of Civil Engineering, Universidad de Chile, 8370449 Santiago, Chile;
     ignacio_ag91@hotmail.com (I.A.); klizama@ing.uchile.cl (K.L.A.)
 2   Centro de Desarrollo Urbano Sustentable (CEDEUS), 7520246 Santiago, Chile; netapia@uc.cl
 3   Department of Hydraulic and Environmental Engineering, Pontificia Universidad Católica de Chile,
     7820436 Santiago, Chile
 *   Correspondence: itvargas@ing.puc.cl; Tel.: +56-226-864218

 Received: 6 June 2018; Accepted: 10 July 2018; Published: 14 July 2018

 Abstract: Greywater reuse through decentralized and low-cost treatment systems emerges as an
 opportunity to tackle the existing demand for water. In recent years, constructed wetlands (CW)
 systems and microbial fuel cells (MFCs) have emerged as attractive technologies for sustainable
 wastewater treatment. In this study, constructed wetland microbial fuel cells (CW-MFCs) planted
 with Phragmites australis were tested to evaluate the potential of combining these two systems for
 synthetic greywater treatment and energy recovery. Open (CW) and closed circuit (CW-MFCs)
 reactors were operated for 152 days to evaluate the effect of energy recovery on the removal of soluble
 chemical oxygen demand (sCOD), nutrients and total suspended solids (TSS). Results indicate no
 significant differences for sCOD and phosphate removal efficiencies. CW-MFCs and CW reactors
 presented sCOD removal efficiency of 91.7 ± 5.1% and 90 ± 10% and phosphate removal efficiencies of
 56.3 ± 4.4% and 61.5 ± 3.5%, respectively. Nitrate removal efficiencies were higher in CW: 99.5 ± 1%
 versus 86.5 ± 7.1% in CW-MFCs, respectively. Energy generation reached a maximum power density
 of 33.52 ± 7.87 mW m−3 and 719.57 ± 67.67 mW m−3 at a poised anode potential of −150 mV vs.
 Ag/AgCl. Thus, our results suggest that the incorporation of MFC systems into constructed wetlands
 does allow energy recovery while providing effective greywater treatment.

 Keywords: microbial fuel cell; constructed wetland; greywater; wastewater treatment; water reuse

1. Introduction
     Water is a critical resource that is required for food production, energy generation, and industrial
processes among other applications. Extreme weather due to climate change is projected to affect
the availability and quality of water [1]. For this reason, the efficient use and management of water
resources, including water reuse, is necessary. Greywater is a promising resource, accounting for
50–80% of sewage [2], which could be treated for reuse in green areas or used as wash water [3].
Physical, chemical, and biological technologies are used for greywater treatment. Among several
biological treatments, constructed wetlands have been considered the most cost-effective and
environmentally friendly technology used for this purpose [2].
     Constructed wetlands (CW) systems take advantage of processes that occur naturally in wetlands,
allowing treatment that includes filtration and adsorption by plants and aerobic/anaerobic degradation
by microorganisms [4]. Thus, the reactions that occur in wetland environments generate aerobic and
anaerobic zones that can be utilized for the implementation of microbial fuel cells (MFCs). MFCs
are bioelectrochemical systems that transform chemical energy in organic residues into electricity [5].

Water 2018, 10, 940; doi:10.3390/w10070940                                       www.mdpi.com/journal/water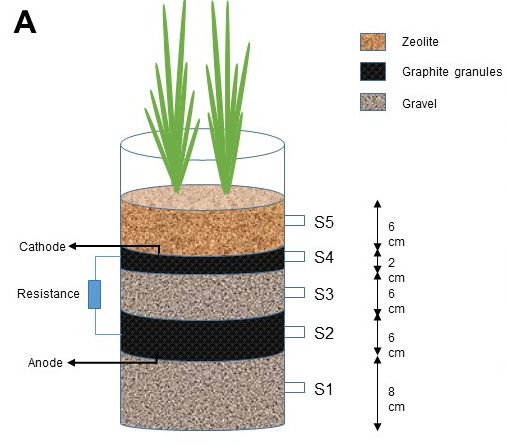
Water 2018, 10, 940 2 of 9
In these systems, organic compounds are oxidized releasing protons and electrons. The electrons are
transferred to the anode and transported through an external circuit to the cathode, where together
with the protons they are used to reduce an acceptor (usually oxygen).
CW is a technology widely implemented to treat different types of wastewater from pilot to
full-scale applications
Water [6]. In
2018, 10, x FOR PEER contrast, and even though MFCs have been used to treat a wide
REVIEW 2 of 9range of
wastewater types [6,7], this technology is still in its infancy and has not been completely developed to
electrons are transferred to the anode and transported through an external circuit to the cathode,
full-scale reactors.
where togetherBothwith technologies
the protons theyhave been
are used to evaluated to treat
reduce an acceptor greywater
(usually [8–10], but the hybrid
oxygen).
system (i.e.,CW constructed
is a technology wetland microbial fuel
widely implemented cells
to treat (CW-MFCs))
different is an emerging
types of wastewater technology
from pilot to full- that
has only been
scale applied [6].
applications forInwastewater
contrast, andtreatment
even though andMFCsnothave
for greywater
been used totreatment
treat a wide[11–14].
range of Most of
CW-MFCs wastewater
have been typesbuilt
[6,7], using
this technology is still in
carbon based its infancy
materials asand
thehas not been(e.g.,
electrode completely developed
graphite and activated
to full-scale reactors. Both technologies have been evaluated to treat greywater [8–10], but the hybrid
carbon granules) due to their low cost, corrosion resistance and high specific surface area [15].
system (i.e., constructed wetland microbial fuel cells (CW-MFCs)) is an emerging technology that has
Different wetland plants have been used, including Phragmites australis, usually operated under
only been applied for wastewater treatment and not for greywater treatment [11–14]. Most of CW-
up-flow conditions
MFCs have been tobuilt
maximize redoxbased
using carbon potential
materials gradient across the
as the electrode substratum
(e.g., graphite and[16]. Preliminary
activated
studiescarbon
indicated that CW-MFCs
granules) due to their presented similar resistance
low cost, corrosion performance to that
and high of CW
specific in terms
surface of chemical
area [15].
oxygenDifferent
demandwetland(COD)plants
removal haveefficiency
been used,(around
including Phragmites
75%) australis, usually
[16]. However, recentoperated
studiesunder
have up-
shown that
flow conditions to maximize redox potential gradient across the substratum
including the MFC component in CW improved COD removal efficiency [16]. In addition, CW-MFCs [16]. Preliminary studies
indicated that CW-MFCs presented similar performance to that of CW in terms of chemical oxygen
allow energy generation, reporting maximum power densities that reach up to 302 mW m−3 [17].
demand (COD) removal efficiency (around 75%) [16]. However, recent studies have shown that
This suggests
including that
the CW-MFCs
MFC component could be aimproved
in CW sustainable CODalternative for greywater
removal efficiency treatment.
[16]. In addition, CW-MFCs
Inallow
this study,
energy we assessed
generation, the performance
reporting maximum power of CW-MFCs in terms
densities that reach up oftotheir capability
302 mW m−3 [17].of removing
This
organicsuggests
matter that
andCW-MFCs
nutrientscouldfrombesynthetic greywater
a sustainable alternativewhile energy istreatment.
for greywater recovered at the same time.
In this study, we assessed the performance of CW-MFCs in terms of their capability of removing
2. Materials
organicand Methods
matter and nutrients from synthetic greywater while energy is recovered at the same time.
2. Materials
2.1. System and Methods
Configuration
Four2.1. reactors were built and operated in this study. Each reactor consisted of a 10 L acrylic column
System Configuration
(20 cm diameter and
Four reactors32were
cm height)
built andwith five sampling
operated points
in this study. Each located at 6, 13, of
reactor consisted 18,a 22
10 and 26 cm from
L acrylic
the bottom of the reactor. Two layers of gravel (particle size: 0–4.75 mm, 4.75–9.53
column (20 cm diameter and 32 cm height) with five sampling points located at 6, 13, 18, 22 and 26 mm, 9.53–12.7 mm,
12.07–19.05
cm frommm) thewere
bottomused asreactor.
of the supporting
Two layersmedium for(particle
of gravel anode (8 cm0–4.75
size: height)
mm,and cathode
4.75–9.53 mm,(6 cm height)
9.53–
12.7 mm,
electrodes. These 12.07–19.05 mm)
electrodes were used
consisted ofastwosupporting
layers of medium for anode
synthetic (8 cmgranules
graphite height) and cathode
(2–12 mm (6 diameter)
cm height) electrodes. These electrodes consisted of two layers of synthetic graphite granules (2–12
(Asbury Carbons) having different heights (6 and 2 cm for anode and cathode respectively). Graphite
mm diameter) (Asbury Carbons) having different heights (6 and 2 cm for anode and cathode
rod andrespectively).
titanium wires were used to connect anode and cathode with an external resistance of 1 kΩ in
Graphite rod and titanium wires were used to connect anode and cathode with an
two of external
the fourresistance
reactors.ofAs such,
1 kΩ two
in two conditions
of the were
four reactors. Asevaluated: open (CW)
such, two conditions wereand closedopen
evaluated: (CW-MFCs)
circuit. (CW)
Finally,
andtwo stems
closed of Phragmites
(CW-MFCs) australistwo
circuit. Finally, were planted
stems in each
of Phragmites reactor
australis above
were the in
planted cathode
each using
zeolite reactor above the cathode usingparticle
(clinoptilolite-mordenite, zeolite (clinoptilolite-mordenite,
size: 0–0.173 mm, 0.2–1 particle
mm, size:1.5–3
0–0.173
mm,mm,3–5
0.2–1 mm,5–8 mm,
mm,
8–10 mm, 1.5–3 mm, 3–5
10–15 mm,mm, 5–8 mm,
15–30 mm)8–10 mm, 10–15 mm,
as supporting 15–30 mm)
medium as supporting
(Figure 1). medium (Figure 1).
1. Constructed
Figure Figure wetland-microbial fuel cell (CW-MFC) built using P. australis. (A) Diagram of
1. Constructed wetland-microbial fuel cell (CW-MFC) built using P. australis. (A) Diagram of
the reactor, wherewhere
the reactor, S1, S2,
S1,S3,
S2,S4,
S3, and S5 are
S4, and sampling
S5 are samplingports
ports located ineach
located in eachlayer;
layer;
(B)(B) Photograph
Photograph of of the
four reactors.
the four reactors.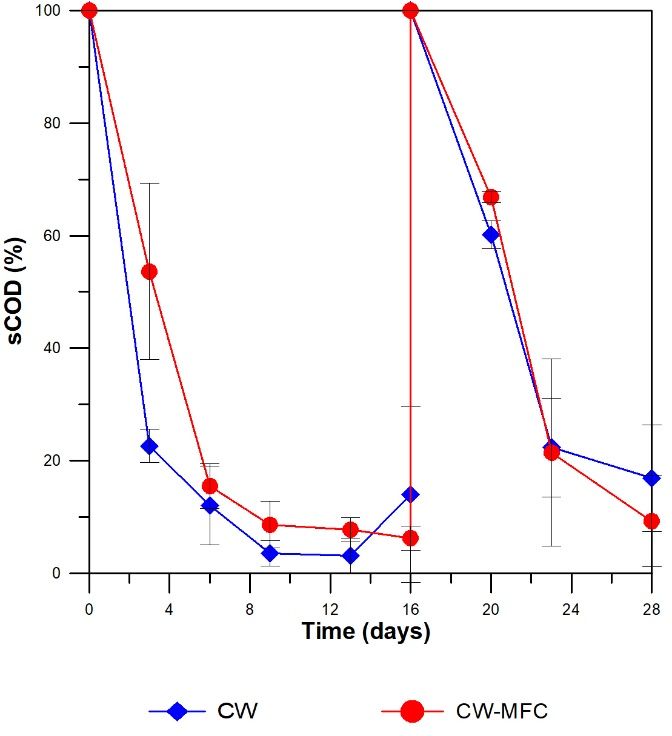
Water 2018, 10, 940                                                                                                    3 of 9

2.2. Synthetic Greywater
     The composition of the synthetic greywater used in this study was based on Arunbabu et al. [18].
The NaHCO3 concentration was increased so as to maintain neutral conditions during operation.
Synthetic greywater was prepared for each batch cycle (i.e., 17 times) by adding the following reagents
per liter of distilled water: 100 mg C3 H6 O3 ; 100 mg C6 H10 O5 ; 50 mg NaC12 H25 SO4 ; 200 mg C3 H8 O3 ;
136.7 mg NaHCO3 ; 50 mg Na2 SO4 ; 36.08 mg KNO3 ; and 21.95 mg K2 HPO4 . The characterization of
the obtained greywater is detailed in Table 1.

                      Table 1. Physicochemical characterization of the influent synthetic greywater.

                                       Parameter              Unit         Mean ± SD 1
                                            pH                 -              7.1 ± 0.4
                                 Electrical conductivity     µS/cm          277.8 ± 37.6
                                        Turbidity             NTU            15.4 ± 8.3
                                        COD, total           mg/L           477.8 ± 70.3
                                      COD, soluble           mg/L           380.4 ± 38.7
                                 Total suspended solids      mg/L            95.9 ± 5.2
                                         Nitrate             mg/L             7.1 ± 0.8
                                        Phosphate            mg/L            19.9 ± 2.6
      1Mean and standard deviation (SD) were calculated using 12 measurements, except for total suspended solids and
      nutrients (nitrate and phosphate), which considered two and three measurements, respectively.

2.3. System Operation
      The four reactors were operated in a controlled temperature room as batch cycle-mode for
152 days. The mean temperature during this period was 30 ± 2 ◦ C (mean ± SD). Illumination was
provided using one white lamp of 30 W during a light period of 12 h per day.
      The operation consisted of four different periods: (i) inoculation; (ii) operation to evaluate COD
removal; (iii) operation with potentiostatic assistance; and (iv) operation to evaluate total suspended
solids (TSS) and nutrient removal, in which two reactors were run as CW and the other two as
CW-MFC. During the first period (55 days), the reactors were inoculated along four batch cycles with
hydraulic retention time (HRT) of 13, 8, 7, and 27 days, respectively. In the first three cycles, 100, 50
and 50 mL of primary effluent from a wastewater treatment plant together with 2.9, 2.95 and 2.95 L of
synthetic greywater were added, respectively. For the fourth batch cycle, 100 mL of batch 3 effluent
was mixed with 2.9 L of synthetic greywater and the mix was added to reactors. The second period
consisted of two batch cycles with HRTs of 16 and 12 days, respectively. In the third period, the anode
potential in CW-MFC reactors was poised at −150 mV versus Ag/AgCl reference electrode using a
potentiostat Interface 1000 (Gamry, Warminster, England) during five batch cycles with HRTs of 2,
2, 2, 31, 2 and 2 days. Finally, in the last period, five batch cycles with HRTs of 2, 2, 8, 8 and 8 days
were operated. During the last two and three batch cycles, TSS and nutrient (nitrate and phosphate)
removal were evaluated.
      Cell voltage was measured continuously every 10 min in all CW-MFC reactors using a Keithley
2700 data acquisition system. Current density was normalized by the effective volume of the anode
electrode using the following equation [11]:

                                                    Pd = V2 /υVan R                                                      (1)

where Pd is the normalized current density (W m−3 ), V is the cells voltage (Volts), υ is the porosity
(0.38 for graphite) [19], Van is the volume of the anode (m3 ), and R the external resistance ( ).

2.4. Chemical Analysis
    For each batch cycle, samples were collected from influent, effluent and S2, S3, and S4 sampling
points (Figure 1) to analyze pH, electric conductivity, turbidity, TSS, COD, soluble chemical oxygen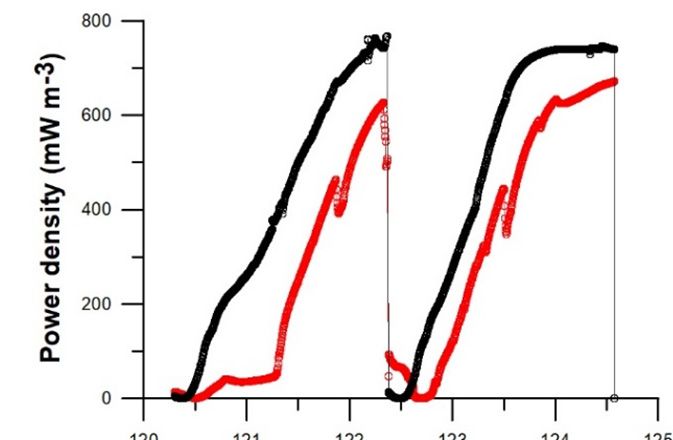
Water 2018, 10, 940                                                                                                                    4 of 9

demand (sCOD), nitrate, and phosphate. Electric conductivity, pH and turbidity were measured
with a Sension5 HACH® conductivity sensor, Orion 720, Thermo pH meter and HI98703 HANNA®
turbidimeter respectively. Total suspended solids were measured according to American Public Health
Association (APHA) standard methods [20]. COD, sCOD, nitrate and phosphate were analyzed using a
          Water 2018, 10, x FOR PEER REVIEW                                                            4 of 9
HACH® DRB200         spectrophotometer according to method 8000; 8039 and 8049, respectively.                For sCOD
determination,
          demand  samples
                    (sCOD), were
                               nitrate,filtered using Electric
                                        and phosphate. 0.2 umconductivity,
                                                               filters. pH and turbidity were measured with
            a Sension5 HACH® conductivity sensor, Orion 720, Thermo pH meter and HI98703 HANNA®
2.5. Statistical Analysisrespectively. Total suspended solids were measured according to American Public
            turbidimeter
            Health Association (APHA) standard methods [20]. COD, sCOD, nitrate and phosphate were
      Meananalyzed
             values and
                      usingstandard
                            a HACH® deviation     were reportedaccording
                                       DRB200 spectrophotometer     for eachtoanalysis.    To compare
                                                                                method 8000;             the treatment
                                                                                               8039 and 8049,
performance      of CW For
            respectively. andsCOD
                               CW-MFCs,      one samples
                                   determination, way analysis    of variance
                                                         were filtered            (ANOVA)
                                                                       using 0.2 um filters.   tests were performed
using Excel data analysis and a significance level of α = 0.05. This was done to detect significant
           2.5. Statistical Analysis
differences between CW and CW-MFCs removal efficiencies of the following pollutants: sCOD, nitrate,
                 Mean values and standard deviation were reported for each analysis. To compare the treatment
phosphate and TSS.
             performance of CW and CW-MFCs, one way analysis of variance (ANOVA) tests were performed
             using Excel data analysis and a significance level of α = 0.05. This was done to detect significant
3.   Results differences
             and Discussion
                         between CW and CW-MFCs removal efficiencies of the following pollutants: sCOD,
             nitrate, phosphate and TSS.
3.1. sCOD Removal
              3. Results and Discussion
      Both CW and CW-MFCs systems were highly effective in the removal of sCOD, and significant
differences3.1.
             were
                sCODnotRemoval
                          detected (p = 0.77). A quick decrease in sCOD levels was observed in both systems
during the first Both CW andof
                   six  days        each cycle.
                                 CW-MFCs              The
                                                systems      sCOD
                                                           were highlyremoval       efficiencies
                                                                         effective in the removal at      day 12
                                                                                                      of sCOD,      forsignificant
                                                                                                                  and     batch cycles five
and six were 90 ± 10% and 91.7 ± 5.1% for CW and CW-MFC, respectively (Figure 2).in COD
           differences   were   not  detected    (p =  0.77). A  quick   decrease   in  sCOD    levels   was   observed        both removal
           systems   during   the  first six  days  of  each  cycle.  The  sCOD    removal    efficiencies
efficiencies from wastewater using MFC-CW ranges from 64% to 99% [5,12,21,22]. This wide range of            at day  12  for  batch
           cycles five and six were 90 ± 10% and 91.7 ± 5.1% for CW and CW-MFC, respectively (Figure 2). COD
COD removal      efficiencies is due to different operational conditions and shows the role of the organic
           removal efficiencies from wastewater using MFC-CW ranges from 64% to 99% [5,12,21,22]. This wide
loading onrange
             CW-MFCs        performance
                  of COD removal                 [16].is Indeed,
                                        efficiencies                 Villaseñor
                                                          due to different          et al.conditions
                                                                             operational    and Liu and   et al.  reported
                                                                                                               shows   the roleperformance
                                                                                                                                  of
variations the
            when     COD
                organic       increase
                         loading            doubling
                                   on CW-MFCs               the original
                                                     performance              concentration
                                                                     [16]. Indeed,  Villaseñor et[23,24].
                                                                                                     al. and Liu However,        the effect of
                                                                                                                   et al. reported
           performance
COD variations     belowvariations
                             100 mgwhen  L−1 ,COD       increase
                                                 as those        doublinginthe
                                                              observed            original
                                                                                this  study,concentration
                                                                                               have not been  [23,24].syndicated
                                                                                                                        However, as a key
           the effect of COD variations below 100 mg L−1, as those observed in this study, have not been
factor thatsyndicated
            could affect      reactor performance. Regarding to COD removal efficiencies from greywater,
                         as a key factor that could affect reactor performance. Regarding to COD removal
this reached
           efficiencies fromusing
               up  to  94%             CW [8]
                                greywater,     thisand     71.63%
                                                     reached   up tousing     MFCCW
                                                                        94% using     [10].[8]Therefore,
                                                                                               and 71.63% since using the
                                                                                                                       MFCsCOD [10]. removal
observed in CW-MFC during batch cycles five and six ranged from 81 to 99%, the hybrid system (i.e.,
           Therefore,   since  the  sCOD    removal     observed  in   CW-MFC     during    batch   cycles  five and   six  ranged
CW-MFC)from      81 to
            arises   as99%,  the hybrid system
                         an attractive              (i.e., CW-MFC)
                                             alternative      for sCOD arisesremoval
                                                                              as an attractive
                                                                                         fromalternative
                                                                                                  synthetic   forgreywater.
                                                                                                                  sCOD removal
              from synthetic greywater.

       Figure 2. Mean percentage of soluble chemical oxygen demand (sCOD) within the CW (blue) and
       CW-MFC (red) reactors during batch 5 and 6. Error bars indicate the standard deviation calculated
       from six measurements.
Water 2018, 10, x FOR PEER REVIEW 5 of 9
Figure 2. Mean percentage of soluble chemical oxygen demand (sCOD) within the CW (blue) and
CW-MFC
Water 2018, 10, 940(red) reactors during batch 5 and 6. Error bars indicate the standard deviation calculated 5 of 9
from six measurements.
A similar increase in removal efficiency (i.e., percentage of sCOD removed) of the sample
corresponding to the port located in the anode (sample point S2 in Figure 1) was observed for both
types of reactors
reactorsbetween
betweenthe thebatch
batchcycles
cyclesbefore connecting
before connecting thethe
potentiostatic assistance
potentiostatic andand
assistance the last
the
threethree
last batch cycles
batch of fourth
cycles period,
of fourth from
period, 72.572.5
from ± 3.5%
± 3.5% to 85.3
to 85.3 ± 1.5%
± 1.5% for CW and and
for CW 60 ± 60 ± 1.41%
1.41% to 75to±
75 ± 5.57%
5.57% for CW-MFCs.
for CW-MFCs.This suggest that posing
This suggest the anode
that posing at −150atmV
the anode −150
vs. mV
Ag/AgCl in CW-MFC
vs. Ag/AgCl reactors
in CW-MFC
did not affect
reactors COD
did not removal
affect COD efficiency, and the increase
removal efficiency, and theobserved in COD removal
increase observed in CODcould be produced
removal could be
by the acclimation
produced of bacteria of
by the acclimation to bacteria
operational conditions and
to operational the evolution
conditions and theofevolution
the microbial community
of the microbial
in the reactor.
community Thisreactor.
in the phenomenon had been observed
This phenomenon had beeninobserved
MFC, where an power
in MFC, wheredensity
an powerincrease
densityis
observedisinobserved
increase the long-term
in the [25].
long-term [25].
3.2. Nutrients and
3.2. Nutrients and TSS
TSS Removal
Removal
In wetlands, nitrate removal, occurs mainly by biological reaction, such as denitrification
denitrification [11].
[11].
Nitrate
Nitrate removal
removalwas
wassignificantly
significantlyhigher
higher(p(p
= 0.01)
= 0.01) in in
CWCWreactors than
reactors in CW-MFC
than in CW-MFC reactors ± 1%
(99.5(99.5
reactors ±
versus 86.5 ± 7.1%, respectively) (Figure 3). These differences could be explained
1% versus 86.5 ± 7.1%, respectively) (Figure 3). These differences could be explained due to due to anode
and nitrate competition
competition as electron
electron acceptors
acceptors in in CW-MFC
CW-MFC reactors.
reactors. In consequence, part of the
electrons
electrons were used for electricity generation (i.e., anode respiration) instead of nitrate reduction [26],
which
which decreases
decreases nitrate
nitrate removal.
removal.
Figure 3. Mean nitrate and phosphate removal efficiency corresponding to the last three batch cycles,
totalsuspended
and total suspended solids
solids (TSS)
(TSS) removal
removal efficiency
efficiency corresponding
corresponding to batch
to the last the last
cyclebatch cycle in
in constructed
constructed wetlands (CW) (blue) and CW-MFC (red) reactors. Error bars indicate the standard
wetlands (CW) (blue) and CW-MFC (red) reactors. Error bars indicate the standard deviation calculated
deviation
from four calculated fromfor
measurements four measurements
nitrate for nitrate
and phosphate, and phosphate,
and from and fromfor
two measurements twoTSS.
measurements
for TSS.
No significant differences in phosphate removal efficiency were observed (p = 0.11) between
No significant
the two differencesremoval
systems. Phosphate in phosphate removal
efficiency wasefficiency were
61.5 ± 3.5% inobserved (p = 0.11)
CW reactors between
and 56.3 the
± 4.4%
two systems. Phosphate removal
in CW-MFC reactors (Figure 3). efficiency was 61.5 ± 3.5% in CW reactors and 56.3
In CW systems, phosphate removal occurs mainly by ± 4.4% in CW-
MFC reactors (Figureby filter
adsorption/precipitation 3). In CW
media, systems,
uptake phosphate
by plants removal byoccurs
and immobilization mainly [27].
microorganisms by
adsorption/precipitation by filter media, uptake by plants and immobilization by
Regarding TSS removal, even though only two measurements were conducted, significant microorganisms
[27].
differences were not observed (p = 0.11). TSS removal was 52.9 ± 12.7% and 78.4 ± 5.5% for CW
and CW-MFC, respectively (Figure 3). These values are lower than those reported by Ramprasad
and Philip [8] in CW used to treat greywater, which included a pre-treatment (settling tank) unit,
and slightly lower than those reported by Saumya et al. [9] in CW without pre-treatment. These authorsWater 2018, 10, 940 6 of 9
reported TSS removal efficiencies from 80 to 94% and 81.95%, respectively. This suggests the importance
of including preliminary treatment units (e.g., sand filter and sedimentation tank) with CW or CW-MFC
systems for complete greywater treatment.
3.3. Electricity Generation
Setting the anode potential had shown to influence extracellular electron transfer rate allowing
to enhance current generation [28] and selecting anode-respiring bacteria, such as Geobacter
sulfurreducens [29,30], when the anode potential is poised around −150 mV vs. Ag/AgCl. When the
anode was poised at −150 mV vs. Ag/AgCl, power density notably increased reaching a maximum
value of 719.57 ± 67.67 mW m−3 (Figure 4), which is around 20 times higher than the maximum
value reached by the system without potentiostatic assistance (33.52 ± 7.87 mW m−3 ) (Figure S1 in
Supplementary Material). This value is higher than those reported by Doherty et al. (280 mW m−3 ) and
Fang et al. (302 mW m−3 ) for CW-MFCs treating wastewater [17,19] (Table 2), where the anode potential
was not poised. Once potentiostatic assistance was disconnected (day 142), power density gradually
dropped until it reached a value around 6 mW m−3 (Figure S1 in Supplementary Material). The results
suggest that poised anode potential at −150 mV vs. Ag/AgCl had no influence in performance of the
reactor during the fourth period. However, to poise anode potential could allow raising the potential
difference between electrodes, which were separated only by 6 cm, improving current generation and
the subsequent energy recovery. The distance between electrodes is important for increasing electricity
generation in MFC systems. Song et al. [14] reported a lower power density in CW-MFCs when the
distance between electrodes decreases from 20 to 10 cm [14]. When reducing the distance between
electrodes, internal resistance decreases, but the dissolved oxygen in anode could not generate anoxic
conditions suitable for exoelectrogenic microorganism, affecting power generation [14].
Table 2. Comparison of COD removal efficiency and power density between previous studies and
this study.
Reference Plant Species COD Removal Efficiency (%) Maximum Power Density 1
Zhao et al. [5] Phragmites australis 76.5 9.4 mW m−2
Wu et al. [12] Iris pseudacorus 99 9.6 mW m−2
Liu et al. [31] Ipomoea aquatic 85.7 12.42 mW m−2
Yadav et al. [21] Canna indica 75 15.73 mW m−2
Oon et al. [11] Typha latifolia 91.2 93 mW m−3
Doherty et al. [22] Phragmites australis 64 280 mW m−3
Fang et al. [17] Ipomoea aquatic 94.8 302 mW m−3
87 (*) 33.52 ± 7.87 mW m−3
This study Phragmites australis
92 (**) 719.57 ± 67.67 mW m−3 (***)
1 Units vary according to what reported in each study. (*) COD removal obtained in CW-MFC reactors.
(**) COD removal obtained in CW reactors. (***) Power density obtained in CW-MFC reactors operated under
potentiostatic assistance.
The development of hybrid CW-MFC systems could improve the performance and sustainability
of conventional CW used for sub-surface wastewater treatment. Its performance would be improved
by including an alternative electron acceptor (i.e., anode electrode) in the anaerobic zone of the
substratum, reducing methane production [32] and its effect on global warming [33]. Electricity
recovery by CW-MFCs systems is another promising positive outcome expected from this technology.
Further interdisciplinary research is required to reach power outputs in the order of magnitude required
to load lighting, sensors, or other applications [34]. The use of poised potential anodes emerges as an
opportunity to tackle this limitation and this article represents an effort on this direction. However,
additional studies are needed to evaluate the efficiency of this strategy under long-term operation.Water 2018, 10, x FOR PEER REVIEW 7 of 9
anodes emerges as an opportunity to tackle this limitation and this article represents an effort on this
direction. However, additional studies are needed to evaluate the efficiency of this strategy under
Water 2018, 10, 940 7 of 9
long-term operation.
Power density
Figure4.4. Power
Figure densityobtained
obtainedduring the last
during the two
last batch
two cycles
batch of the third
cycles period,
of the during
third potentiostatic
period, during
assistance −150
potentiostatic mV vs.−150
assistance Ag/AgCl.
mV vs.Curves represent
Ag/AgCl. Curvesduplicate
representreactors.
duplicate reactors.
4.4.Conclusions
Conclusions
This
Thisstudy
studyevaluated
evaluatedthe theperformance
performanceofofCW-MFC
CW-MFCasasa agreywater
greywatertreatment
treatmentandandasasananelectricity
electricity
generation
generationsystem.
system.Removal
Removal efficiencies ofof
efficiencies 91.7 ± 5.1%,
91.7 86.586.5
± 5.1%, ± 7.1% andand
± 7.1% 56.356.3
± 4.4% werewere
± 4.4% observed for
observed
sCOD, nitrate,
for sCOD, and phosphate
nitrate, and phosphate respectively. These
respectively. results
These demonstrate
results demonstratethe the
effectiveness of using
effectiveness of usinga
CW-MFC
a CW-MFC system to treat
system synthetic
to treat syntheticgreywater.
greywater. Power
Powerdensity
densityincreased
increased when
whenanode
anodepotential
potentialwas was
poised
poisedatat−150
−150 mVmVvs.vs.Ag/AgCl,
Ag/AgCl, reaching
reachinga amaximum
maximumvalue
valueofof719.57
719.57±±67.67
67.67mWmWmm−3−. 3This is is
. This the first
the first
study showing that CW-MFC could be a sustainable alternative for greywater treatment
study showing that CW-MFC could be a sustainable alternative for greywater treatment together with together
with electricity
electricity production.
production. Further
Further studies
studies are needed
are needed to evaluate
to evaluate poised poised potential
potential strategies
strategies and
and optimize
optimize
long-term long-term
performanceperformance of this technology
of this technology for sustainable
for sustainable water
water treatment andtreatment and energy
energy recovery.
recovery.
Supplementary Materials: The following are available online at http://www.mdpi.com/2073-4441/10/7/940/s1,
Figure S1: Performance of CW-MFC during the four periods (152 days of operation).
Supplementary Materials: The following are available online at www.mdpi.com/link, Figure S1: Performance
ofAuthor
CW-MFC Contributions: Allperiods
during the four authors(152
collaborated in this work. I.A., K.L. and I.V. conceived and designed the
days of operation).
experiments; I.A. performed the experiments and analyzed the data; N.F.T. discussed the results and wrote the
Author
paper; Contributions: All authors
K.L. and I.V. reviewed collaborated
and edited in this work. I.A., K.L. and I.V. conceived and designed the
the manuscript.
experiments; I.A. performed the experiments and analyzed the data; N.F.T. discussed the results and wrote the
Funding: This research was funded by the CEDEUS center CONICYT/FONDAP/15110020.
paper; K.L. and I.V. reviewed and edited the manuscript.
Acknowledgments: The authors would like to thank Mauricio Medel for his support in the experimental work
Funding:
and EmilyThis research
Hannon forwas
her funded by in
assistance thethe
CEDEUS
writingcenter CONICYT/FONDAP/15110020.
process of this article. This work is part of the microbial fuel
cells project in CEDEUS.
Acknowledgments: The authors would like to thank Mauricio Medel for his support in the experimental work
Conflicts
and of Interest:
Emily Hannon Theassistance
for her authors declare
in the no conflict
writing of interest.
process of this article. This work is part of the microbial fuel
cells project in CEDEUS.
References
Conflicts of Interest: The authors declare no conflict of interest.
1. UN-Water. Climate Change Adaptation: The Pivotal Role of Water. In Policy Brief ; UN-Water: Geneva,
References
Switzerland, 2010.
2. Li, F.; Wichmann, K.; Otterpohl, R. Review of the technological approaches for grey water treatment and
1. UN-Water. Climate Change Adaptation: The Pivotal Role of Water. In Policy Brief; UN-Water: Geneva,
reuses. Sci. Total Environ. 2009, 407, 3439–3449. [CrossRef] [PubMed]
Switzerland, 2010.
3. Wurochekke, A.A.; Harun, N.A.; Mohamed, R.M.S.R.; Kassim, A.H.B.M. Constructed wetland of Lepironia
2. Li, F.; Wichmann, K.; Otterpohl, R. Review of the technological approaches for grey water treatment and
articulata for household greywater treatment. APCBEE Proced. 2014, 10, 103–109. [CrossRef]
reuses. Sci. Total Environ. 2009, 407, 3439–3449.
4. Kadlec, R.H.; Wallace, S. Treatment Wetlands, 2nd ed.; CRC Press: Boca Raton, FL, USA, 2008.
3. Wurochekke, A.A.; Harun, N.A.; Mohamed, R.M.S.R.; Kassim, A.H.B.M. Constructed wetland of Lepironia
5. Zhao, Y.; Collum, S.; Phelan, M.; Goodbody, T.; Doherty, L.; Hu, Y. Preliminary investigation of constructed
articulata for household greywater treatment. APCBEE Proced. 2014, 10, 103–109.
wetland incorporating microbial fuel cell: Batch and continuous flow trials. Chem. Eng. J. 2013, 229, 364–370.
[CrossRef]Water 2018, 10, 940 8 of 9
6. Wu, H.; Zhang, J.; Ngo, H.H.; Guo, W.; Hu, Z.; Liang, S.; Fan, J.; Liu, H. A review on the sustainability of
constructed wetlands for wastewater treatment: Design and operation. Bioresour. Technol. 2015, 175, 594–601.
[CrossRef] [PubMed]
7. Pant, D.; Van Bogaert, G.; Diels, L.; Vanbroekhoven, K. A review of the substrates used in microbial fuel cells
(MFCs) for sustainable energy production. Bioresour. Technol. 2010, 101, 1533–1543. [CrossRef] [PubMed]
8. Ramprasad, C.; Philip, L. Surfactants and personal care products removal in pilot scale horizontal and
vertical flow constructed wetlands while treating greywater. Chem. Eng. J. 2016, 284, 458–468. [CrossRef]
9. Saumya, S.; Akansha, S.; Rinaldo, J.; Jayasri, M.A.; Suthindhiran, K. Construction and evaluation of prototype
subsurface flow wetland planted with Heliconia angusta for the treatment of synthetic greywater. J. Clean. Prod.
2015, 91, 235–240. [CrossRef]
10. Sajithkumar, K.J.; Ramasamy, E.V. Greywater treatment with simultaneus generation of energy using low-cost
microbial fuel cells. Environ. Res. Eng. Manag. 2015, 71, 5–12. [CrossRef]
11. Oon, Y.-L.; Ong, S.-A.; Ho, L.-N.; Wong, Y.-S.; Dahalan, F.A.; Oon, Y.-S.; Lehl, H.K.; Thung, W.-E. Synergistic
effect of up-flow constructed wetland and microbial fuel cell for simultaneous wastewater treatment and
energy recovery. Bioresour. Technol. 2016, 203, 190–197. [CrossRef] [PubMed]
12. Wu, D.; Yang, L.; Gan, L.; Chen, Q.; Li, L.; Chen, X.; Wang, X.; Guo, L.; Miao, A. Potential of novel wastewater
treatment system featuring microbial fuel cell to generate electricity and remove pollutants. Ecol. Eng. 2015,
84, 624–631. [CrossRef]
13. Wang, J.; Song, X.; Wang, Y.; Abayneh, B.; Ding, Y.; Yan, D.; Bai, J. Microbial community structure of
different electrode materials in constructed wetland incorporating microbial fuel cell. Bioresour. Technol. 2016,
221, 697–702. [CrossRef] [PubMed]
14. Song, H.; Zhang, S.; Long, X.; Yang, X.; Li, H.; Xiang, W. Optimization of bioelectricity generation in
constructed wetland-coupled microbial fuel cell systems. Water 2017, 9, 185. [CrossRef]
15. Li, W.-W.; Sheng, G.-P. Microbial fuel cells in power generation and extended applications. In Biotechnology in
China III: Biofuels and Bioenergy; Bai, F.-W., Liu, C.-G., Huang, H., Tsao, G.T., Eds.; Springer: Berlin, Germany,
2012; pp. 165–197.
16. Doherty, L.; Zhao, Y.; Zhao, X.; Hu, Y.; Hao, X.; Xu, L.; Liu, R. A review of a recently emerged technology:
Constructed wetland—Microbial fuel cells. Water Res. 2015, 85, 38–45. [CrossRef] [PubMed]
17. Fang, Z.; Song, H.-L.; Cang, N.; Li, X.-N. Performance of microbial fuel cell coupled constructed wetland
system for decolorization of azo dye and bioelectricity generation. Bioresour. Technol. 2013, 144, 165–171.
[CrossRef] [PubMed]
18. Arunbabu, V.; Sruthy, S.; Antony, I.; Ramasamy, E.V. Sustainable greywater management with Axonopus
compressus (broadleaf carpet grass) planted in sub surface flow constructed wetlands. J. Water Process Eng.
2015, 7, 153–160. [CrossRef]
19. Doherty, L.; Zhao, Y.; Zhao, X.; Wang, W. Nutrient and organics removal from swine slurry with simultaneous
electricity generation in an alum sludge-based constructed wetland incorporating microbial fuel cell
technology. Chem. Eng. J. 2015, 266, 74–81. [CrossRef]
20. American Public Health Association; American Water Works Association; Water Environment Federation.
Standard Methods for the Examination of Water and Wastewater; American Public Health Association:
Washington, DC, USA, 2005.
21. Yadav, A.K.; Dash, P.; Mohanty, A.; Abbassi, R.; Mishra, B.K. Performance assessment of innovative
constructed wetland-microbial fuel cell for electricity production and dye removal. Ecol. Eng. 2012,
47, 126–131. [CrossRef]
22. Doherty, L.; Zhao, X.; Zhao, Y.; Wang, W. The effects of electrode spacing and flow direction on the
performance of microbial fuel cell-constructed wetland. Ecol. Eng. 2015, 79, 8–14. [CrossRef]
23. Villaseñor, J.; Capilla, P.; Rodrigo, M.A.; Cañizares, P.; Fernández, F.J. Operation of a horizontal subsurface
flow constructed wetland—Microbial fuel cell treating wastewater under different organic loading rates.
Water Res. 2013, 47, 6731–6738. [CrossRef] [PubMed]
24. Liu, S.; Song, H.; Wei, S.; Yang, F.; Li, X. Bio-cathode materials evaluation and configuration optimization for
power output of vertical subsurface flow constructed wetland—Microbial fuel cell systems. Bioresour. Technol.
2014, 166, 575–583. [CrossRef] [PubMed]Water 2018, 10, 940 9 of 9
25. Aelterman, P.; Rabaey, K.; Pham, H.T.; Boon, N.; Verstraete, W. Continuous electricity generation at high
voltages and currents using stacked microbial fuel cells. Environ. Sci. Technol. 2006, 40, 3388–3394. [CrossRef]
[PubMed]
26. Sukkasem, C.; Xu, S.; Park, S.; Boonsawang, P.; Liu, H. Effect of nitrate on the performance of single chamber
air cathode microbial fuel cells. Water Res. 2008, 42, 4743–4750. [CrossRef] [PubMed]
27. Park, J.-H.; Wang, J.J.; Kim, S.-H.; Cho, J.-S.; Kang, S.-W.; Delaune, R.D.; Seo, D.-C. Phosphate removal
in constructed wetland with rapid cooled basic oxygen furnace slag. Chem. Eng. J. 2017, 327, 713–724.
[CrossRef]
28. Ishii, S.I.; Suzuki, S.; Norden-Krichmar, T.M.; Phan, T.; Wanger, G.; Nealson, K.H.; Sekiguchi, Y.; Gorby, Y.A.;
Bretschger, O. Microbial population and functional dynamics associated with surface potential and carbon
metabolism. ISME J. 2014, 8, 963–978. [CrossRef] [PubMed]
29. Torres, C.I.; Krajmalnik-Brown, R.; Parameswaran, P.; Marcus, A.K.; Wanger, G.; Gorby, Y.A.; Rittmann, B.E.
Selecting anode-respiring bacteria based on anode potential: Phylogenetic, electrochemical, and microscopic
characterization. Environ. Sci. Technol. 2009, 43, 9519–9524. [CrossRef] [PubMed]
30. Wei, J.; Liang, P.; Cao, X.; Huang, X. A new insight into potential regulation on growth and power generation
of Geobacter sulfurreducens in microbial fuel cells based on energy viewpoint. Environ. Sci. Technol. 2010,
44, 3187–3191. [CrossRef] [PubMed]
31. Liu, S.; Song, H.; Li, X.; Yang, F. Power generation enhancement by utilizing plant photosynthate in microbial
fuel cell coupled constructed wetland system. Int. J. Photoenergy 2013, 2013, 10. [CrossRef]
32. Arends, J.B.A.; Speeckaert, J.; Blondeel, E.; De Vrieze, J.; Boeckx, P.; Verstraete, W.; Rabaey, K.; Boon, N.
Greenhouse gas emissions from rice microcosms amended with a plant microbial fuel cell. Appl. Microbiol.
Biotechnol. 2014, 98, 3205–3217. [CrossRef] [PubMed]
33. Maucieri, C.; Barbera, A.C.; Vymazal, J.; Borin, M. A review on the main affecting factors of greenhouse
gases emission in constructed wetlands. Agric. For. Meteorol. 2017, 236, 175–193. [CrossRef]
34. Noori, M.T.; Ghangrekar, M.M.; Mukherjee, C.K. Sediment microbial fuel cell and constructed wetland
assisted with it: Challenges and future prospects. In Microbial Fuel Cell: A Bioelectrochemical System
That Converts Waste to Watts; Das, D., Ed.; Springer International Publishing: Cham, Switzerland,
2018; pp. 335–352.
© 2018 by the authors. Licensee MDPI, Basel, Switzerland. This article is an open access
article distributed under the terms and conditions of the Creative Commons Attribution
(CC BY) license (http://creativecommons.org/licenses/by/4.0/).You can also read