Available online www.jsaer.com Journal of Scientific and Engineering Research, 2019, 6(2):144-153
←
→
Page content transcription
If your browser does not render page correctly, please read the page content below
Available online www.jsaer.com

 Journal of Scientific and Engineering Research, 2019, 6(2):144-153

 ISSN: 2394-2630
 Research Article CODEN(USA): JSERBR

Modeling of Seawater Intrusion Applied in the Coastal Aquifer of the Quaternary
Sands of the Niayes Area, Mboro-Senegal

Mamadou S. Diallo1, Mahécor Diouf1, Papa B. D. THIOUNE1,2, Mor NGOM1,
El Hadji B. DIAW1*
1
 Laboratory of Science and Technology of Water and Environment (LaSTEE), Polytechnic School of Thies BP
A10 Thiès, Senegal, (elhbdiaw@ept.sn*)
2
 University of Thies, Higher Institute of Agricultural and Rural Training (ISFAR) PO Box 54, Bambey, Senegal
Abstract Groundwater resources in the coastal aquifer of the Niayes region are overexploited. Therefore,
dissolved salts are the main contaminants in the groundwater of the area combined with those due to the
invasion of salt water, caused mainly by economic activities related to industry and irrigation as well as
domestic activities. One of the most significant effects of spatially varying pumping from the aquifer of north
littoral is the intensification of seawater intrusion. This paper deals the methods of prevention of seawater
encroachment, predicting the location and movement of the saltwater interface in the areas closed to Mboro. The
focus of this work is to develop two major approaches: the first one approach is the development of an analytic
model and the second is the development of a finite volume and finite difference simulation model using
different management scenarios. An analytic model based on sharp interface approach is calibrated and
validated by using hydraulic head observations. A numerical model based on transition zone approach is
verified using the calibrated model data. Initial heads and concentration were simulated using a MARTHE
computational code and simulation results are compared with previously analytic solutions where good
agreement is observed.

Keywords Seawater intrusion, Niayes area, sharp interface, modeling, contaminants, Senegal
1. Introduction
In the Niayes area, saltwater intrusion can have serious consequences in terms of environmental and economic
impacts. The Niayes area is an agricultural region, which spreads from Dakar to Saint-Louis with a length of
180 km by 20 km wide, brings together nearly 80% of the vegetable and horticultural production in Senegal [1].
Groundwater resources in coastal around the Niayes area are overexploited [2, 3]. One of the most important
impacts of over-pumping in a coastal aquifer is the intensification of seawater intrusion.
Hence, there is a need to predict the location and movement of the potential contamination fronts. Practical
management requires knowledge of not only the present response, but also of the long-term transient response.
For these managerial purposes, a numerical model can assist in estimating the location of the
freshwater/saltwater interface for given sets of hydrological conditions.
The saltwater intrusion problem is modeled using an approach giving rise to a transition zone between two
fluids [4]. The combined effect of these mechanisms gives rise to a transition zone with variable solute
concentration. Simulation of the transition zone separating freshwater and saltwater requires simultaneous
solution of the governing equations of fluid flow and solute transport. Such an approach leads to density-
dependent transport models that are limited in their field application by computational constraints [5]. A second
approach to modeling saltwater intrusion is the sharp interface approach. In this case, the saltwater and

 Journal of Scientific and Engineering Research

 144
Diallo MS et al Journal of Scientific and Engineering Research, 2019, 6(2):144-153

freshwater are considered as two immiscible fluids separated by an interface. The main approximation is
provided from the Ghyben-Herzberg [5,6] works that were latter generalized in several models [7]. This
approximation need to be carefully verified before application.
Thus, the main objective of this work is to determine the position of the freshwater/saltwater interface in the
coastal aquifer of the Niayes area using two modeling methods. First a Mathematical modeling using an
analytical solution [8, 9]. For this analytical solution, the freshwater and saltwater flow equations are processed
simultaneously to determine the position of the interface. Then, we proceeded by numerical modeling from the
MARTHE computational code [10]. The code allowed us to simulate and predict solute concentrations in the
coastal aquifer niayes.

2. Materials and Methods
2.1. Study Area

 Figure 1: Location of the study area
The North littoral of Senegal (denominated Niayes) area registers administratively in the four regions bordering
the maritime fringe of northern Senegal including Dakar, Thiès, Louga and Saint-Louis. It extends over a length
of about 180 km and on a 20 to 30 km wide depending on the studies [1]. It is located between latitude 14 o3 and
16oN, then longitudes 16o and 17o5 W [1, 11]. Figure 1 shows the area with the main municipalities concerned.
With decentralization, several municipalities have been built on this coastal strip. They are Sangalcam, Diender,
Bayakh, Kayar, Notto Gouye Diama, Mboro, Darou Khoudos, Gandon, Léona and Thieppe, all of them
agricultural.
The "Niayes" are closed inter-dune depressions with a flush or uplifted aquifer and are characterized by a
succession of dunes and depressions. The Niayes zone includes several ecological units and contains very
important biological and mining resources whose exploitation deserves special attention.
In the hydrogeolical context, the Quaternary sand aquifer contained in the tank of the marine and continental [8]
mainly occupy the Niayes area. The groundwater recharge is performed by rainwater infiltration and its
productivity often reaches 100 m3/h [11].

2.2. Mathematical Model
Modelling involves a large number of issues, ranging from understanding site geology to analytical or numerical
methods and the way to use these in order to represent the studied aquifer. This work starts by describing the
sharp interface approach and its analytical solution. But there are many questions about its validity. This section
concludes with a discussion on methods by several authors. Gionnoulopoulos in 2004 [12] studied the

 Journal of Scientific and Engineering Research

 145
Diallo MS et al Journal of Scientific and Engineering Research, 2019, 6(2):144-153

application validity of the sharp interface approach and the optimal amount of water that can be pumped. The
study is based on the assumption that the sharp interface approach can be applied if the transition zone is narrow
relative to the domain dimension [11]. Pool and Carrera [13] have introduced a corrective factor to properly
associate the Ghyben-Herzberg relationship with the critical pumping rate of coastal aquifers.
a. The modeling procedure
We consider the coordinates (x, z) ϵ IRN (N=1 or 2 for the aquifers) and the time t ϵ [0, +∞ [where x is the
horizontal coordinate, z the vertical one and t the time.
 z
 z=a(x,y)
 air
 dry soil

 z=h0 x

 Q z=g(x,y,t) sea
 b
 z=b(x,y) A .
 L
 bedrock
 {h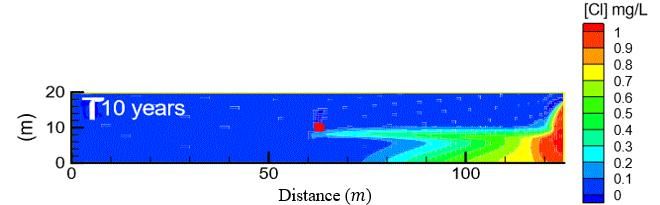
Diallo MS et al Journal of Scientific and Engineering Research, 2019, 6(2):144-153 Where is transmissivity (m2/s), is hydraulic head (m) and is rate of flow (m3/s). The Transmissivity is given by: T = KH = K(h + g) (3) Where H (m) is the thickness of the aquifer saturated by water, g (m) position of the fresh/saline water interface, K (m/s) the hydraulic conductivity. The law of conservation of the flow of water by infiltration is given by: dQ Q (Q x) Ix 0 (4) dx The recharge was determined from the water cycle balance equation: I P ( E ETR S ) (5) Where the quantity of measured rain (mm), E is the stream of water (mm), ETR is real evapotranspiration (mm) and S is the stock in the soil (mm), is infiltration or recharge (mm/an). Because the flow is steady and assumed horizontal, we have used the Ghyben-Herzberg relationship = ×ℎ (6) 1 − Where = ; with = is density difference ratio, (kg/m3) is the density of fresh water and (kg/m3) is density of saline water. Now we obtain after putting equation 4 in equation 2 (Darcy’s Law) K dg (1 )(2 g )Q (7) 2 2 dx Because of the steady state, the velocity of water is constant and the following equation 2 dg 2Q0 2 (8) dx K (1 ) x 0 Or equation 4 can be rewrite as below: dg 2 2 I 2 x c1 (9) dx K (1 ) From equation (7) we can determine c1 and equation (8) becomes: I 2 2Q0 2 g2 x2 x c2 (10) K (1 ) K (1 ) The position of the interface is given by: 2 g 2 h02 [2Q0 Ix]x (11) K (1 ) If there is no recharge, the interface is a portion of parabolic equation: 2Q0 2 g 2 h02 x (12) K (1 ) Where ℎ0 is the thickness (m). b. Results and discussions of the analytical model solution To realize these simulations the input values parameters are given in the table n°1. We realize the series of simulations in ahomogenous rectangle with 1800 m and 80 m without well. The substratum is considered as the level of reference b = 0 m. We have programed the solutions by using Matlab software and the results have been exploited in Excel programing. Journal of Scientific and Engineering Research 147
Diallo MS et al Journal of Scientific and Engineering Research, 2019, 6(2):144-153

 Table 1: Parameters of simulations in a general case
 Parameters Values
 Rate of flow pumping, Q 1,29 m3/h
 Hydraulic conductivity, K 4,356.10-3 m/s
 Aquifer length, Lx 1800 m
 Average recharge estimated, I 8,7.10-8 m/s
 Aquifer thickness, h0 80 m
 Density of fresh water, 1000 kg/m
 Density of saline water, s 1025 kg/m3
 Density difference ratio, ϵ 0,025

 Figure 3: Representation of the steady state analytical solution in the general case
The exact mathematical statement for an interface problem is presented in Figure 2, two regions such that the
fresh water and the saline water zones, above and below the interface, respectively. It is shown there
Freshwater/saline water with the use of the theoretically established Ghyben-Herzberg principle states that the
hydraulic head is more important in the case where the aquifer is shallower. The analytical model also reveals
that the penetration length of the saline intrusion depends on the permeability of the aquifer and bedrock. The
analytical solution thus implemented (Figure 2) will be used later to model the saline intrusion into the Mboro
zone. We apply the analytical solution previously implemented, in the Mboro zone whose depth varies between
2 and 20 m. This analytical model was inspired by the model developed by Albitar [14] and the simulation input
data are presented in Table No. 2.
 Table 2: Parameters of simulations the zone of Mboro
 Parameters Values
 Rate of flow pumping, Q 0,79 m3/h
 Hydraulic conductivity, K 5,78.10-5 m/s
 Aquifer length, Lx 360 m
 Annual recharge, I 5 mm/an
 Aquifer thickness, h0 80 m
 Density of fresh water, 1000 kg/m
 Density of saline water, s 1025 kg/m3
 Density difference ratio, ϵ 0,025

 Journal of Scientific and Engineering Research

 148
Diallo MS et al Journal of Scientific and Engineering Research, 2019, 6(2):144-153

 Figure 4: Steady state analytical solution in the Mboro zone
Figure 3 shows the steady state intrusion of seawater into the Mboro zone without a pumping well. In this
application, we distinguish a complexity of modeling related to geometry and the nature of the aquifer studied
which is characterized by permeability, thickness, well position if there exist. The solution observed here obeys
the theory that has been established as a sharp interface approach model above of Figure 2. The penetration of
the salt wedge is 280 m well there is a clear interface separating fresh water and saline water whose position
depends on the depth of the water table, recharge, water flow as the reality reveals. It can now be confirmed that
the analytical solution represents the best behavior of the aquifer if all data are available. However, due to the
mathematical complexity of the problem as stated in this way, no analytical solution is available (except for a
very small number of specific cases) and various authors have employed different forms of approximations. In
spite of the simply achieved by introducing these approximations, the problem still requires a numerical solution
for problems of practical interest.

2.4. Numerical modeling
The numerical approach by hydrodynamic modeling constitutes a method in itself to highlight the phenomena of
seawater intrusion. Hydrodynamic modeling tools can be used to design localization models of seawater
intrusion and to simulate its reaction depending to different scenarios of exploitation, protection or climate
change.
In this section of work we use the computational code MARTHE allowing to simulate flow, transport and
energy in three dimensional porous medium with finite volume approach [10], [11]. We focus here on the
impact of the current pumping, which is studied according to two parameters: the amount of pumping and the
position of the wells. The general Darcy equation coupled with the solute mass balance equation referred to as
the transport equation is [7, 12, 13]:

 =− ∇ + ∇ Ω

 ℎ = 0 =8 Ω\Γ
 ℎ =0 = 9 Γ

 (13)
 ∅ = ∇. ∅ ∇ − ∇ + Ω and t > 0

 = 0 / Γ > 0
 = 1 / Γ > 0
Where Ω is the interior of the domain; Γ et Γ are respectively the boundary site East and boundary site West
of the domain; = ( , , , ) is concentration of solute (mg.L-1); is porosity (m3/m3), gravitation
acceleration (m.s-2); is pressure of fluid (Pa); is altitude (m); is velocity of Darcy (m.s-1) ; D is tensor of

 Journal of Scientific and Engineering Research

 149
Diallo MS et al Journal of Scientific and Engineering Research, 2019, 6(2):144-153

dispersion (m2.s-1) and Q is the mass flux injected (source term) (Kg/s/m3). To have a unique solution, the initial
conditions and the boundary conditions are well specified in the model above equation (13). Our aquifer system
will be modeled in vertical section. In reality, we considered the Mboro zone with an average depth of between
2 and 20 m. The sea is located on the right boundary coinciding with the eastern boundary ( Γ ), the continental
face is located on the left at the western boundary (Γ ).
 a. Presentation of the numerical model MARTHE
MARTHE (Modélisation d’Aquifères par maillage Rectangulaire en régime Transitoire pour le calcul
Hydrodynamique des Ecoulements) allows the computation of fluid flows and transfers of mass and energy in
three-dimensional porous media with a finite volume approach. The schemes can be simple or complex
(unsaturated zone, multiphasic flows, vegetation considerations, interaction with rivers,). As part of this project,
the MARTHE computational code makes carry out an imposed potential of salt water, which has been set at 0 at
the western limit of the model. In the other hand, the concentration of salt is 0 at this limit. The code then
calculates a head of fresh water, which evolves linearly within the water column according to the ratio. In the
continental boundary, imposed flow conditions have been assigned to the model. This condition significantly
influences the shape of the seawater intrusion. To simulate this problem, the equations are discretized in space
and time, the MARTHE model is based on a finite volume scheme, with parallelepipedic meshes, which thus
comes down to a finite difference scheme [15]. The finite volume method is constructed from an integral
formulation based directly on the strong form of the equations to be solved.
Firstly, it is assumed that a first estimate of the concentration, and therefore of the density of the fluid is known
at each point and the resulting charges are calculated. From the head gradients, the flow velocities are
determined. From the flow velocities, the dispersion convection equation is solved for a better estimate of the
concentrations on each point of the domain and this process is repeated for all time steps.
 b. Presentation of the numerical model
The geometry that was developed during this study is a simplified conceptual object of the Mboro zone. Indeed,
this facilitates and makes more easier the understanding of intrusion phenomena. The geometry of the model has
a length of 124 m and a depth of 20 m (Figure 5). The model contains exactly 620 meshes and is discretised
sufficiently to be able to observe precisely the actual distribution of the concentrations.

 Figure 5: Construction of a control volume mesh from MARTHE

3. Results and Discussions
The parameters assigned to this model for the simulation are the hydrodynamic and hydrodispersive parameters.
The hydrodynamic parameters make a very important form of seawater intrusion and we can enumerate the
hydraulic conductivity, the Transmissivity and the storage of which their numerical values are presented in the
table n°3 The hydrodispersive parameters govern the phenomena relating to the mechanical dispersion of solutes
in a porous medium. We can mention the molecular diffusion whose numerical value remains for the whole
phase of the simulation at Dm=6,6.10-6 m2.s-1 and the dispersivity α (m) which strongly influences the
appearance of the plume of solutes.
 Table 3: Input data for the numerical model
 Parameters Values
 -1
 Storage, S (m ) 1.10-4
 2
 molecular diffusion, Dm (m /s) 6,6.10-6 m2/s
 2
 Transmissivity, T (m /s) 5.10-4
 Porosity, 0,49

 Journal of Scientific and Engineering Research

 150
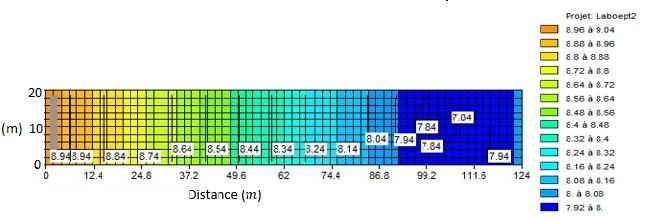
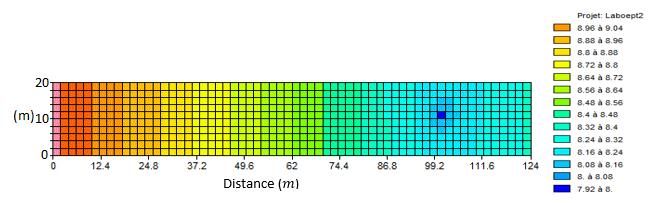
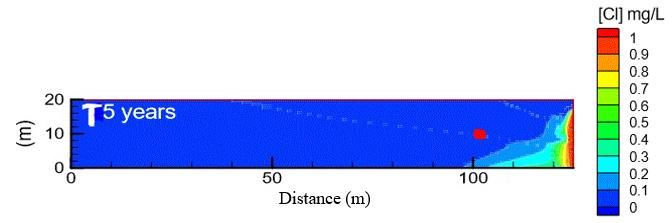
Diallo MS et al Journal of Scientific and Engineering Research, 2019, 6(2):144-153

 Longitudinal Dispersivity, (m) 10
 Transversal Dispersivity, (m) 3
 Rate pumping flow, q (m3/h) 50

 Figure 6: Head distribution with one pumping well
Hydraulic head distribution is shown in Figure 6 at five years of pumping. The location of the transition zone
allows us to visualize the hydrodynamic state of the system. Because of high transmissivity, the pumping
generates a large drawdown and there is a drop in the hydraulic head only around the well. The latter is more
visible in Figure 7 below representing the isovalues of the hydraulic head.

 Figure 7: Isovalues of hydraulic head
To estimate the salt concentration, we made simulation scenarios by placing the wells progressively at different
positions and varying the pumping rate for three long periods. The Table n o4 summarizes the scenarios and
salinity data for the area actually studied.
 Table 4: Parameters of simulations scenario
 Zone X (coord) Y (coord) Type Transmissivity Chloride Cl Scénario
 2 -1 -3
 (m .s ) (kg.m )
 Mboro -16,8916 16,07778 Drilling 5.10-4 37 T5 T10 T60

 Figure 8: Salt concentration transient at t=10 years

 Journal of Scientific and Engineering Research

 151
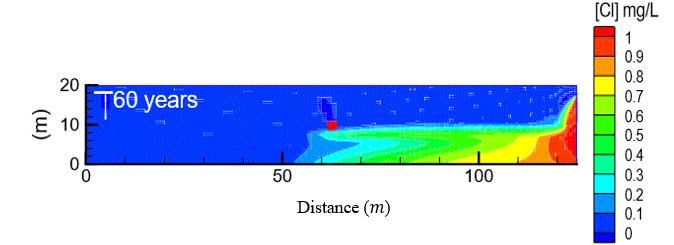
Diallo MS et al Journal of Scientific and Engineering Research, 2019, 6(2):144-153

Figure 8 shows a simulation of the transport equation in the presence of a pumping well placed at the coordinate
points (x = 100m, y = 10) with a flow rate equal to 50m3/h. The simulation time is more longer and we see that
here more than the well is close to the ocean more it becomes contaminate.

 Figure 9: Salt concentration transient at t=10 years
Figure 9 shows that even if a well is placed further from the sea inside the aquifer, it may be affected if the
pumping is excessive and for a long time. Indeed, we have placed a drilling or well at 62.5 m from the
continental boundary very far from the sea but the model shows that at ten years of use the well is partially
contaminated by salt by the effect of the diffusion and dispersion.

 Figure 10: Prevision of the salt concentration for transient state at t=60 years
In this figure above, the salinity peak being very close to the structure, this case illustrates a critical situation
because the drilling is at the limit of contamination. Indeed, a long continuous exploitation and an increase of
the rate flow pumping will lead to salinisation in the future.

4. Conclusion
The saline intrusion represents a major pollution risk for the quaternary sand aquifer of Senegal's northern coast,
which is a strategic reservoir for the country. This risk is actually accentuated because of the increase in the
frequency and intensity of drought periods, but also in response to the significant population increase in the
coastal zone. It will become even more important during the rise of the sea level related to climate change. The
good management of this aquifer, therefore, requires better knowledge and better detection of saline intrusions.
This work presented a new methodology (modelling) to control saline intrusion into the coastal aquifer of the
northern coastline towards Mboro. Two approaches were developed in this study; the first approach was to
develop a steady-state analytical model to determine the position of the interface between fresh and salt water in
the groundwater. The second was to develop a numerical model to predict the transport of solutes through the
porous medium of our study area.
The simulation series take into account the effects of pumping and the positions of the wells in the groundwater.
The results obtained by simulating with scenarios suggest that the numerical model thus constructed is

 Journal of Scientific and Engineering Research

 152
Diallo MS et al Journal of Scientific and Engineering Research, 2019, 6(2):144-153

acceptable. The model is able to predict, with good accuracy, the movement and extension of salt water in the
northern coastal aquifer.
Thus, this work has allowed us to better understand the dynamics of salt intrusion in the study area but also to
have a very important decision-making tool for the rational and sustainable management of groundwater in the
Niayes area.

References
 [1]. Mahécor Diouf, Pape Babacar Diop Thioune, Alassane Ba et El Hadji Bamba Diaw, (2017). Impact
 anthropique et climatique sur la dynamique de la nappe des sables quaternaires du littoral nord du
 Sénégal, Revue du CAMES –Sciences Appliquées et de l’Ingénieur vol.2 ISSN 2312-8712.
 [2]. DIAW E. B., Mamadou L. Lo, Mamadou Wade, Seydou Ndao, Ablaye Diallo, and Grégoire
 SISSOKO, (2016). Numerical modeling of solute transport: prediction of the risks of contamination of
 the Niayes aquifer (Senegal) by pesticides; International Journal of Innovation and Applied Studies,
 Vol. 17 No.4: 1358-1372.
 [3]. Herzberg A. (1901). Die Wasserversorgung einiger Nordseebader (The water supply of parts of the
 North Sea Coast in Germany) ; J. Gasbeleuch. Wasserversorg, 44, 815-819.
 [4]. Peter S. Huyakorn, Peter F. Anderson, James W. Mercer and Harold O. White, JR, (1987). Saltwater
 Intrusion in Aquifers : Development and Testing of Three-Dimensional Finite Element Model.
 [5]. MALOU Raymond, (2004). Impact of climate on groundwater resources in the Sudano-Sahelian zone.
 PhD thesis in Natural Sciences of Applied Geology. UCAD, 143p.
 [6]. P.S. Huyakorn, Y.S. Wu and N.S. Park (1996). Multiphase approach to the numerical solution of sharp
 interface saltwater intrusion problem; Water Resources Research Vol. 32, No.1, pp. 93-102.
 [7]. Bear J, (2010). Modeling Groundwater Flow and Contaminant Transport.
 [8]. Badou-Ghyben, W, (1888). Nota in Verband met de Voorgenomen putboring nabij Amsterdam (Notes
 on the potable results of well drilling near Amsterdam). In Tijdschrift Van het Kononklijk Institute Van
 Ingenieurs; The Hague: Amsterdam, Netherlands; Volume 9, pp. 8-22.
 [9]. Omar Kaloum, Ahmet Al Bitar, Jean-P.G. Etchegorry and Mustapha Jazar, (2016). Impact of
 Demographic on Seawater Intrusion: Case of the Tripoli Aquifer, Lebandon; Water, March 2016.
 [10]. Gionnoulopoulos, P., Mantoglou, A., & Papantoniou, M. (2004). Management of coastal aquifers based
 on nonlinear optimization and evolutionary algorithms. Journal of Hydrology, 297(1), 209-228.
 [11]. Dominique Thiéry, (2014). Didacticiel du code de calcul Marthe V7.4 ; Exploration des principales
 fonctionnalités de modélisation des hydrosystèmes. Rapport final BRGM/RP-62798-FR Avril 2014.
 [12]. Jazar, M.; Monneau, M., (2014). Derivation of seawater intrusion model by formal asymptotic. SIAM
 J. Appl. Math. 74, 1152-1173.
 [13]. Pool, M. & Carrera, J. (2011). A correction factor to account for mixing in Ghyben-Herzberg and
 critical pumping rate approximations of seawater intrusion in coastal aquifers. Water Ressources
 Research, 45(5).
 [14]. Albitar, A. (2007). Modélisation des écoulements en milieu poreux hétérogène 2D/3D, avec couplages
 surface/souterrain et densitaires, Thèse de Doctorat de de l’Institut National Polytechnique de
 Toulouse, 151p.
 [15]. Dominique Thiéry, (2014). Modélisation 3D des écoulements à densité variable avec le logiciel
 MARTHE version 6.9. Rapport final BRGM/RP-55871-FR, Octobre 2007, révisé Mai 2014.

 Journal of Scientific and Engineering Research

 153
You can also read


