WAVE MEASUREMENT TECHNIQUES FOR THE NEW LARGE-SCALE DELTA FLUME
←
→
Page content transcription
If your browser does not render page correctly, please read the page content below
WAVE MEASUREMENT TECHNIQUES
                  FOR THE NEW LARGE-SCALE DELTA FLUME

           BAS HOFLAND           (1),   ROB HOFFMANN (2) & RODERIK LINDENBERGH (3)
                                        Coastal engineer / researcher, Deltares,
                                        (1)

                                  Delft, The Netherlands. bas.hofland@deltares.nl
                                         Instrumentation specialist, Deltares,
                                         (2)

                                 Delft, The Netherlands. rob.hoffmann@deltares.nl
                           (3)   Assistant Professor, Delft University of Technology,
                                 Delft, The Netherlands. r.c.lindenbergh@tudelft.nl

Abstract

A new Delta Flume is being built in Delft to facilitate measurements at an even larger scale
than is presently possible. A description of the flume is given, and its capabilities are compared
to the old flume and other existing large flumes. For determining which wave measurement
techniques should be implemented at the new facility, an overview is made of current wave
measurement techniques. Several techniques are evaluated in detail. A distinction is made
between point measurements, line measurements and field measurements. The most promising
techniques for the flume are presented. Possible improvements and implementations of these
techniques are discussed.

1.   Introduction
A new Delta Flume is being built in Delft to facilitate measurements at an even larger scale
than is presently possible. It will be used to test coastal structures, sea defences, coastal
morphology, eco-dynamic designs, and much more. In the facility it will be possible to
generate extreme wave heights well over 4 m with a significant wave height of over 2 m.
Measuring waves in such a large facility poses some particular challenges. To this end a range
of existing methods have been evaluated for use in the new Delta Flume.

       Figure 1. Artist’s impression of the new Delta Flume.

After a description of the new flume, this paper describes the on going selection and
development of the wave measurement techniques for this facility. Some methods that seemed
promising were tested in trial tests and further development of the promising techniques was
initiated.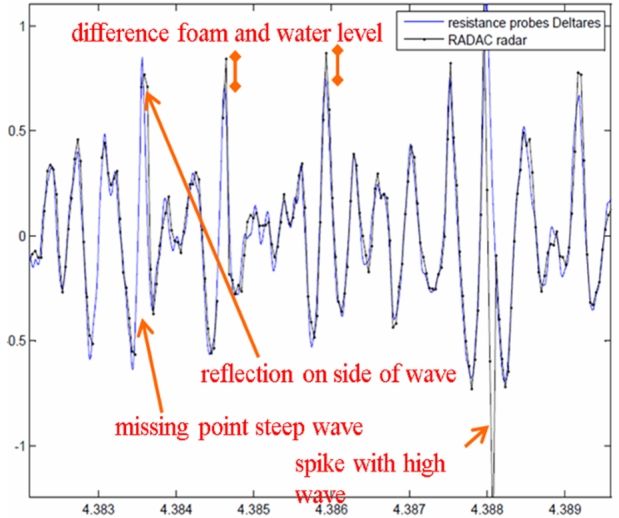
2.   The new Delta Flume
For correctly modelling a wide range of phenomena a (near) full scale has to be applied.
Certain aspects like turbulence, morphology, surface tension, porous flow, material strength,
and elasticity are difficult to model at small scale. A list of research subjects that can be studied
in a large scale facility is:
     Wave impacts on piers, jetties, caissons, and offshore structures are influenced by aspects
     like air compressibility, and elasticity of the structure.
     Flexibility and strength of biotic elements in coastal defences like grass, reed, trees, and
     shells can influence wave transmission and overtopping.
     Flow through granular filter layers under structures can be turbulent in reality, while it
     will turn (more) laminar at smaller scale.
     Morphological processes of sand and clay are notoriously difficult to scale.
     The absolute strength of materials like concrete, asphalt, or clay remains the same when
     applied at a smaller scale, while loads decrease.
     Liquefaction of the sand bed under structures can lead to failure of the structures.

Hence, a full scale model is the best tool to verify the strength of –for instance– dikes, dunes,
and certain aspects of breakwaters. As hundreds of millions of euros are spent annually in The
Netherlands to maintain its water defences, increased knowledge on these structures can lead
to very large savings. Several practical aspects of the present Delta Flume like its age, remote
location, and limited observation techniques, prompted the need for a new facility. The new
flume will also have an increased size to enable experiments at an even larger scale. The exact
characteristics of the new flume are summarized in Table 1. With the increased depth of the
new flume of 9.5 m (over the first 183 m), depth-limited breaking of the waves will decrease,
such that higher waves with a more realistic height distribution can be generated. The larger
wave height will enable tests on an increased number of dikes at completely full scale.

               Table 1. Characteristics of new flume compared to old flume.
                           Characteristic                    OLD              NEW
                           Total depth (m)                    7            9.5 and 7
                             Length (m)                      220         183 + 75 = 258
                             Width (m)                        5                5
                  Max. sign. Wave Height Hs (m)              1.5              2.2
                  Max. max. Wave Height Hmax (m)             3.1              4.1
                           Full stroke (m)                   4.5               7
                            Power (MW)                        1                2
                      Filling discharge (m3/s)               0.1               1

The waves will be created by a very large wave maker. A perspective image of its design is
given in Figure 2. Its characteristics are summarized below.
    Dry-back, piston type, hydraulic system
    Total stroke of wave maker: 7 m
    Mean power of wave maker: 2 MW
    Active Reflection Compensation
Based on tests at small scale the wave heights that can be attained have been determined. To
our knowledge with this flume it will be possible to generate the largest irregular waves in the
world. For reference: the Großer Wellen Kanal in Germany can make irregular waves up to
about Hs = 1.3 m.
    Additionally, it is planned to generate a tidal motion in the flume during wave generation.
This encompasses the realization of a complicated steering system of the filling pumps, the
hydrostatic compensation of the wave board, and the alteration of the active reflection and
wave-steering software.

       Figure 2. Impression of wave maker of new Delta Flume (drawing: MTS).

3.   Wave measurement techniques
Measurements at various spatial resolutions are needed. Presently mainly point measurements
are used, which give reliable basic information of the tests. However, more and more synoptic
measurement techniques are being developed, with which a (varying) spatial field of a certain
quantity can be measured at high spatial resolution. An example is the synoptic pressure
measurement technique that is applied in the HYDRALAB research programme HyReS. These
kinds of measurements can create output that is similar to that of numerical models. This can
aid in the understanding of physical processes, and creates possibilities for composite
modelling. For the new Delta Flume also wave height measurements over a line and over an
area are considered. In Table 2 the main wave measurement techniques that are applied in the
laboratory and field are listed.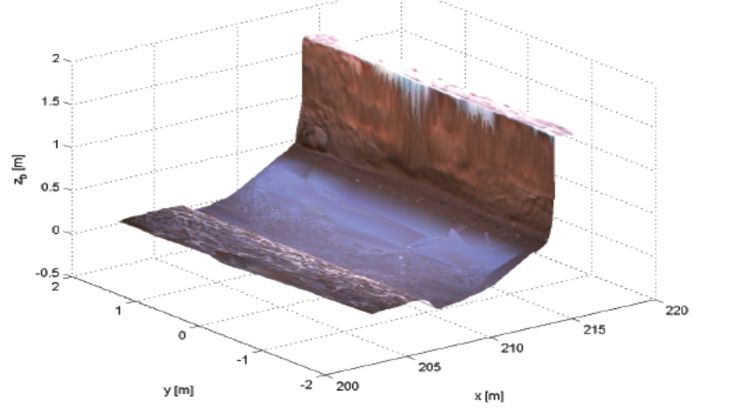
Table 2. Overview of wave measurement techniques considered.
                            Class                      Type
                         Mechanical                 Mechanical
                          Electrical                Resistance
                                                    Capacitive
                                                    Step gauge
                          Reflective        Radar from above water line
                                                     Acoustic
                                                   Laser scanner
                                          Echo sounding from under water
                          Pressure                   Pressure
                          Imaging               Stereo photography
                                                  (Wall) contour
                                                       PIV

3.1 Point measurements
For reliable point measurements at fixed locations good experience was obtained in the past
with in-house manufactured resistance type gauges in the present Delta Flume. It is a relatively
simple, robust, and accurate technique. Still, a couple of aspects needed to be improved further.
The gauges had to be made suitable (mechanically and electronically) to measure in the larger
flume, with a more simple and flexible mounting. To this end the mechanical and electronic
characteristics of the gauges were determined. Furthermore, stratification of the water
influences the measurements, and the range of salinity of the water under which the gauges
function had to be increased. Moreover, the gain factor varied for different water levels. If this
effect could be removed, it could save much time in using the new facility.
     As the resistive wire technique is not very flexible (i.e. easy to place quickly at any
location), other techniques were also investigated. Techniques that were tried for more flexible
point measurements (for the new flume, and in the past) are reflective measurements (e.g.
radar, acoustic), mechanical profile followers, pressure sensors (in combination with velocity
sensors), and capacitance type probes. Reflective measurements (radar, acoustic, etc.) that work
from under water were discarded a priori because they are impractical to install.
     Reflective measurements generally do not work with steep and/or breaking waves. A fair
estimate of integrated parameters like the significant wave height and mean period can
however be obtained. Of these methods a radar method was selected as being most promising,
which will be described below.
     Wave measurements based on pressures are prone to errors as linear theory is used to
translate the measured pressures to the water levels, which leads to errors in the order of 5%.
The mechanical gauges that are presently used are not fast enough for the larger scale.
     Both the resistance type wire gauges and radar were selected to be applied for the point
measurements. The resistance type technique will remain to be the standard technique, as it
gives continuous signals without spikes. The radar technique is supplementary as it is more
flexible to mount, and its calibration is constant. A full overview of the aspects that were
considered is given below. Next these two techniques are discussed in more detail.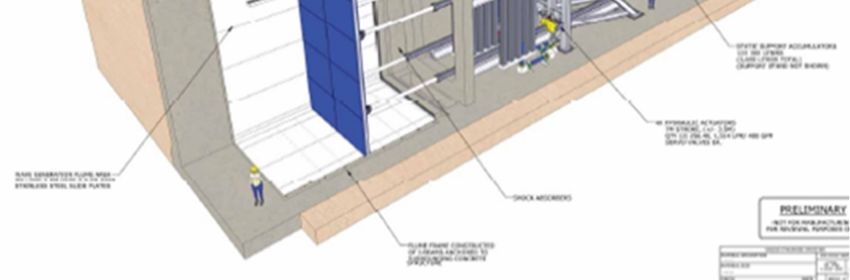
Radar Resistive wire
• Accurate + +
• Sampling frequency +/- +
• Spatial resolution +/- +
• Robustness of measurement + +
• Robustness of signal, so
• No spikes - +
• No drift + +/-
• Turbid and clear water + +
• Breaking and non-breaking waves - +
• Stratified water + -
• Ease of use (fool-proof) + +
• Processing speed + +
• Non-intrusive + +/-
• Costs + +
• Safety + +
Radar
A radar measurement measures the reflection of radar pulses from the water surface. For the
purpose of water surface elevation measurements frequencies up to 10 Hz and approximately
30 cm footprint sizes are used (Rees & Pellika 2010). Radar measurements are considered to be
nonintrusive. Unlike other reflective methods they are not affected by aspects like wind,
clouds, rain, fog etc. The radar has a constant calibration factor.
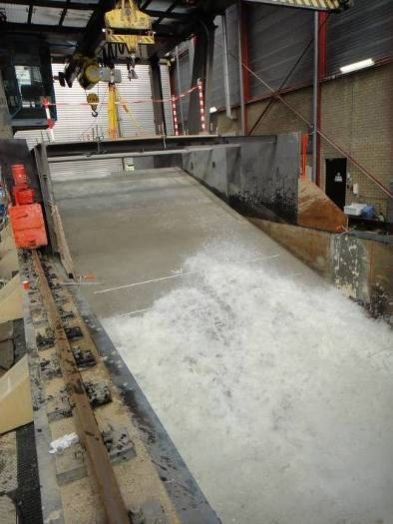
Figure 3. Measurement with radar compared to standard resistance probes.
In Figure 3 an example of a measurement with a RADAC radar in a wave field with large
steepness (Hm0 = 1.3 m, Tp = 5 s) as measured during a trial in the old Delta Flume is shown,
compared to a measurement with a resistive type wire gauge at the same location. It can be
seen that at steep waves sometimes spikes are present or data is missing. Small differences
between the measurements can also be due to small differences in wave height over the crest of
the wave (the radar measured in the centre of the flume and the wire gauge at the wall). At the
highest wave crests the wire gauge tends to measure the solid or “green” water, while the
radar tends to measure the uppermost (foam) surface. Still, when the spikes are filtered out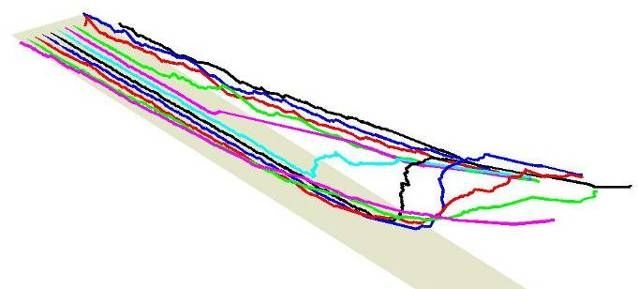
parameters like Hm0 and Tp are measured with a few percent accuracy. The radars for the new
flume will be equipped with an increased 10 Hz sampling rate.

Resistive wires
Resistive wire gauges measure the conductivity between two conductive
wires that are placed parallel to each other and are placed vertically through
the water surface. If the electrodes (wires) are conductive (orders more than
the water), the conductivity as measured trough the system is proportional
to the immersed depth. As the conductivity of the water can change much
with temperature or salinity, the conductivity should always be measured
with a reference electrode. Not all resistive type gauges used around the
world have this system. This means that calibration should be done several
times per day, which is very cumbersome.
     The robustness of the point measurements should be increased as much
as possible to enable efficient tests, without much delay due to calibration,
error checking, and signal processing.
     Vibration and deflection of the wires can influence the measurement.
Therefore the mechanical behaviour of the wires was schematized in order         Figure 4.
to select the material, diameter, and mounting distance of the wires.            Mechanical
     The deflection under a certain wave load, w (m), and the lowest             schematization
vibration frequency after an initial deflection, f (Hz), can be given by the     of wire gauge.
following standard equations:
                                          ql 2        F0
                                     w         , f            ,                             [1]
                                          8F0        4l2
where q is the wave load on the wire (N/m), l the length of the wire (m), F0 the tension of the
wire (N), and µ the mass density of the wire per unit length (kg/m) – see Figure 4.
     Next we assume that the wire is put under a tension equal to the yield strength of the
material s (N/m2), and the force on the wire q is caused by standard drag force of the orbital
wave velocity u (m/s), as q u 2 . Also the added mass of the water is introduced. This then
yields:
                            u2 l 2                                s
                       w                 , and   f        2
                                                                          ,                 [2]
                            d s                      4l       w       2

where (kg/m3) is the density of water, d (m), the diameter of the wire, and w (kg/m3) the
density of the wire.
     It can be seen from eq. [2] that the deflection of the wire will decrease with increasing
diameter and increasing yield strength of the material, and the frequency will increase with the
increasing strength of the wire material, decreasing mass density of the wire material, and
(surprisingly) it is independent of wire diameter.

    The present wire gauges are made from stainless steel. They are mounted with supports
every 2 m. A trial test was made without intermediate supports, as this will make the gauges
much more flexible in use. The vibration frequency of about 13 Hz that was predicted by eq. [2]
was indeed observed. The deflection was still a few cm, and influenced the wave measurement.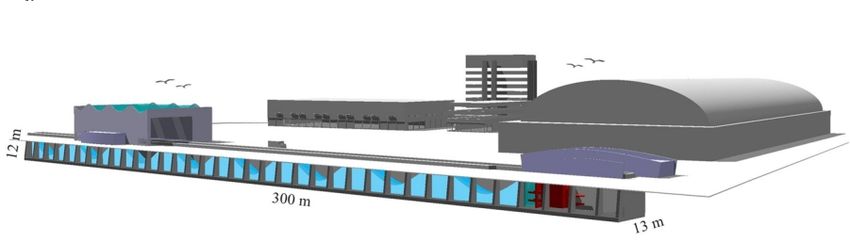
Therefore this frequency should be increased and the deflection should be decreased. A
material was sought for this.
     A logical choice for the material for the wires (light, strong, non-corrosive) would seem
titanium. The vibration frequency of a wire without support in the new flume will be about 21
Hz, which is far from the typical wave frequencies applied. However, the downside for this
material is its electrical properties. It has a larger electrical resistance than stainless steel. If the
resistance of the wires becomes significant, compared to that of the water, the gain of the
system becomes less linear. A wire gauge with perfectly conducting electrodes has a resistance
of R = 1/h w, where h (m) is the immersed depth of the electrodes to be measured, and w
(S/m) the conductivity of the water between the wires. It is also possible to work out the total
resistance of the wire gauge with the resistance of the electrodes included, Rtot:
                                                     2
                                   2   d        eh       d w

                            Rtot                 2
                                                                   2( L h )   d   ,                  [3]
                                       w   eh        d w
                                                               1
where d ( /m) is the resistance of the wire, and L (m) the total length of the wire.
     It can be seen that the system’s conductivity no longer is proportional to the immersed
length of the wires. It turns out that already for the stainless steel wire that is presently used,
there will be such an influence of the wire resistance that the gain will have a nonlinearity of
about 5% if a calibration is to be made over most of the full range of 8 m. This apparently is the
reason that presently the (stainless steel) wire gauges have to be re-calibrated every time a new
water depth is applied. For titanium wire of 2 mm the influence of the resistance on the
nonlinearity will be much larger. This non-linear gain factor will have to be taken into account
in the electronics of the gauges.
     As the gauges remain sensitive to stratification in the water, in the final set up the
conductivity of the water will be monitored over the depth, at one location in the flume, such
that possible stratification of the water can be checked.
     With the knowledge that was obtained on the apparently simple wire-gauge system, a
more efficient (less calibrations), flexible (less mountings), accurate (better calibration curve)
and robust (stronger materials) measurement system can be placed in the new Delta Flume.

3.2 Line measurements
Two techniques considered to measure the water line along a part of the flume in real-time are:
applying a terrestrial laser scanner (TLS), and contour detection at the wall by a CCD camera.
TLS have been used in the field and in the laboratory a number of times with promising results
(e.g. Blenkinsopp et al, 2010; Allis et al 2011).
     The contour detection technique has been applied at the present Delta Flume. Here the
water line at the wall is obtained by imaging techniques (the pixel intensity changes from wall
to water). This technique can be hampered by the light conditions, and post-processing can be
cumbersome. Therefore most attention is being given to the TLS technique.

Terrestrial laser scanner
In the envisaged set-up a laser beam is scanning the water surface over a line parallel to the
flume axis, see Figure 5. The laser beam is moved by a rotating mirror. Hereby a wave
measurement over a line along the flume axis is obtained with high spatial and temporal
resolution. As the water itself cannot be measured, the water (surface) needs to be turbid to
create diffuse reflection. The typical frequency of many laser scanners is in the order of 50 Hz.
The accuracy of the scanners is less than the point measurements applied, but the large spatial
resolution can make this acceptable.
TLS
slant angle
(maximum) grazing angle
Figure 5. TLS set-up
An inventory has been made of the factors that could possible influence the results using a
laser scanner for wave measurements. By applying different scanners it will be seen which
parameters influence the method, and possibly a good scanner can still be found.
The most important parameters with respect to the TLS device itself are: the basic scan
principle (Time of Flight or Phase-shift), the opto-mechanical device (mirror, scanning rate), the
laser type (wavelength, power, pulsed or continuous), the beam (diameter and divergence
angle), sampling rate, range resolution, radiometric resolution (detection of small intensity
differences), peak detection algorithm, and further internal signal processing (thresholds,
filtering, corrections, interpolation).
The atmospheric conditions will also influence the measurement: lighting (artificial, sun),
fog, cloud, rain. Moreover, the geometry of the set-up can be chosen: distance, grazing angle,
slant angle (see Figure 5). The object to be measured –the water surface– is also of influence:
higher roughness (capillary waves and ripples, foam, tracers, turbulence) and turbidity
(natural or by additives) will improve the measurement quality. The wave geometry itself will
determine how large the effective size of the measurement area can be before parts of the wave
cannot be seen anymore (shadowing effects).
Several types of laser scanner have been tested in the present Delta Flume and smaller
flumes. These tests gave promising –yet presently still inconclusive– results, see Figure 6. The
conditions necessary to obtain stable results from the TLS are still being determined.
Blenkinsopp et al (2010) report good results using a terrestrial laser scanner for the
measurements of water waves over a line in the swash zone. Allis et al (2011) use the same
laser scanner (SICK LMS200) to measure waves in a laboratory flume. The results of Allis could
be reproduced in a small scale flume at the TU Delft, where the wave signal was visible when
Kaolinite was added to the water such that the turbidity was about 30 to 50 NTU
(Nephelometric Turbidity Units). However, when increasing the distance to the water line the
results quickly deteriorated. Therefore unfortunately such setup with this scanner type is
probably not suited for measuring a reasonable spatial domain (one or several wave lengths) in
the Delta Flume, as larger dimensions are applied there.Figure 6. TLS measurement of breaking-wave profiles on a slope. Left: setup. Right: example of
result (every line represents a different time step).
In Figure 6 an example of a scan can be seen as taken with a Faro Photon laser scanner in the
existing Delta Flume. This measurement was obtained in the wave run-up zone. Due to wave
breaking the water here contains much foam, increasing its reflectivity. This enabled a good
measurement. For the measurement of wave run-up the TLS therefore seems a good option.
We are still in the process of determining the most important factors that determine a good
measurement.
Figure 7. Wave surface near dune face measured by stereo photography (Van Thiel de Vries, 2009).
3.3 Field measurements
For some applications the wave field is required in a limited area (e.g. near a structure). Two
techniques to measure an entire area of the water surface instantaneously were identified:
using a range camera, and stereo photography (De Vries et al 2011, Palmsten et al 2012). A
range camera that was used in a trial test could not detect the water surface, even when it wasrather turbid. Stereo photography did yield satisfactory results in the past. In Figure 7 an
example of measurement of a wave approaching a dune face is shown. However, processing
the data takes much time. At the moment it does not seem feasible to process measurements for
a normal test of an hour duration. For waves further offshore the applicability of the technique
might be less suited due to the larger transparency of the water. Also the very detailed data in
two dimensions is usually not needed for the essentially 1D wave field.
4. Concluding
A new Delta Flume is planned to be built in Delft to facilitate measurements at an even larger
scale than is presently possible. A description of the flume is given. Furthermore, the possible
wave measurement techniques for this flume were discussed. A range of existing wave
measurement techniques have been evaluated. The most promising techniques for the flume
were presented. For point measurements the existing resistive type wave gauges have been
selected as best suited. As a flexible technique the use of radar was also selected. Possible
improvements and implementations of these techniques are discussed. For line measurements
a TLS might be suitable. However, for the offshore waves the reflection of the water surface
seems to be not good enough. Breaking waves and wave run-up can be visualized at a large
scale using this technique. For measurement of a wave field in the surf zone the existing stereo
photography technique is suited. However, at the moment this technique requires quite some
effort in post-processing.
Acknowledgments
The new Delta Flume and its instrumentation are funded by the Dutch Government via the
Fonds Economische Structuurversterking. Many thanks to Maximilian Streicher for his
enthusiastic help with the quest for suitable laser scanners.
References
Allis MJ, Peirson WL, Banner ML. Application of LiDAR as a Measurement Tool for Waves.
Proceedings of the Twenty-first (2011) International Offshore and Polar Engineering
Conference. Maui, Hawaii, USA, June 19-24, 2011
Blenkinsopp C.E., M.A. Mole, I.L. Turner, W.L. Peirson. 2010. Measurements of the time-
varying free-surface profile across the swash zone obtained using an industrial LIDAR.
Coastal Engineering 57, 1059–1065.
De Vries, S., D.F. Hill, M.A. de Schipper, M.J.F. Stive. 2011. Remote sensing of surf zone waves
using stereo imaging. Coastal Engineering 58 (2011) 239–250
Palmsten, M.L., R.A. Holman. 2012. Laboratory investigation of dune erosion using stereo
video. Coastal Engineering. Volume 60, February 2012, Pages 123–135
Rees, W.G., P.Pellika (2010): Principles of Remote Sensing. Remote Sensing of Glaciers. London.
Van Thiel de Vries, J. 2009. Dune erosion during storm surges. PhD thesis – TU Delft.
Wenneker, I. 2012 Stroke, velocity and acceleration requirements for piston-type flume wave
generators. Coastlab 2012. Ghent, Belgium.You can also read