Bulk water supply - Impacts of a Wellington Fault Earthquake
←
→
Page content transcription
If your browser does not render page correctly, please read the page content below
Bulk water supply – Impacts of a Wellington Fault
Earthquake

      Jim Cousins, Nick Perrin, Graeme Hancox, Biljana Lukovic,
      Andrew King & Warwick Smith
      GNS Science, Avalon, Lower Hutt, New Zealand.

      Alastair McCarthy & Tony Shaw                                                     2010 NZSEE
                                                                                        Conference
      Greater Wellington Regional Council, Wellington, New Zealand.

      ABSTRACT: Urban Wellington Region is uniquely vulnerable to large earthquakes. Not
      only is it bisected by large active faults but it is extremely isolated, with all supplies being
      transported along a small number of lifelines. All are vulnerable to earthquake damage.
      The potential for total loss of water and food supplies is real and could render large areas
      uninhabitable for weeks to months.

      Greater Wellington Regional Council is evaluating new sources of potable water for the
      four cities of the Wellington Region. One important consideration is security of supply
      following major earthquakes near Wellington, in particular an earthquake involving
      rupture of the Wellington Fault because current bulk-supply pipelines cross the fault at
      several places.

      We describe the pipeline damage expected from a Wellington Fault Earthquake and
      estimate the times needed for restoration of the bulk supply to main delivery points
      throughout the region. Priority is given to Wellington City because of its high population
      and lack of access to alternative supplies. One key finding is that the shortest time needed
      to get a limited supply back into Wellington is five to eight weeks. A second is that
      constructing a new supply dam west of the Wellington Fault could lower the restoration
      time by about one third, to three to five weeks. Even the lowered times are too long and it
      is clear that alternative solutions must be found.

1 INTRODUCTION

Greater Wellington Regional Council (GW) manages the bulk supply of potable water for the cities of
Upper Hutt, Hutt, Porirua and Wellington. One important consideration is security of supply following
major earthquakes near Wellington, in particular an earthquake involving rupture of the Wellington
Fault because current bulk-supply pipelines cross the fault at several places (Figure 1). The potential
economic and social consequences of protracted loss of water supply to urban Wellington Region are
extremely severe, therefore GW wished to have estimates of the time needed to restore bulk water
supply to the two main termination points in Wellington City, at Karori and Thorndon.
Our approach was to overlay the bulk supply network with maps of geological hazards including
landsliding, liquefaction, soft-soil amplification and faulting, prepared specifically for this study. This
allowed fault crossings, potential landslides and areas of liquefaction ground damage to be accurately
mapped in relation to the pipelines. We then applied the shaking field expected from a Wellington
Fault earthquake and, using fragility functions that took into account the properties of the pipes and
the effects of the geological hazards, estimated the numbers and locations of breaks and leaks. This
was done semi-probabilistically.
Failure rates were estimated for four sources, the existing Kaitoke, Wainuiomata, and Hutt Artesian
systems, and a proposed new Whakatikei system. A critical comparison was the time to restore bulk
supply to Wellington from the proposed Whakatikei source compared with the existing Kaitoke
source. Because the Whakatikei source was on the western side of the fault there was only one fault

                                            Paper Number 54
crossing between it and eastern Wellington, compared with three for the Kaitoke system and two for
the Wainuiomata and Hutt Artesian systems.
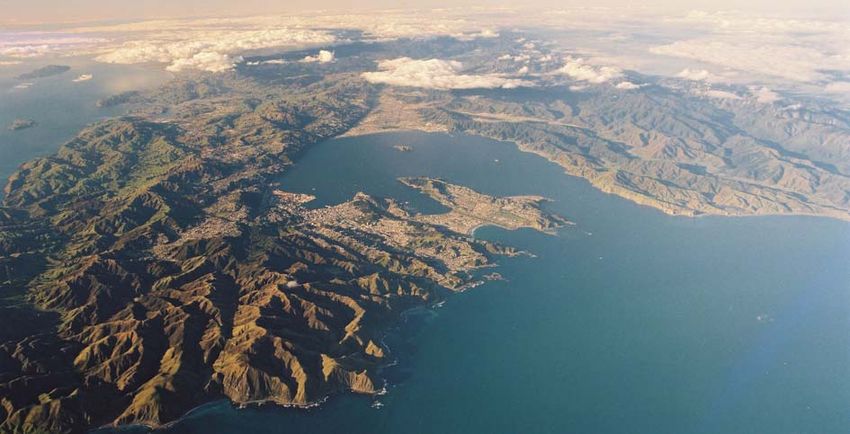
The isolation of central and eastern Wellington (areas to the right of the Wellington Fault in Figure 1)
is stark. There are no significant sources of vital supplies within the zone, including water, food,
power or fuel. All have to be imported through the steep hill country that surrounds the City.
Kaitoke
Whakatikei
Te Marua
Silverstream
Hutt Artesian
Porirua
Wainuiomata
Petone
Thorndon
Karori
Wellington
Figure 1. Wellington area bulk water supply system showing water sources (yellow stars) (Wainuiomata,
Kaitoke, Hutt Artesian, proposed Whakatikei), bulk mains (dotted black lines), places where the bulk mains
cross the Wellington Fault (purple circles) (Te Marua, Silverstream, Petone, Thorndon, Karori), main supply
points for eastern Wellington City (blue triangles) (Thorndon, Karori), and the Wellington Fault (red line). Two
of the main cities of the region are labelled, Hutt City, occupies the valley containing the Hutt Artesian water
source, and Upper Hutt lies between Silverstream and Te Marua..
2 SEISMIC HAZARD
Only a worst-case scenario was considered, i.e. a magnitude 7.6 earthquake generated by rupture of
the Wellington Fault. Shaking from the earthquake was estimated using the MMI (Modified Mercalli
Intensity) attenuation model of Dowrick and Rhoades (2005). An intensity of MM10 was estimated
over most of Wellington and Hutt Cities, and MM9 over much of the remaining urban area.
3 GEOLOGICAL HAZARDS
Ground type varies along the pipeline routes, and includes weak rock (with landslide hazard in some
places), compact river gravels, and soft soils (with liquefaction hazard in some places). The entire
pipeline route, including to the proposed Whakatikei source, was flown by helicopter and extensively
photographed. The aerial photos and video, Google Earth images, Google Street View (in many
cases), and in-house databases, were used to assess geological hazards along the pipeline routes. This
was done to establish locations with a potential for fault rupture, liquefaction-induced lateral spreading
and subsidence, or landsliding, which could damage or rupture the pipelines. Then followed a process
of establishing a “risk rating” for the potential effects of the identified geological hazards, as follows:
• Low – No perceived geological hazards.
• Moderate – Minor hazard from landslides on to buried pipeline; small (• High – Significant hazard from major (>10 m) long slope failure collapse; or major
liquefaction lateral spreading and subsidence. Specific note was taken of places where
landslide under-failure was expected.
• Extreme – Almost certain likelihood of rupture (e.g. all the Wellington Fault crossings and a
few landslide and lateral spread areas).
Finally, the resulting hazard ratings were mapped and overlain on the pipelines so that each pipe
segment could be allocated a risk rating.
4 PIPE DAMAGE MODEL
4.1 Data
Reports of damage to water-supply pipelines in eleven major earthquakes were scanned for useful
information, as were three major reviews of the topic (ALA 2001, 2005, Rojahn and Sharpe 1985). A
great deal of anecdotal / descriptive information was found, but despite the quantity of words and data
the topic was fraught with incomplete and often inconsistent data, apparent high variability, and
models with inadequate support. Reports were found for complete water supply systems that had
experienced shaking levels comparable to those expected from a Wellington Fault earthquake in five
historical earthquakes, viz. Hawke’s Bay (New Zealand) 1931, Kobe (Japan) 1995, ChiChi (Taiwan)
1999, Kocaelli (Turkey) 1999, and Bhuj (India) 2001. In all cases, there was severe damage to water
distribution systems, but bulk-supply pipelines and related structures (dams, weirs, artesian wells,
pump stations and treatment plants) appeared to have performed much better.
Figure 2 summarises the available data and expert assessments. The general trends within the cloud of
points are (a) damage increases with shaking intensity, (b) increases greatly when ground damage
(liquefaction or landsliding) is present, (c) decreases with increasing pipe diameter, and (d) depends on
pipe material, jointing method and diameter. Large diameter (≥ 400mm) steel pipelines with welded
joints appeared to be the most robust, and small diameter cast-iron pipelines with old couplings (more
than c. 50 years) the most fragile.
100
ATC-13, Soft Soil
ATC-13, Rock
10
ALA ground shaking
Repairs per Kilometre
1 ALA ground deformation
0.1
0.01
0.001
0.0001
6.0 7.0 8.0 9.0 10.0 11.0
Ground Shaking Intensity (MMI)
Figure 2. Historical data (ALA 2001, 2005) and expert panel assessments (Rojahn and Sharpe 1985 – ATC-13)
on damage to buried water-supply pipelines affected by earthquake shaking. The two ATC-13 points plotted at
0.0001 represent zero expected repairs per km.
34.2 Model
The method adopted was to estimate the repair rate for a base case of large-diameter, modern, welded-
steel pipeline, buried in ground that had negligible potential for liquefaction or landslide failure, and
then to allow for other situations with a series of multiplying factors. With this in mind, the expression
for estimating the repair rate, RR, for any situation become
RR = F1 * F2 * F3 * F4 * F5 * RRGS (1)
where RRGS was the base repair rate (for ground shaking alone), and F1 to F5 were factors to allow
for pipe material, coupling age, pipe size, landslide hazard, and liquefaction hazard. They were
assumed to be 1.0 unless specified otherwise in Table 1.
Table 1: Relative fragility factors. The factor value is 1 for all conditions not specified here.
Factor Name Condition Value
F1 Pipe Material Factor Cast-Iron 2
F2 Coupling Age Factor Couplings more than 50 years old 2
F3 Size Factor Diameter < 400 mm 4
Moderate Hazard 3
Landslide Hazard
F4 High Hazard 9
Factor
Extreme Hazard 27
Moderate Hazard 3
Liquefaction Hazard
F5 High Hazard 9
Factor
Extreme Hazard 27
The formula for the base-case repair rate was
RRGS = A * 10^(B/(MMI-C)) (2)
where MMI was the shaking intensity and A, B and C were fitted constants. It was a completely
empirical model, chosen so as to give a plausible match to the available data, as illustrated in Figure 3
for base-case and worst-case (cast-iron pipes, old couplings, in ground of extreme risk rating)
situations.
4.3 Immediate Repair
Pipe failure can range from minor leakage at a distorted coupling to complete annular rupture, and
depends strongly on the pipe material and the jointing method (Shi 2006). Of considerable importance
are assertions by Shi, based on observations, that (a) the only failure mechanism for welded steel
pipeline is compressive buckling in the bell section of the bell and spigot joint, and (b) only 20% of
such failures proceed to tearing or splitting of the wall, and hence leakage. We have assumed that in
the immediate aftermath of a major earthquake only actual leaks will need to be repaired for
restoration of survival-level supply, and hence have reduced the repair rate for welded steel pipelines
to one-fifth of the nominal rate.
4.4 Fault Breaks
Places where the pipelines cross the Wellington Fault are well known. Complete failure of the pipeline
is expected at each crossing point.
4100
ATC-13, Soft Soil
ATC-13, Rock
10
ALA ground shaking
Repairs per Kilometre
1 ALA ground deformation
Cast Iron, Small Diameter, Old
Couplings, Extreme Hazard
0.1
Cast Iron, Large Diameter, Old
Couplings, Extreme Hazard
Welded Steel, Small Diameter,
0.01 Old Couplings
Welded Steel, Small Diameter,
Welded Joints
0.001 Welded Steel, Large Diameter,
Old Couplings
Welded Steel, Large Diameter,
Welded Joints [BASE CASE]
0.0001
6.0 7.0 8.0 9.0 10.0 11.0
Ground Shaking Intensity (MMI)
Figure 3. Examples of the pipe failure model compared with data and expert assessments. “Large Diameter”
means 400mm or more.
4.5 Computation Detail
Brief details of the computation sequence are as follows:
• Estimate the average MMI at the centroid of each pipe segment. Allow for uncertainty in the
MMI model (using random selection from distributions about mean parameters), and allow for
soft soil amplification / rock de-amplification. (Pipe segmentation was based on changes in
either pipe attributes or geological conditions, with a maximum segment length of 100 m
being imposed.)
• Estimate the repair rate, in repairs per km, using Equations 1 and 2. Multiply the repair rate by
the segment length to give the repair rate specific to the segment.
• Treat the segment repair rate as a probability of failure for the segment, generate a random
number in range 0 to 1, and when the random number is less than the probability of failure
assume that the segment has failed.
• Allow for fault damage. The failure probability is assumed to be 1 wherever the Wellington
Fault crosses a pipeline, and the failure type is complete rupture. Ensure that there is no
double counting of failure, i.e. a pipe segment ruptured by the fault is not also damaged by
ground shaking and associated effects (landsliding etc.).
• Accumulate the numbers of failures.
• Repeat the above procedure 10,000 times so that natural variability can be described.
• Carry out sensitivity studies for critical parameters.
55 REPAIR TIME MODEL
Repair times were based on expert opinion of experienced GW staff. Tasks covered included:
• Assembly of repair crews, initial inspection and planning, assembly of plant and materials;
• Repair of ruptures at fault crossings (preparatory work has already been done at the Kaitoke
and Karori sites so that restoration of emergency flow is expected to take c. 5 days for each,
repairs at the other locations are expected to take 8 to 18 days); and,
• Pressurise pipe, locate leaks, de-pressurise, repair leaks, re-pressurise, repeat as necessary.
Given sufficient manpower, repairs at fault crossings were to some degree carried out in parallel with
repairs to pipelines. Repair of the pipelines, however, had to be sequential from water treatment plants
to reservoirs.
Given that Hutt, Upper Hutt, and to some degree Porirua, had alternative supplies of water (from
rivers and streams), priority was given to the Kaitoke to Karori system. Restoration of the Hutt
Artesian to Thorndon system had second priority, and Wainuiomata to intersection with the Hutt–
Thorndon line third priority.
In a second scenario the Kaitoke source was replaced with the proposed Whakatikei source as the
priority one restoration task. In both scenarios, restoration of supply to Porirua was undertaken once
water was available at the point where the Porirua main branched from the Kaitoke-Karori main.
6 RESULTS
Table 2 compares the estimated numbers of failures for each of the four main source-to-termination
routes for the Wellington Area bulk supply network. The failures are those that have to be repaired
(i.e. are leaks), and the heading “Shaking” includes failures due directly to ground shaking and those
from shaking-induced ground damage. The raw numbers suggest that the main advantage of the
proposed Whakatikei source is in reducing the numbers of fault ruptures.
Repair times derived from the numbers of repairs, Table 3, indicate that replacing the Kaitoke source
with a source at Whakatikei results in a 15 to 20-day reduction in the time needed to restore water to
Karori, and small reductions for the Thorndon supply point. The Karori reduction occurs primarily
because there are two fewer fault ruptures to be mended, and the Thorndon reductions because staff
can be allocated sooner to that phase of the restoration.
Table 2. Estimated mean numbers of fault and shaking-related pipe failures that will need immediate
post-earthquake repair, for the four main water routes into Wellington City.
System Shaking Fault Rupture
Kaitoke – Karori 10 3
Whakatikei – Karori 9 1
Wainuiomata – Thorndon 8 2
Hutt Artesian – Thorndon 7 (max) 2
It must be borne in mind that two potential failures of the Kaitoke system have not been included in
the modelling. One is failure of a “Flume Bridge” which carries water from the Kaitoke intake across
the Hutt River in a steep-sided gorge. Although the Flume Bridge has been strengthened against
earthquake shaking its survival is not guaranteed. If it does fail the repair time could be substantial,
and additional to the time needed to repair the other breaks in the Kaitoke – Karori pipeline. The other
is failure of a highway bridge across the Hutt River at Silverstream. The pipeline is attached to the
bridge piers, but is located partly beneath the deck, and so is likely to be ruptured if any of the several
6spans were to drop. Once again, repair could be complex and lengthy.
Table 3. Estimated times to restore a limited bulk water supply to Wellington City, in days from the
earthquake, without and with the proposed Whakatikei source.
System Current Sources Whakatikei Present
Kaitoke – Karori 35 – 55 –
Whakatikei – Karori – 20 – 35
Wainuiomata – Thorndon 60 – 80 55 – 75
Hutt Artesian – Thorndon 60 – 80 55 – 75
6.1 Sensitivity Studies
A few sensitivity studies were conducted, mainly to check that the results were not unduly sensitive to
some of the mean parameters selected. Note that only the numbers of failures were of interest here,
because the fault breaks remained the same in all cases. The cases investigated were as follows:
• Location of epicentre (base case: epicentre at the centre of fault, variations: epicentre moved 6
km to the northeast (along the fault) so as to increase the shaking intensity over the northern
source zones and then 6 km to the southwest). The northeast shift of the epicentre made no
significant changes to the numbers of failures, and the southwest change lowered the numbers
of failures by one or two.
• Earthquake magnitude (base case: 7.6, variations 7.3 and 7.9). Increasing the magnitude by
0.3 increased the numbers of failures by about two for each system, and reducing the
magnitude by 0.3 lowered the numbers by about two.
• Proportion of welded steel failures needing immediate repair (base case: 20%, variations 50%
and 100%). Increasing the proportion from 20 to 100% increased the numbers of failures by
two – four for the systems supplying Karori, and by 12 – 13 for the systems supplying
Thorndon. This difference arises because the Karori routes are dominated by jointed pipelines,
whereas the Thorndon route is dominated by welded steel pipeline.
The first two cases seem unlikely to have a great impact on the restoration times of Table 3, and the
third, which results in significantly increased restoration times for the Thorndon termination point,
simply serves to reinforce the importance of the pipelines to the Karori terminus.
7 DISCUSSION
The original motivation for the water restoration project (Cousins et al 2009) was to provide input to a
study of the potential economic benefits of a new regional water source at Whakatikei (Sanderson and
Norman, 2009). A more important outcome, however, may be to provide input to the ongoing debate
about how best to prepare for a large earthquake in the vicinity of Wellington. In 1991 the belief was
that “ recovery of a basic water service for priority use would take two days following a major
earthquake event. … To restore a 50% service would take two weeks … .” (CAE 1991), and current
Ministry of Civil Defence and Emergency Management advice to Wellington area residents is to store
“Water (3 litres per person, per day, for up to 3 days or more)” (MCDEM, 2007). Such advice now
seems totally inadequate. A recent unpublished background paper (Brunsdon, 2002) indicates (a) a
higher recommended minimum daily usage of about 15 litres per person per day, (b) that reservoirs
around Wellington City might retain 8 – 18 days of water at that usage rate, (c) that restoration of the
Kaitoke to Karori bulk system could take about 23 days, thus (d) leaving a 5 – 15-day deficit between
the end of the stored water and the restoration of emergency supply
Anther important point that the restoration times are for provision or a survival-level of water to
7specified delivery points throughout the city. People will have to collect their water from those points.
Extrapolating from work on the Hutt City distribution network (Zhao et al, 2008) would indicate that a
further 6-12 months might be required for full restoration of reticulated water to households.
The current results (Table 3) suggest that there would be an approximate 30-day water deficit if supply
from Kaitoke is required, or about 15 days for the proposed Whakatikei source. Neither are tenable,
because water is essential for life. Clearly new thinking is required about ways to provide water to
Wellington area people post large earthquakes.
8 ACKNOWLEDGEMENTS
We greatly appreciate the helpful reviews of our work carried out by Dave Brunsdon of Kestrel
Limited, and reviews of our paper by Kim Wright and Rob Buxton of GNS. Funding for the work was
provided by Greater Wellington Regional Council and the Foundation for Research Science and
Technology, Contract No. C05X0301.
REFERENCES:
ALA (2001). American Lifelines Alliance, Seismic fragility formulations for water systems, Part 1 – Guideline,
Part 2 – Appendices. ASCE. http://www.americanlifelinesalliance.org/
ALA (2005). American Lifelines Alliance, Seismic guidelines for water pipelines, ASCE, March 2005.
http://www.americanlifelinesalliance.org/
Brunsdon, D. (2002). “Emergency water supply to the Wellington Metropolitan area following a major
earthquake”. Unpublished Draft Background Paper Dec 02. 24p.
CAE (1991). “Lifelines in earthquakes – Wellington case study”. Project Report, Centre for Advanced
Engineering, University of Canterbury, 210p.
Cousins, W.J., Hancox, G.T., Perrin, N.D., Lukovic, B., King, A.B. and Smith, W.D, 2009. “Post-Earthquake
Restoration of the Wellington Area Bulk Water Supply”. GNS Science Consultancy Report 2009/11 April
2009. 67pp.
Dowrick, D.J. and Rhoades, D.A. (2005). “Revised models for attenuation of Modified Mercalli Intensity in
New Zealand earthquakes”. Bulletin of the New Zealand Society for Earthquake Engineering, 38(4): 185-214.
MCDEM. (2007). “Household Emergency Checklist”. Ministry of Civil Defence and Emergency Management
http://www.getthru.govt.nz/web/GetThru.nsf/web/BOWN-7GZTZF?OpenDocument (January 28th, 2010)
Rojahn, C. and Sharpe, R.L. (Principal Investigators) and expert panel (1985). Earthquake Damage Evaluation
Data for California. Report ATC-13, Applied Technology Council, California.
Sanderson, K. and Norman, D. (2009). “Framework for economic impact assessment of earthquake disruption to
Wellington metropolitan lifelines”. Report to Greater Wellington Regional Council, Business and Economic
Research Limited, Wellington. 50p.
Shi, P. (2006). “Seismic response modelling of water supply systems”. PhD Thesis, Cornell University, 291p.
Zhao, J.X., Cousins, W.J., Lukovic, B. and Smith, W.D. (2008). “Critical Factors for Restoration of Water
Supply Pipelines in the Hutt City, New Zealand after a Magnitude 7.5 Earthquake from the Wellington Fault”.
Proceedings, 14th World Conference on Earthquake Engineering, October 12-17, 2008, Beijing, China. Paper
No. 06-0025.
8You can also read