Farm Environmental Management
Plan: Waitangi Station
←
→
Page content transcription
If your browser does not render page correctly, please read the page content below
Farm Environmental Management Plan: Waitangi Station
1.         Introduction

The Water Quality Study (‘WQS’) funded by Mackenzie Water Research Limited (‘MWRL’), found that
the additional irrigation proposed in the catchment could take place without significant adverse effects on
the environment providing that nutrient reduction occurred on the farms.

The process that was advocated for ensuring this on-farm nutrient reduction was through Farm
Environmental Management Planning. A clear process for building a Farm Environmental Management
Plan (FEMP) was laid out in the Water Quality Study and has been followed here. An overview
schematic of the process of building a FEMP is shown in Figure 1.
The responsibility for the implementation, monitoring and auditing of the plan lies with the farmer.

Figure 1: Overview schematic of the process to build a Farm Environmental Management Plan

MGAP – Mandatory good agricultural practice
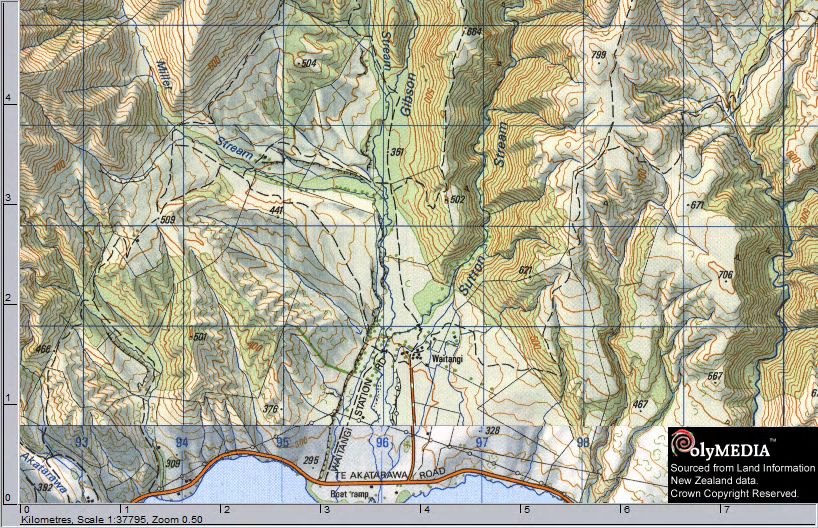
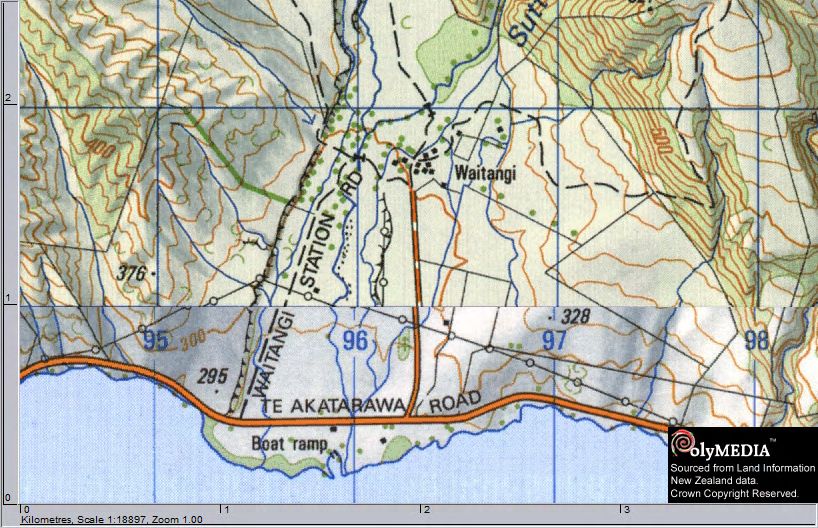
2.        Farm Description

2.1       General farm description
Waitangi Station is a high country station which is predominantly hill country with a small amount of flat
land, approximatley 200 ha. The station currently runs 14,000 merino sheep and 300 cattle. All stock are
summered and wintered on the hill country. The hill country comprises a large area of 2500-3500ft mid
altitude country of which 5000ha has been oversown and topdressed. The lower areas of rolling hill and
flat area of cultivation approximately 140 ha and some oversown and topdressed approximately 400ha.

Three catchments form the property giving the property a North-South aspect. Ground cover ranges
from grasses (lower alttitude) fescue tussock (mid altitude) snow tussock (high altitude) matagouri and
other native scrub is spread throughout.

Map A: Location map
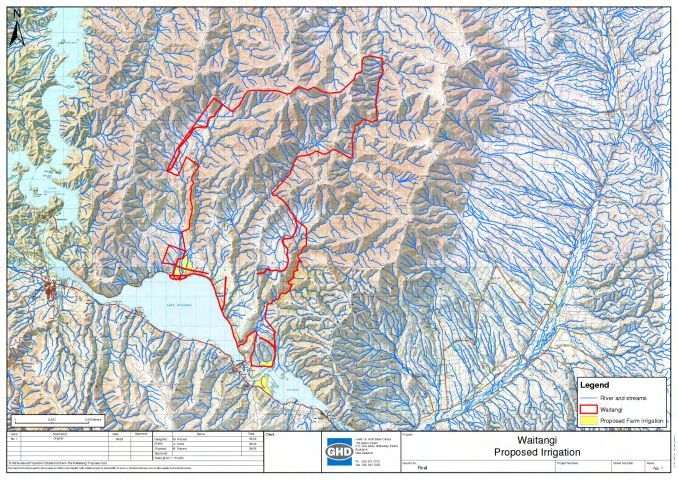
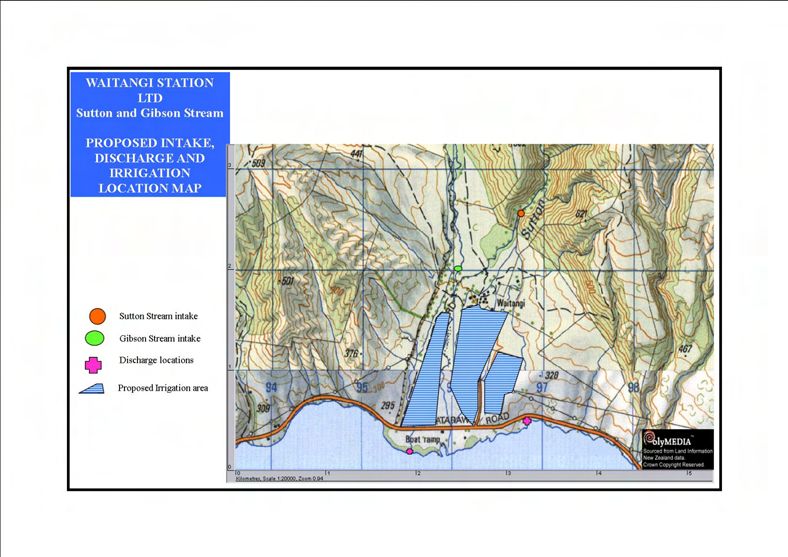
Map B: Proposed Irrigation Location map for Gibson/Sutton area
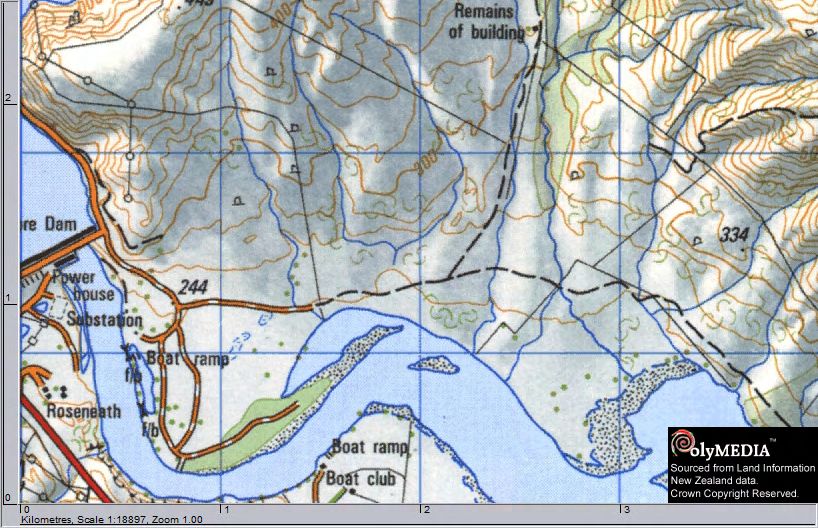
Map C: Proposed Irrigation Location map for Lake Aviemore area
Table 1. Cover utilisation by season and stock class for current system
Cover utilisation by season and stock class - CURRENT
Class of stock Spring Summer Autumn Winter
Ewes Oversown Hill Oversown Hill Oversown Hill Oversown
Hill/Native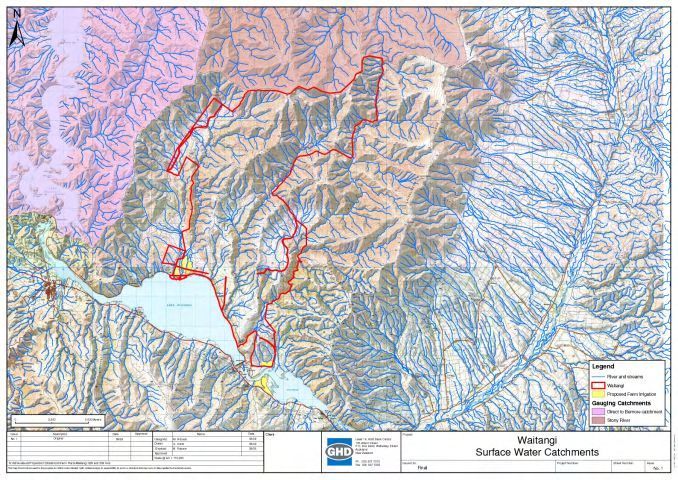
Hoggets                Grass flats and        Oversown Hill           Oversown Hill          Oversown Hill
                       oversown hill

Breeding cows          Oversown Hill          Oversown Hill           Oversown Hill          Oversown Hill

Wethers                Oversown               Native                  Native                 Native
                       Hill/Native

Photo A: Area of land to be irrigated using Sutton Stream Water, shows existing land cover (photo courtesy of Susannah Vesey)

Photo B: Area of land to be irrigated using Sutton Stream Water, shows existing land cover (photo courtesy of Susannah Vesey)

Photo C: Area to be irrigated using Lake Aviemore water. Proposed irrigation area runs along base of hills on left and across to
fence line on right. Willows and tussocks along lake create a ‘buffer zone’. Photo taken from main highway (photo courtesy of
Susannah Vesey)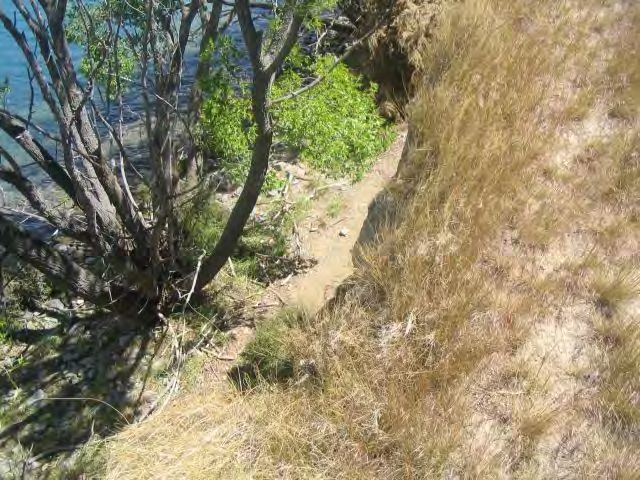
Photo D: Type of vegetation that forms the buffer zone at the Lake Aviemore proposed irrigation area

2.2        Proposed farming system
The proposed irrigation development is at two separate sites; Sutton/Gibson and at Lake Aviemore. 78
hectares is proposed to be developed at the Sutton/Gibson location and 50 hectares at Lake Aviemore.
Irrigation will ensure winter feed supplies as well as cull merino lambs will be fattened in Sept-Oct as
opposed to selling store. Cattle will be used strategically on irrigation to be fattened i.e. run on hill till 12-
20 months old then finished on irrigation. Strategic saving of autumn grass to feed to twin bearing and 2
tooth ewes before lambing.

Table 2. Cover utilisation by season and stock class for proposed system

                               Cover utilisation by season and stock class - PROPOSED

Class of stock         Spring                  Summer                  Autumn                 Winter

Ewes                   Some ewes               Oversown hill           Oversown hill          Oversown hill
                       grass flats and
                       oversown hill

Hoggets                Grass flats and         Oversown hill           Oversown hill          Oversown hill
                       oversown hill

Breeding cows          Oversown hill           Oversown hill           Oversown hill          Oversown hill

Wethers                Oversown                Oversown                Oversown               Oversown
                       hill/native             hill/native             hill/native            hill/native

Pasture and crop rotation is unknown at this stage but will be as required e.g. cereal-lucerne, or short
term crops e.g. Italian ryegrass-permanent pasture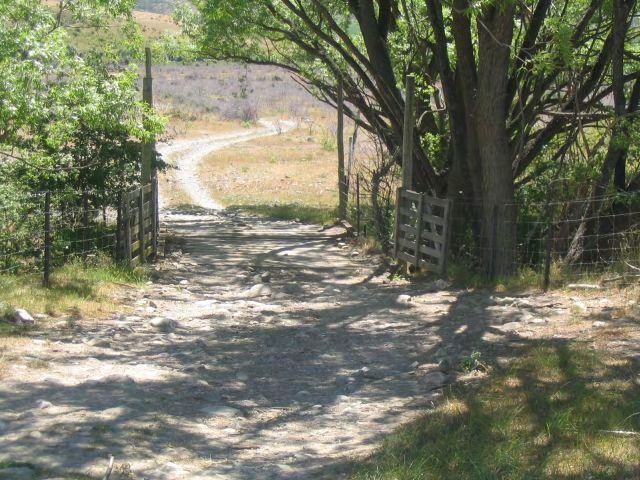
2.3        Soils
Soils range from stony flood plain around the Homestead area, to good soils over clay on the downs
around the Homestead. Good soils with rocky outcrops in mid altitude country very rocky steep gorges.
Steep high altitude country stony soils rising to shingle tops.

The soils in the proposed irrigation development areas are as below:
         Sutton/Gibson – Eweburn, Tasman and Becks with PAW of between 40-100mm

         Lake Aviemore – Grampians, Dalgety and Eweburn with PAW of between 45-90mm

2.4        Topography
Waitangi topography is formed by 3 catchments, Deep Stream, Stony Creek and Sutton Stream. Gorges
formed by these streams are very steep right down to Lake Aviemore except for Sutton Stream which
opens out onto a flood plain approximately 1.5km from Lake Aviemore. Altitudes range from
approximately 260m (Lake Waitaki) to 1880m (Mt Sutton). Approximately ½ the property is mid altitude
rolling hill with the back ½ of the property steep hill.

2.5        Climate
Rainfall records have been taken at the Waitangi Homestead for approximately 50 years; these put the
variation from the last 50 years of between 225mm at the driest to 650mm at the wettest.

Snow: most winters 3000-3500ft snowline, most winters there is snow cover to the lowest point on the
farm but shifts reasonably quickly in approximately 1-7 days. Heavy snow every 3-5 years over whole
property.

Temperature to -15oC in winter, frost average -5oC and -10oC

Summer temperatures can rise up to 38oC.

Map D: Mean annual rainfall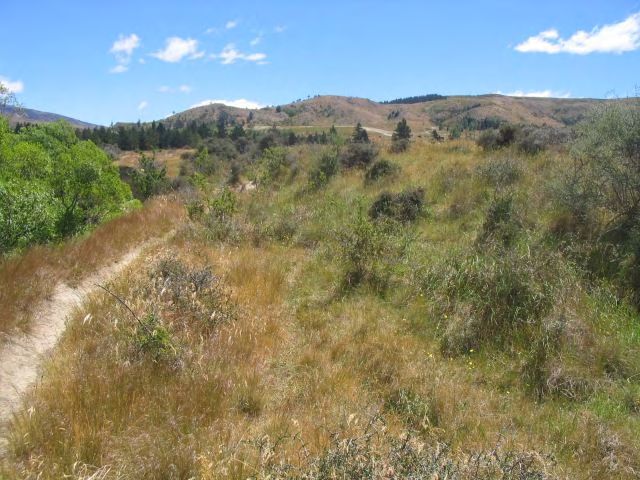
3.         Environmental Context

The environmental context of the farm is a reference both to local and wider receiving environments.

3.1        Water Quality Study receiving environments and mitigation requirements
Waitangi Station, according to the WQS, lies in the Lake Aviemore surface water catchments for the
Gibson/Sutton area of proposed irrigation and Lake Waitaki for the Lake Aviemore area of irrigation, as
can be seen from the below map.
As can be seen below in Table 3, Waitangi has no specific mitigation requirements from the WQS.

Map E: Surface water receiving environment

3.2        Local receiving environments
Lake Aviemore and Lake Waitaki are the large local receiving environments for Waitangi Station
proposed irrigation. Both are artificial lakes, with 95% open water, with steep shorelines. Both provide
habitat for waterfowl. Deep Stream, Sutton Stream, Gibson Stream and Stony Stream are all smaller
local receiving environments. These streams are all small rocky bottomed streams that flow within the
boundaries of Waitangi Station and drain into either Lake Aviemore or Lake Waitaki.

Table 3. Water Quality Study mitigation requirements for Waitangi Station

             Stream mitigation     Secondary Stream       Stream           Secondary        GWR          Lake Mitigation
             required for          mitigation required    mitigation       Stream           mitigation   required kg/ha
             periphyton kg/ha      for periphyton         required for     mitigation       required     irrigated land
             irrigated land        kg/ha irrigated land   ANZECC kg/ha     required for     kg/ha
                                                          irrigated land   ANZECC kg/ha     irrigated
                                                                           irrigated land   land

Waitangi     N/A                   N/A                    N/A              N/A              N/A          N/A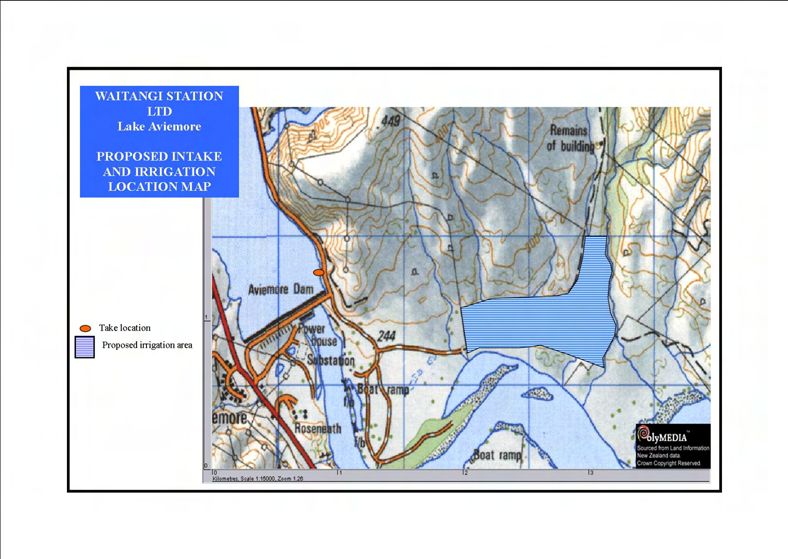
4.        Farm Environmental Management Plan development

4.1       Stage 1 – Mandatory good agricultural practices
The table below shows the mandatory good agricultural practices that will be adopted. These include the
base assumptions of OVERSEER and therefore help validate the use of the model on the farm.

Table 4. Mandatory good agricultural practices

 Mandatory good agricultural            What these practices mean on farm
 practices

 Fertilisers applied according to       The fertiliser users’ code of practice aims to ensure that where
 code of practice for fertiliser use    fertilisers are used that they are used safely, responsibly and
                                        effectively and in a way that avoids, remedies or mitigates any
                                        adverse environmental effects. The code of practice includes
                                        guidance on fertiliser use, application, storage, transport, handling
                                        and disposal.

 Use a fertiliser recommendation        Planning fertiliser applications to all crops, determining crop
 system (nutrient budget) and           requirement and accounting for soil nutrients and organic nutrient
 account for all sources of nutrients   supplies, all reduce the risks of applying excessive fertiliser above
 including applied effluents and soil   the crop requirement. This maximises the economic return from
 reservoirs accounted for               the use of fertilisers and reduces the risk of causing nutrient
                                        pollution of the environment
                                        Accounting for all sources of nutrients including imported sources
                                        and soil reservoirs is an important management measure in all
                                        farming systems and become especially important on farms where
                                        manure is produced and applied to the land. The re-application of
                                        organic manures to land is often thought of as a disposal of a
                                        waste product, and the available nutrients within the organic
                                        manures are not accounted for. The use of an integrated nutrient
                                        budgeting tool such as OVERSEER automatically accounts for
                                        nutrients supplied in organic manures.

 Fertiliser application applied         The even application of fertiliser is an assumption of the
 evenly                                 OVERSEER model as included in the fertiliser code of practice.
                                        Fertiliser spreaders should be tested and calibrated in-house at
                                        least annually and every 5 years by an independent auditor.

 Irrigation and effluent applied        The even application of water and or effluent is an assumption of
 evenly                                 the OVERSEER model. Irrigators should be tested and calibrated
                                        in-house at least annually and then every 5 years in accordance
                                        with the code of practice for irrigation evaluation by a qualified
                                        irrigation auditor.

 Crop, cultivation, nutrient inputs     Maintaining good crop input records is important for:
 and yield records kept per farm
 management unit                            •   The calculation of cumulative annual organic fertiliser
                                                applications and also their contribution to long term
                                                nutrient supply;
                                            •   The prediction of realistic crop yields that are used to
                                                determine crop requirements;

                                            •   Providing accurate inputs to the OVERSEER nutrient
                                                budgeting model that is being used here as a proxy for
measuring diffuse nutrient losses.
Good design of irrigation systems Design will match soil properties and low application amounts on
shallower soil to prevent summer drainage.
Robust irrigation scheduling Good irrigation scheduling to prevent summer drainage.
Supplement and feeding out To be addressed in the Farm Environmental Risk Assessment.
management
Winter grazing management To be addressed in the Farm Environmental Risk Assessment.
4.2 Stage 2 – OVERSEER and meeting WQS mitigation requirements
The WQS thresholds set for Waitangi Station, using the most stringent nutrient mitigation requirement,
are 56286 kg N/year and 2390 kg P/year. The table below shows the output from OVERSEER for the
modelled proposed farming system at Waitangi Station. The results illustrate that the proposed farm
system losses as modelled by OVERSEER are within the thresholds set out by the WQS. Management
or mitigation strategies that have been used to meet this threshold are detailed in Section 5.
Table 5. Total N and P losses modelled by OVERSEER for the proposed farming system on
Waitangi Station and WQS thresholds
OVERSEER modelling WQS threshold kg/year
proposed outputs kg/year
Total N leaching/runoff 46354 56286
Total P leaching/runoff 671 2390
4.3 Stage 3 – Identification and mitigation of site specific environmental risks
The Farm Environmental Risk Assessment FERA has been undertaken on the existing farming system at
Waitangi and has highlighted potential soil risks. These risks are described below. The full FERA is
attached as Appendix A.
The FERA focused on the irrigation areas; existing or proposed and any intensively farmed areas in the
farming system.
4.3.1 Soil Risk
The risks associated with soil are that although wind erosion wasn’t evident there is a potential
vulnerability to wind erosion. The establishment of irrigation will ensure improved ground cover levels
which will reduce the risks associated with bare ground and wind erosion.
4.3.2 Site specific management measures and mitigation measures in place
1. There are vehicle/stock bridges at Waitangi to cross streams close to the
Homestead/woolshed/yards.
Photo E: Wooden stock bridge for stock and vehicles to cross a stream close to the woolshed.2. There is an approximate 10m drop down to Lake Waitaki where the proposed irrigation
development is to occur. This is in addition to the minimum 20m buffer zone between the Lake
and the proposed irrigation development (see Figure 2)
Figure 2: Not to scale drawing of the buffer zone created at the Lake Aviemore irrigation area by the 10m bank and the 20m
minimum buffer zone
Proposed irrigation area at
Approx 10m drop Lake Aviemore
down to Lake
surface
20m minimum buffer zone
Lake Waitaki surface
.Photo F: Approximate 10m drop down to Lake Waitaki surface from the end of the buffer zone
3. Fodder crops are grown as part of the pasture renewal process, ensuring that organic matter
levels are not depleted in only a few paddocks. They are usually grazed over the early spring for
twin bearing ewes. Regrassing will be at the earliest opportunity.
4. A contractor or approved handler if required is used to apply chemicals at Waitangi.
5. Cultivations and Trafficking
Direct drilling is the primary method for renewing pasture. Inversion tillage is used if required to break in
(cultivate for the first time) any new pastures and occasionally soil can be left bare over winter. Inversion
tillage is used at the most appropriate time to reduce the potential effects of wind erosion.
Reestablishment of pastures is not expected to involve inversion tillage.
Stock are grazed over winter and trafficking of soils when wet does occur. Annual monitoring and
identification of soil compaction and documented remedial actions taken will ensure any soil compaction
due to stock grazing over winter is identified.
6. Compaction
Soil around water troughs is not compacted nor does pugging occur at present. If compaction does
occur then this will be assessed during the annual soil compaction survey and remedial action taken if
required.
7. Runoff
There is no evidence of track runoff entering a watercourse. This will be monitored as part of the annual
track survey. Annual monitoring and identification of track runoff and documented remedial actions taken
will ensure any track runoff entering a watercourse is identified.
8. Erosion
There is no evidence of stock induced bank side erosion in either the Sutton or Gibson Streams. This
will be monitored as part of an annual survey, as outlined in Table 8.4.3.3 General issues on extensive high country farming systems In extensive high country farming systems there are a number of issues that on more intensive farming systems would be assessed as being a risk to water quality but on extensive high country farming systems they have not been defined as a risk due to the extensive nature of the farming systems and the lower stocking rate per hectare. Some of these general issues have been identified below: 1. There will be areas within the farming system where tracks will cross waterways; these are tracks that are used irregularly, in extensive areas of the farm. 2. There are also areas within a high country farming system where stock will have unrestricted access to streams for crossings and stock water. This is essential access for stock movement and stock water. On most farms there are a number of small creeks/streams that flow within the hill country and it would be logistically impossible to place stock crossings on all of these. There is also the need for stock to move across streams/creeks within a block (paddock) for grazing access. A reticulated water system would be unsustainable in the hill country as troughs would freeze solid in the winter months, preventing access to fresh drinking water. 3. Swamps/heavy grounds are an integral area in a high country farming system; they provide a water source and good grazing for stock in dry years. In undertaking the FERA it has been identified that all swamps/heavy ground need to be monitored to ensure that bank erosion, compaction and pugging does not occur. 4. Wind erosion is a significant issue in the upper Waitaki Catchment. The sparse vegetation on large areas of land in the Mackenzie Basin gives little protection to the shallow, friable soils which continue to be eroded by frost heave and westerly winds. A mean soil loss of 0.22 mm/year or 2.2 tonnes of soil lost per hectare across a number of sites within the Mackenzie Basin has been reported. While it cannot be assumed from this information that erosion rates will continue at this level in the future, the results do confirm a strong relationship between the percentage of vegetation cover and erosion risk. The problem of bare ground and exposure to wind erosion has been compounded since the early 1990s by the rapid spread of hieracium particularly on the poorest soils. One of the most significant impacts of further irrigation in this area would be a reduction in the amount of bare ground and corresponding reduction in wind erosion risk. (Environmental, Economic and social impacts of irrigation in the Mackenzie Basin. Ministry for the Environment, February 2005.) 5. Monitoring and identification of any problems arising for the above issues has been included in Table 8.
5.        Farm Environmental Management Plan for Waitangi
           Station

5.1       Mitigation measures and management options adopted on Waitangi Station
The table below shows the all the mitigation and management tools that are proposed to be undertaken
on Waitangi Station. Measures indicated as FEMP stage 1 are those identified as Mandatory Good
Agricultural Practice, measures identified as FEMP stage 2 are those changes that have been
modelled in OVERSEER to meet the WQS mitigation requirement (if required), and those indicated
as FEMP stage 3 are mitigation measures chosen to ameliorate site specific environmental risks
on the farm..

Table 6 indicates in brief how the measures are to be monitored and audited.

Table 6. Table of mitigation options, monitoring and auditing for Waitangi Station

 FEMP
 stage   Measure                                       Monitoring                  Auditing

         Fertilisers applied according to code of
 1       practice for fertiliser use                                               Self certification

                                                       Soil and effluent testing   Reconciliation of fertiliser, effluent and
         Accounting for all sources of nutrients       and cumulative effluent     soil records with nutrient budget for
         including applied effluents and soil          inputs per management       example blocks. Submission of
 1       reservoirs                                    unit                        examples soil and effluent tests

                                                       Calibrate and optimise
                                                       fertiliser spreaders
                                                       annually and every 5 years
 1       Even fertiliser application                   by an external auditor     Submission of testing and calibration

                                                       Calibrate and optimise
                                                       irrigators annually in house
                                                       and every 5 years by an
 1       Even irrigation and effluent application      external auditor             Submission of testing and calibration

         Record crop, cultivation, nutrient inputs
 1       and yields per farm management unit           Upkeep of records           Submission of example block records

         Good design of irrigation systems             Design of irrigation system Irrigation system audited by a certified
 1                                                     by a certified professional auditor every 5 years

         Robust irrigation scheduling                  Calculation of annual %     Submission of annual % effective
 1                                                     effective water use         water use

         No winter application of fertiliser on
         irrigation land. Application of fertiliser on
         the hill country is often in autumn or late
 2       winter and is approximately 60kg/ha           Field records               Signed field records

         N fertiliser applications split to under 50
 2       kg N/application                              Field records               Signed field records

         No P fertiliser within three weeks of
 2       irrigation                                    Field records               Signed field records

         Olsen P of below 30 maintained; only
         applicable to those areas where the           Regular soil testing (every
 2       natural P level of the soil is below 30       3 years)                    Submission of soil tests

         Gibson and Sutton Streams to be fenced
         within the irrigation area, with irrigation
         set back from the streams of a minimum                                    Annual Audit and updates by photos if
 3       of 5m.                                      Photos and location map       additional fencing is undertaken
FEMP
stage Measure Monitoring Auditing
Buffer zone created between the
irrigation area and Lake Waitaki;
minimum of 20m (see Photo C, Figure 2 First annual audit and then bi-annual
3 and Map C) Photo and location map photo
Monitor and manage stock access, stock
type and stock number from all Location Plan and photos in first audit
permanently flowing waterways within report
other non irrigated intensively farmed Location Plan of
3 areas waterways and photos
20 metre layback from any water way
when applying fertiliser by land based
3 application e.g. bulk spreader Field records Annual Audit report
Map F: Mitigation measures at Sutton/Gibson proposed irrigation development area
All of the irrigation areas will be fully
fenced to restrict stock access to
Gibson and Sutton Streams in this
Proposed irrigation areas
areaMap G: Mitigation measures at Lake Aviemore proposed irrigation development area
Proposed irrigation area
Minimum of 20m buffer to be
established between the
irrigation area and Lake
Waitaki. Bottom of the
irrigation area to be fully
fenced
5.2 Monitoring and Auditing
5.2.1 Baseline monitoring
Baseline monitoring is already underway on Waitangi Station.
Water quality monitoring of the Sutton Stream was undertaken by the Upper Waitaki Water Quality Trust
for the applicant in April, June and October 2007 and January 2008.
Table 7. Baseline monitoring on Waitangi Station
Location Frequency Measured parameters to include
All irrigation
paddocks and
intensive areas in
Soil Soil nutrient testing rotation 1 in 3 years Standard suite of soil nutrients
April, June October Total Nitrogen, nitrate, ammonia, total Kjeldahl
Sutton Stream 2007 and January nitrogen, total phosphorus, dissolved reactive
Water Surface water quality exit from property 2008 phosphorus, suspended solids.
Ground cover and
Pasture species All blocks Annually % Ground cover, speciesLocation Frequency Measured parameters to include
Done as part of an annual survey from ECan Hot
Pest Pest Infestation Whole Farm Annually spot locations of pest infestation
Weed Weed Infestation Whole farm Annually Self monitored for weed infestation
5.2.2 On-going monitoring
On going monitoring and auditing of FEMP are as important as the plan itself.
Table 7 above shows the current monitoring undertaken for Waitangi Station and Table 8 below shows
the proposed monitoring plan, frequency, location for the monitoring along with the triggers and
contingency plans if triggers are exceeded.
Table 8. Example monitoring plan for Waitangi Station showing location, frequency and
parameters for monitoring
Measured
parameters to Contingency plan if
Location Frequency include Triggers triggers are exceeded
Soil To include: Soil All irrigation 1 in 3 years for Standard suite of soil Olsen P of 30 in Reduce or stop the
nutrient testing paddocks soil nutrient nutrients those areas where application of P fertiliser
and intensive status the Olsen P is to the area and monitor
areas in naturally less than
rotation 30
Soil Soil compaction All irrigation Annually for soil Soil compaction Compaction, Remove compaction with
testing blocks in compaction surface capping the appropriate tool
rotation testing.
Runoff Wet weather All irrigation Annually Runoff Runoff occurring Immediately review
survey blocks current runoff mitigation
options for tracks.
Introduce further runoff
removal infrastructure
where appropriate.
Water Surface water The existing Quarterly for the Total Nitrogen, nitrate, No significant If comparative surface
quality Sutton first 5 years and ammonia, total decrease in water water analysis indicates
Stream site then reviewed Kjeldahl nitrogen, total quality a decrease in surface
and another phosphorus, water quality then the
in conjunction dissolved reactive degraded determinant
with phosphorus, E Coli should be identified while
neighbour, and suspended a full root cause analysis
yet to be solids. is undertaken
determined
Water Irrigation Annually in Application uniformity >80 % Optimisation of the
application house and 1 in 5 irrigator performance will
years by an be performed at the time
independent of testing
Tracks Visual All tracks that Annually Visual assessment of Any sign of Restrict vehicle and
that assessment of cross bank/stream erosion extensive visual stock access until an
cross bank/track creek/stream caused by vehicle erosion assessment of the
waterway erosion within crossing or stock damage and cause can
s extensively be made
farmed areasMeasured
parameters to Contingency plan if
Location Frequency include Triggers triggers are exceeded
Fertiliser Fertiliser Annually in Application uniformity >80 % Optimisation of the
application house and 1 in 5
years by an spreader performance
independent will be performed at the
time of testing
Pest pest populations Relevant Annually % or magnitude of ECAN monitor and Legislative compliance
pressures blocks infestation communicate if
their triggers have with notice of direction
been exceeded issued by ECAN
Weed Weed Relevant Annually % or magnitude of Self trigger Undertaken annually by
populations blocks infestation
self monitoring, spray
those areas that require
Map H: Existing and proposed locations of water quality monitoring.
Existing monitoring
location, Sutton Stream
bridge
Where triggers are exceeded, the immediate contingency plans in Table 9 should be implemented while
a ‘root cause’ analysis is carried out. Any further mitigation measures to be adopted as a result of
monitoring should be added to Tables 7, 8 and 9
1) Is the current mitigation option implemented correctly?
No – Implement and monitor
Yes – to 2)
2) Has anything changed in the farm system?
Yes – remodel and monitor
No – to 3)3) Have there been abnormal conditions at the time of trigger breach?
Yes – continue monitoring to see if trigger breach continues
No – Seek advice if suitably qualified person to investigate root cause and suggest appropriate
mitigation.
If emergency conditions occur that risk a pollution event, such as a catastrophic failure of the irrigation
system that is resulting in overland flow to a watercourse, seek immediate guidance from your regional
council:
Environment Canterbury 0800 76 55 88
5.2.3 Auditing
The auditing process allows both the farm operator to illustrate, and other interested parties to have
confidence that the management practices and mitigations planned for the farm are being implemented.
In addition, the audit shows that there is a mechanism for the adaptive management of the property
should the chosen mitigation or management not perform to expectations.
An annual audit is proposed, and requires both external and in-house input. The annual audit should be
completed and submitted to ECan by end of July each year.
Those pertaining to FEMP stages 1 and 2 are included here.
Table 9 below shows an example of an annual audit report for Waitangi Station.
Table 9. Table showing proposed contents of an annual audit report for Waitangi Station
Mitigation Measure Audit Measures Action in case of non compliance
Annual audit of OVERSEER Should the OVERSEER report show
nutrient budget and report losses exceeding the threshold, further
based on previous 3 years. mitigations should be adopted to effect a
Submission of compliance reduction in nutrient loss to below
with thresholds thresholds.
Where triggers have been exceeded,
immediate contingency plans should have
Submission and brief been carried out and a root cause
interpretation of water quality analysis conducted. The results of which
analysis should be presented here.
Submission and brief of Any remedial actions proposed after the
annual wet weather survey annual survey should be undertaken.
Submission and brief of
annual tracks that cross Any remedial actions proposed after the
waterways survey annual survey should be undertaken
Submission and brief of
annual compaction survey of Any remedial actions proposed after the
the irrigation area annual survey should be undertaken
Annual pest and weed
survey undertaken by Ecan
should be submitted Legislative compliance
Fertilisers applied according to code of Any issues should be rectified and
practice for fertiliser use Self certification identified in next audit
Reconciliation of fertiliser
Accounting for all sources of nutrients and soil records with nutrient Where reconciliation is not verified then
including applied effluents and soil reservoirs budget. this should be rectified at next auditCalibrate and optimise
fertiliser spreaders annually
and every 5 years by an
external auditor. Signed Spreaders not performing shall be
Even fertiliser application records for verification recalibrated
Calibrate and optimise
irrigators annually in house
and every 5 years by an
Even irrigation application external auditor Submission of testing and calibration
Record crop, cultivation, nutrient inputs and If records have not been produced then
yields per farm management unit Verification of records this should be rectified for next audit
Good design of irrigation systems by a Irrigation system audited by
certified professional and audited every 5 a certified auditor every 5
years years and any changes If changes recommended not
recommended should be implemented then this should be rectified
implemented by next audit
Robust irrigation scheduling If records not received then this should be
Verification of records rectified by next audit
No June/July application of fertiliser on the If records not received this should be
irrigated area Field records rectified for next audit.
If records not received this should be
N fertiliser applications split to under 50 kg rectified for next audit
N/application Field records
If records not received this should be
rectified for next audit
No P fertiliser within three weeks of irrigation Field records
Where triggers have been exceeded,
immediate contingency plans should have
Submission and brief been carried out and a root cause
interpretation of soil test analysis conducted. The results of which
Olsen P of below 30 maintained results should be presented here.
Gibson and Sutton Streams to be fenced
within the irrigation area, with irrigation set Check fenced area is Areas of fencing damage should be
back from the streams of a minimum of 5m. present. Photos repaired.
Buffer zone created between the irrigation
area and Lake Waitaki; minimum of 20m Check setback area is Areas of fencing damage should be
(see Photo C, Figure 2 and Map C) present. Photos repaired.
20 metre layback from any water way when
applying fertiliser by land based application
If maps not received with annual audit this
e.g. bulk spreader Field records and maps should be rectified by the next audit.6. Summary This FEMP has been written to serve two purposes; to ensure the proposed farm system can meet the nutrient mitigation requirements set out by the MWRL Water Quality Study, and to set out the process for identification of farm specific environmental risks that arise from the inherent characteristics of the farm and from the proposed farm system and its management. The WQS thresholds and modelled outputs from OVERSEER detailed in Section 4.2 illustrate that this proposed system meets the WQS thresholds identified. A full on-farm risk assessment was completed in December 2009 with a commitment to address the risks identified. Section 4.3 sets out the risks identified for this property and those issues common to all high country farming systems, along with existing mitigation measures. The mitigation and management measures detailed in Table 6 set out the measures that have been adopted to mitigate and manage the risks that were identified in the risk assessment along with mandatory good agricultural practices and those measures that have been modelled in OVERSEER. Baseline monitoring and any additional monitoring proposed for this property are identified and set out in Section 5.2, Tables 7 and 8 allows the performance of the measures chosen to be monitored and where they are performing sub-optimally, these can be addressed through the root cause analysis process. The auditing of this plan, addressed in Section 5.2.3, Table 9 ensures that the relevant mitigation measures outlined in Table 6 are audited annually either internally or externally and communicated to ECAN by the end of July each year.
7.       References

Ministry for the Environment. 2005. Environmental, Economic and social impacts of irrigation in the
Mackenzie Basin.

GHD (2009a). Cumulative Water Quality Effects of Nutrients from Agricultural Intensification in the
Upper Waitaki Basin – Mitigation Toolkit.
Webb, T. H. (1992). Soils of the Upper Waitaki Basin, South Island, New Zealand, DSIR.
APPENDIX A: Farm Environmental Risk Assessment

                              GUIDELINES QUESTIONS FOR THE
                              COMPLETION OF A FERA                                     November/December 2009
The plan is to focus on those existing/proposed irrigation areas along with any intensive areas surrounding. We also need to keep in mind that this is a
whole farm environmental risk assessment and hence other areas of the farm may also be applicable at times. Take notes on wetland areas, swamps,
major streams/rivers, location of the yards in relation to watercourses
Some guideline                                                                         Notes/description
questions for track
management and runoff
                             Do any regularly used tracks run through streams?       No, culverts or bridges are installed (photos of stock bridges). In
                                                                                     extensive high country properties there are areas within the farm where tracks will
                                                                                     cross streams, these will be tracks that are used irregularly
                         1
                             Do any tracks directly runoff to a water course         No
                         2
                             Stock crossings?                                        Bridges are used for stock crossing (Photos) In extensive high country
                                                                                     properties there are areas within the farm where stock will cross streams and use
                                                                                     streams for stock water.
                         3
                             Any evidence of previous runoff, soil wash or           No
                         4   erosion?
                                                                                     NO
                             Do you have a silage pit located near a permanent
                         6   watercourse?
Some guideline
questions for stock
management
                             Are measures taken to control dietary intakes of N      N/A
                             and P? (Intensive beef and dairy)
                         1
                             Are stock restricted from entering watercourses in      Yes, fenced areas. The new irrigation development will exclude
                             intensively farmed areas?                               stock from flowing waterways within the irrigation area, buffers will be
                                                                                     created of at least 20m at Lake Aviemore and similar at Sutton and
                         2                                                           Gibson
Do you graze stock in paddocks that have a No
hydraulic connection to a watercourse in winter
3 months?
Yes for dipping, runoff minimal and cannot enter a waterway
Yards - do you use water? If yes, details (e.g. is it
4 collected, discharged, what is it used for…?)
Some guideline
questions for
biodiversity
Are there any special areas or species of interest or NO
conservation on the farm?
1
Are there any water or wetland features on the farm? NO
2
3 Are these features actively protected?
Some guideline
questions for chemical Chemical storage and handling is dealt with under the Hazardous
usage Substances and New Organisms Act
Are those handling chemicals of ‘approved handler Yes, contractors are used for spraying
status’?
1
Some guideline
questions for water
Do you use border dyke irrigation? NO
1
Do you collect wipeoff losses? N/A
2
Are these wipeoff losses discharged to a N/A
3 watercourse
Is there evidence of bankside erosion in any No, all of the streams on the property are shallow and stony
permanent flowing watercourses?
4
Some example
questions on croppingIs inversion tillage used? Describe Yes, is required to break in new ground, for all pasture renovation
1 direct drilled is used
Are soils left bare over winter? Yes occasionally, they are sprayed and then left (not cultivated)
2
If arable or fodder crops are grown, are measures Yes, Italian ryegrass is grown for ewes just prior to lambing, it is not
taken to conserve or build soil organic matter on grazed in the winter
3 arable land?
Are remedial measures in place after winter grazed N/A
4 crops?
Is there a possibility of run off from winter grazed N/A
5 areas reaching a water course?
Other cropping issues or incidences? Please
6 describe
Some example
questions on soil health
Are there compacted, consolidated or capped soils? None evident
1
Some example
questions on pest and
weed management
Do you undertake any current pest or weed control?
1 E.g rabbits, gorse Few rabbits controlled by shootingYou can also read