Zostera muelleri A comparison of environmental variables between the Maketū - Toi-Ohomai
←
→
Page content transcription
If your browser does not render page correctly, please read the page content below
Zostera muelleri
A comparison of environmental variables between the Maketū
Estuary & seagrass beds within the Tauranga Harbour & Waihi
Estuary.

                                               Bay of Plenty Regional Council
By Ethan Russell &
                       Nov 2019 – March 2020     / Toi Ohomai Institute of
David Guccione                                           Technology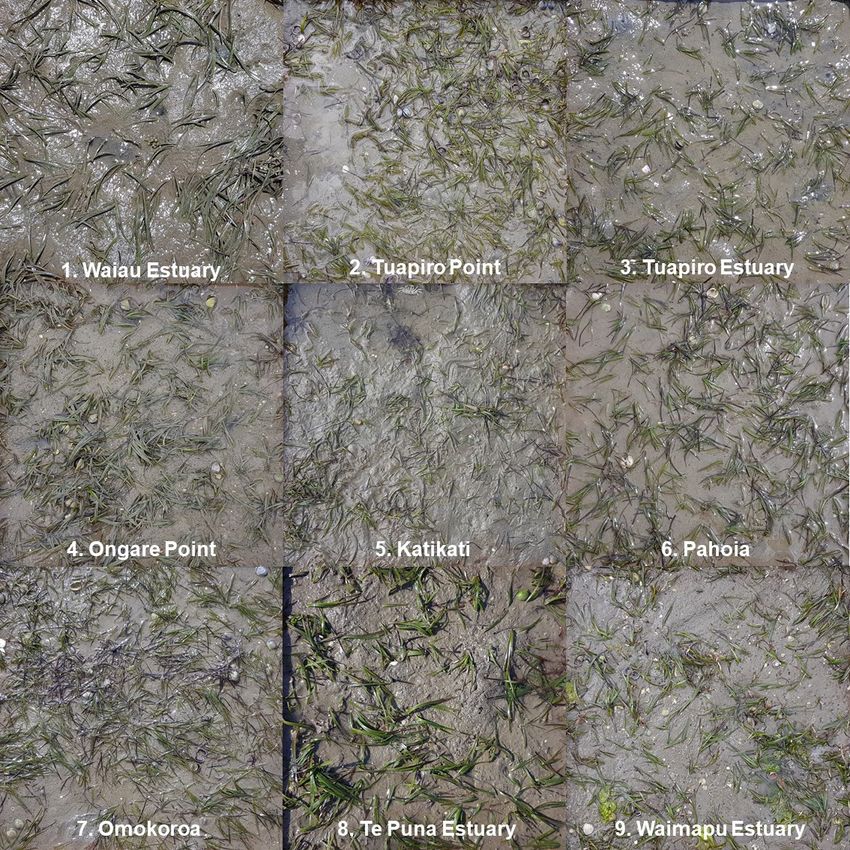
1
Abstract ....................................................................................................................................... 3
Introduction ................................................................................................................................ 4
   1.1 Seagrass Ecology ........................................................................................................................... 4
   1.2 Decline of Seagrass ....................................................................................................................... 5
   1.3 Aims & Hypotheses ....................................................................................................................... 5
       1.3.1 - Null Hypotheses ................................................................................................................... 6
Methods ...................................................................................................................................... 6
   2.1 Site Selection................................................................................................................................. 6
   2.2 Equipment ..................................................................................................................................... 9
       2.2.1 - Water Sampling.................................................................................................................... 9
       2.2.2 – Light & Temperature ........................................................................................................... 9
       2.2.3 - Substrate Sampling ............................................................................................................ 10
       2.2.4 - Seagrass Percentage Cover ................................................................................................ 10
   2.2.5 Statistical Analysis .................................................................................................................... 10
Results....................................................................................................................................... 11
   3.1 Seagrass Percentage Cover ......................................................................................................... 11
       3.1.1 Seagrass Quadrat Analysis The densest seagrass was measured at Ongare Point with 31%
       coverage. The sparsest seagrass was measured within the Te Puna Estuary at 18.2%. Scatter plot
       analysis comparing recorded water parameters failed to return an R2 value greater than 0.5,
       suggesting that there was no notable trend when correlating % cover of seagrass with recorded
       water quality variables. ................................................................................................................. 11
       3.1.2 Seagrass Quadrat Images ..................................................................................................... 11
   3.2 Water Quality .............................................................................................................................. 13
       3.2.2 Ammonium The highest ammonium reading was taken at Maketū and the lowest from
       Tuapiro Point There was a significantly greater mean concentration of ammonium at sites
       without seagrass compared to the sites without (p =.002). ........................................................... 13
       3.2.4 Nitrate .................................................................................................................................. 13
       3.2.5 Total Nitrogen ...................................................................................................................... 14
       3.2.6 Dissolved Phosphate ............................................................................................................ 14
       3.2.7 Total Phosphate ................................................................................................................... 15
       3.2.2 Conductivity ......................................................................................................................... 15
       3.2.3 Dissolved Oxygen ................................................................................................................. 16

                                                                                                                                                        2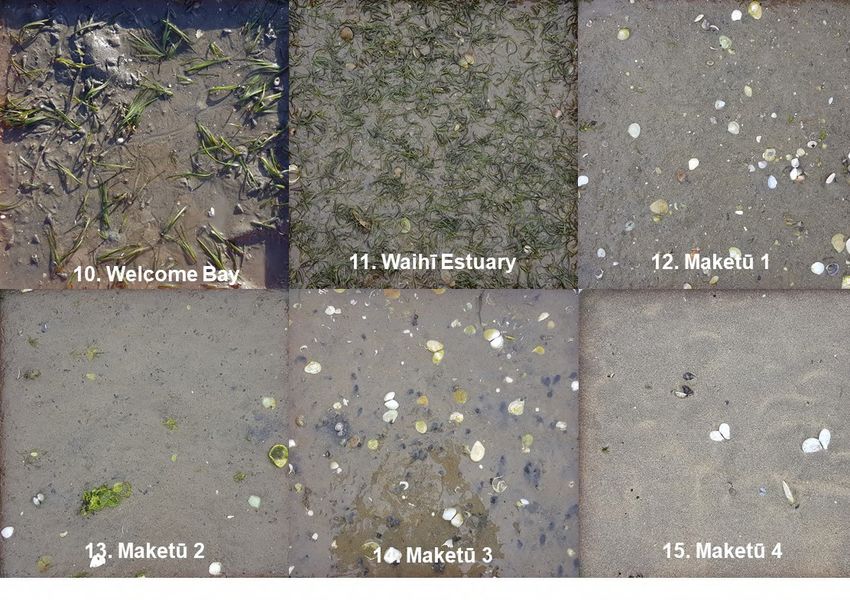
.......................................... 16
      3.2.8 Turbidity ............................................................................................................................... 16
   3.3 Light & Temperature Data .......................................................................................................... 17
      3.3.1 Illuminance (Lux) .................................................................................................................. 17
      3.3.2 Temperature ........................................................................................................................ 17
   3.4 Substrate Sampling ..................................................................................................................... 18
      3.4.1 Grain Size ............................................................................................................................. 18
      3.4.2 Substrate Nutrient Analysis ................................................................................................. 18
Discussion.................................................................................................................................. 19
   4.1 Recommendations ...................................................................................................................... 21
Conclusion ................................................................................................................................. 21
Reference List ............................................................................................................................ 22

Abstract
Seagrass (Zostera muelleri) is in decline within most of its distributed area worldwide and
throughout the Bay of Plenty in New Zealand, particularly in Maketu estuary which has had a
long term decline since the 50s and the loss of all of the remnant seagrass beds in the last 20
years. For the purpose of gaining insight into potential success of seagrass transplantation
and restoration, water quality parameters, sediment characteristics, seagrass coverage,
illuminance and temperature data were measured at eleven sites with seagrass (ten within the
Tauranga Harbour, one within the Waihī Estuary) and four sites with historic loss within the
Maketū Estuary. Maketu estuary sites had significantly higher ammonium levels (p=.002),
although nitrate, total nitrogen and phosphorous were not higher or sometimes lower
compared to areas with seagrass. Eutrophication cannot be clearly identified as a causal agent
for seagrass loss from this study. Maketu had significantly higher temperature (p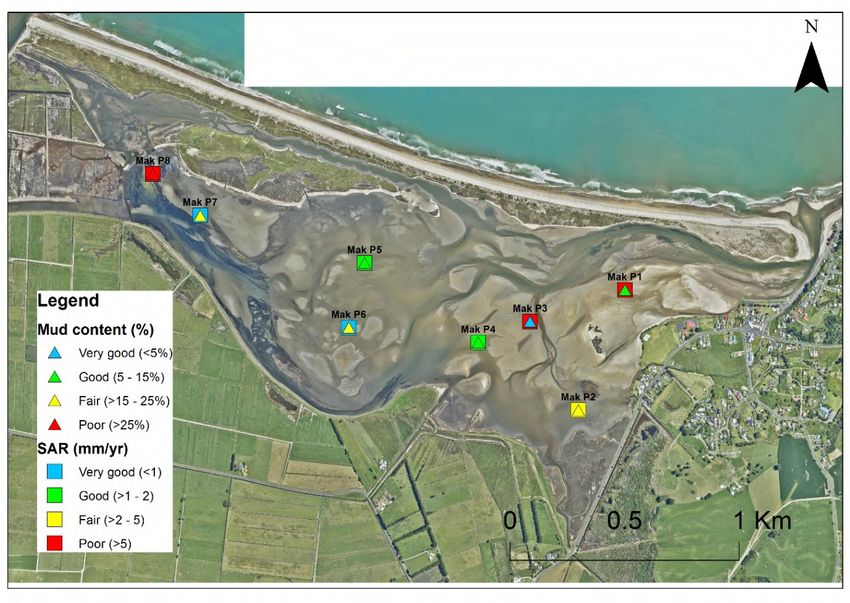
so, the recently completed rediversion and greater water flow from the Kaituna river could
mitigate the highest summer temperature extremes and seagrass may once again be able to
survive in Maketu estuary. There were not significant differences in any other measured
variables. Recommendations for a successful seagrass transplantation project are discussed.

Introduction

1.1 Seagrass Ecology
Seagrass (Zostera muelleri, formerly known as Z. capricorni or Z. novazelandica) is New
Zealand’s only marine angiosperm (flowering plant) (Jacobs, Les & Moody, 2006), often
occupying soft sediment habitat typically within the intertidal zone of coastal estuarine &
Harbour systems. Seagrass may also inhabit shallow waters near offshore islands such as
Slipper Island, throughout New Zealand (Schwarz et al., 2006). Z. muelleri brings additional
structure to its respective environment, this in turn provides habitat & shelter, for a multitude
of marine fauna from invertebrates to juvenile fish, including commercially valuable species
such as Snapper (Pagrus auratus) (Schwarz et. Al, 2006), as such it supports a high degree of
potential biodiversity, particularly in large continuous beds (>1000 m2), (Mills &
Berkenbusch, 2009). The physical form of seagrass also results in a reduced flow rate across
its cover, this enables fine sediments to settle at a greater rate, reducing re-suspension and
subsequently assisting in sorting and substrate stabilisation (Heiss et al., 2000). Growing
evidence suggests that seagrass is an invaluable contributor to global carbon storage, due to
its ability to sequester large amounts of carbon in the form of plant biomass and organic
particles deposited within the seagrass beds (Duarte et al., 2013).

        Figure 1. Emerged seagrass (Zostera muelleri) bed in Northland’s Parengarenga Harbour, NZ. (Ethan Russell, 2020)

                                                                                                                           4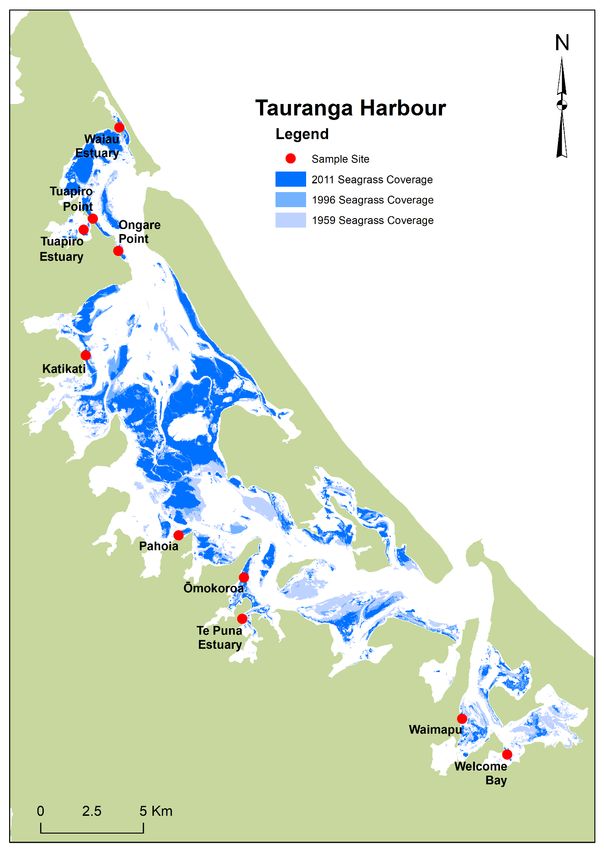
1.2 Decline of Seagrass
Seagrass habitats are under threat globally due mostly to a suite of anthropogenic stressors,
in New Zealand specifically these stressors are thought to include eutrophication, increased
sediment loading, waterfowl grazing, shifts in water temperature and physical disturbance
such as dredging and land reclamation (Orth et al., 2006, Roca et al., 2016, Unsworth et al.,
2018). The Tauranga Harbour has the majority of seagrass beds within the Bay of Plenty
region, 96.4% covering a total of 2,744.9 ha, with the remainder distributed across Ohiwa
Harbour & smaller estuaries such as Waihī Estuary (Park, 2016). Tauranga Harbour suffered
a large-scale loss between the years of 1959 & 1996 (conceivably due to the 1981 Ruahihi
canal failure, which resulted in large volumes of sediments entering the Wairoa river (De La
Hyde, 2007), Through that time, 34% of its seagrass beds dissapeared, with the losses
primarily taking place in the southern end of the Harbour (Park, 1999). Between 1996 &
2011 this loss was not nearly as dramatic, with a total decline of 6.5%, suggesting the decline
has slowed to some degree but not halted (Park, 2016). The trend has been the same within
other areas of the Bay of Plenty, with the Waihī Estuary recently declining to a few residual
beds & the Maketū Estuary incurring a total loss of seagrass, contributing to the assessment
of overall deterioration of the estuary’s health (Park, 2018).

1.3 Aims & Hypotheses

Over time the Maketū Estuary has been subject to considerable changes in both its water
quality and hydrology, with the primary freshwater inlet, the Kaituna River, diverted directly
out to sea in 1956 for the purpose of enhanced land drainage and flood control. Recently
large-scale re-diversion work has taken place to attempt to restore 20% of the historical
freshwater flow, and as such presents an opportunity to investigate the prospect of seagrass
restoration through transplantation to further assist its ecological recovery. Few studies exist
detailing the efficacy of seagrass transplantation within New Zealand, however one study
performed within the Whangarei Harbour found that survival and growth can be achieved for
up to 24 months post-transplant if the site is carefully selected (Matheson et al., 2017,
Schwarz et al., 2005). Successful transplantation is likely the fastest means of re-establishing
seagrass at sites with historic loss, as flowering (sexual reproduction) is associated with
seagrass beds of a high biomass and coverage which don’t exist in Waihi or Maketu estuary
and have rarely been observed in New Zealand (Dos Santos & Matheson, 2017). Therefore
it’s thought that rhizomatic growth from transplanted seagrass sods may be the quickest way
to re-establish beds into the post-diversion Maketu estuary.
The specific purpose of this study is to identify any statistically significant difference in light,
temperature, sediment and water quality variables that may be contributing to seagrass
absence in the Maketū Estuary, in comparison to existing seagrass beds in Tauranga Harbour
& the Waihī Estuary. Sampling was performed at selected sites across the three tidal
estuaries. The data collected from the Maketū Estuary also serves as a baseline prior to the
completion of the re-diversion for continued environmental monitoring, and future restorative
efforts.

                                                                                                   5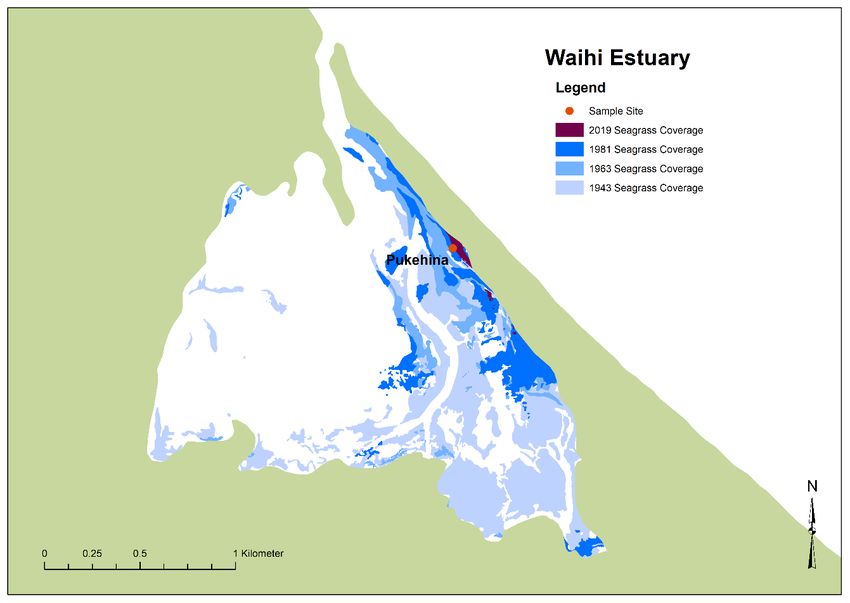
1.3.1 - Null Hypotheses
H0 - There is no statistically significant difference in water quality (as measured by mean
ammoniacal nitrogen, conductivity, dissolved oxygen, turbidity, phosphate/phosphorus,
nitrite & nitrate, total nitrogen levels) from collected water samples between sites with
seagrass (Tauranga Harbour/Waihī Estuary) and sites with historical seagrass loss within the
Maketū Estuary.
H0 - There is no statistically significant difference in substrate quality (as measured by mean
grain size, total recoverable phosphorus, nitrogen and organic carbon levels) from collected
sediment samples between sites with seagrass (Tauranga Harbour/Waihī Estuary) and sites
with historical seagrass loss within the Maketū Estuary.
H0 - There is no statistically significant difference in mean light intensity & temperature
levels recorded at sites with seagrass (Tauranga Harbour/Waihī Estuary) and sites with
historical seagrass loss within the Maketū Estuary.

Methods

2.1 Site Selection
Tauranga Harbour contains many sub-estuaries with varying degrees of water quality,
sediment profiles & amounts of tidal flow – due to the high morphological variation within
Zostera muelleri beds, ten sites were selected, evenly split between both the Northern and
Southern end of the Harbour. These sites contain a mixture of both discrete and continuous
beds, providing a robust variety of habitat variability. Waihī Estuary at present plays host to
two known discrete beds, with the bed located near Pukehina Beach Road selected for ease of
monitoring and recording. In order to compare sediment quality, water parameters, and
light/thermal conditions relevant to the suitability of seagrass beds four sites were selected
within the Maketū Estuary, three of which historically had some seagrass coverage (Figure 2,
Maketū 1, 2 & 3). The remaining Maketū Estuary site is located on the southern bank of the
main arterial channel (Figure 2, Maketū 4), serving as an approximate parallel to some of the
large continuous seagrass beds sites within the Tauranga Harbour, which are situated on the
shorelines of wide channels such as those at Tuapiro Point and Omokoroa (Figure 3). All
sites sit within the intertidal range for their respective areas, meaning they are covered by
water at high tide, and emerged during low tide.

                                                                                                  6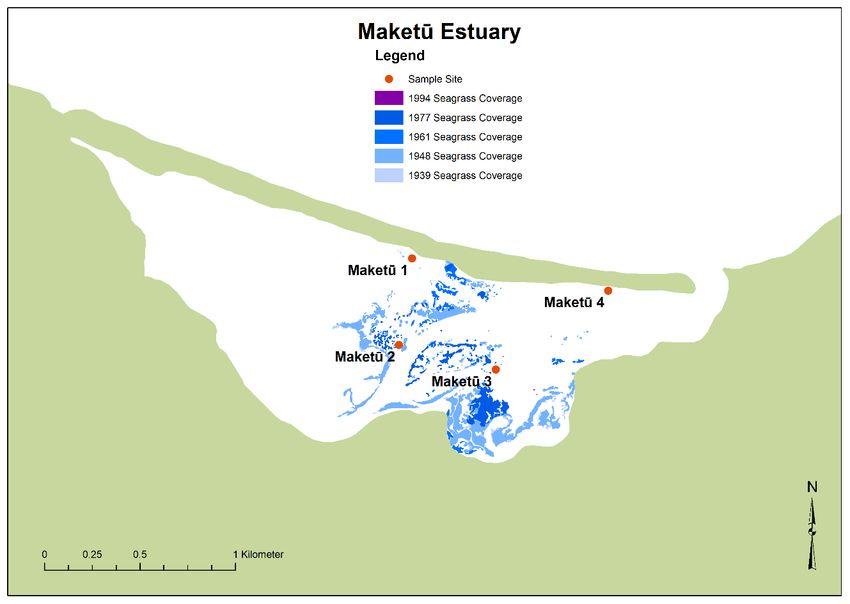
Figure 2. A map of Maketū Estuary showing historical cover and loss of seagrass, sampling sites marked in red. (BOPRC, 2020)

                                                                                                                               7
Figure 3. A map of Tauranga Harbour showing historical cover and loss of seagrass, sampling sites marked in red. (BOPRC, 2020)
8Figure 4. A map of Waihī Estuary showing historical cover and loss of seagrass, sampling site marked in red. (BOPRC, 2020)
2.2 Equipment
2.2.1 - Water Sampling
Water sampling consistently occurred at the nearest channel relative to the seagrass bed, for
sites without seagrass it occurred at the nearest channel to the site’s GPS co-ordinates with all
sampling occurring exclusively on the outgoing tide. Water samples were collected following
the protocols of the water quality NEMS (National Environmental Monitoring Standards,
draft 2027). Briefly, a 1L sterile sample bottle was used with a telescopic sampling pole was
filled with a water sample from ~0.3m below the water’s surface. Three samples were
collected from each site with 5 sites being sampled per run, runs were based on the site locale
(Northern Tauranga Harbour, Southern Tauranga Harbour and Maketū & Waihī Estuary)
with overall collection of samples occurring from late November 2019 to early January 2020.
Samples were transported on ice and transported to a laboratory within 24 hours of collection.
The samples were analysed for dissolved nutrient concentrations (nitrate, ammonium,
phosphate), total nutrient concentrations (total nitrogen, total phosphorus), and for turbidity.
In addition, prior to water sample collection a handheld probe was deployed ~0.3m below the
water’s surface to obtain real-time water temperature, conductivity and dissolved oxygen
levels (%/mg L).
2.2.2 – Light & Temperature
To obtain data on light intensity and temperature of each site, data loggers (HOBO MX2202)
were setup at each site on a metal stake approximately 2-4cm above the substrate surface at a
9zero-degree angle, in order to best replicate light conditions that seagrass experience. These
data loggers were placed at all sites and within bare patches amongst seagrass beds where
possible, otherwise they were placed approximately at a comparable mid-tidal position within
the immersion zone, but never directly in a channel. The equipment was left once at each site
for at least 7 days, with recording taking place at 10-minute intervals.
2.2.3 - Substrate Sampling
Samples were collected using a 50 mL syringe with the end cut off, resulting in a 2cm
diameter round core with a depth of 2cm, in line with protocols used by BOPRC in regional
Estuary monitoring (Lawton & Conroy, 2019). At each site, 12 cores were haphazardly taken
and pooled to create one representative sample of the sediment site. Samples were initially
stored on ice, and subsequently frozen until analysis.
Sediment samples were defrosted and dried in an oven at 60°C for 24 hours before sending
for grain size analysis (using laser diffraction). The remaining half of the sediment sample
was kept cool on ice and sent to a separate laboratory for analysis of sediment total organic
carbon (TOC), total nitrogen (TN), and total carbon (TC) values.
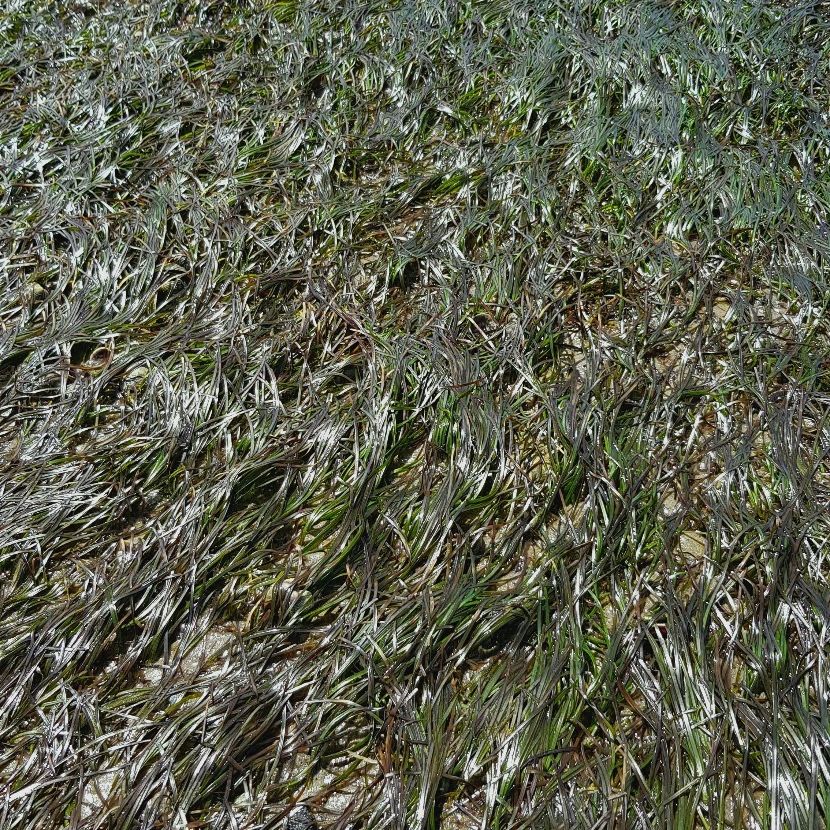
2.2.4 - Seagrass Percentage Cover
Using a square 0.25 m2 quadrat 10 haphazard image samples were taken from each of the 11
seagrass sites, with 3-4 images taken for sites without seagrass. Images were subsequently
analysed using Coral Point Count software that assigned 50 random points within the quadrat
boundary to determine percentage cover.
2.2.5 Statistical Analysis
Mean differences in variables between sites with seagrass and those without were compared
using 2 sample independent t-tests assuming normality, using Excel ver. 1912.
10Results
3.1 Seagrass Percentage Cover
3.1.1 Seagrass Quadrat Analysis
The densest seagrass was measured at Ongare Point with 31% coverage. The sparsest
seagrass was measured within the Te Puna Estuary at 18.2%. Scatter plot analysis comparing
recorded water parameters failed to return an R2 value greater than 0.5, suggesting that there
was no notable trend when correlating % cover of seagrass with recorded water quality
variables.
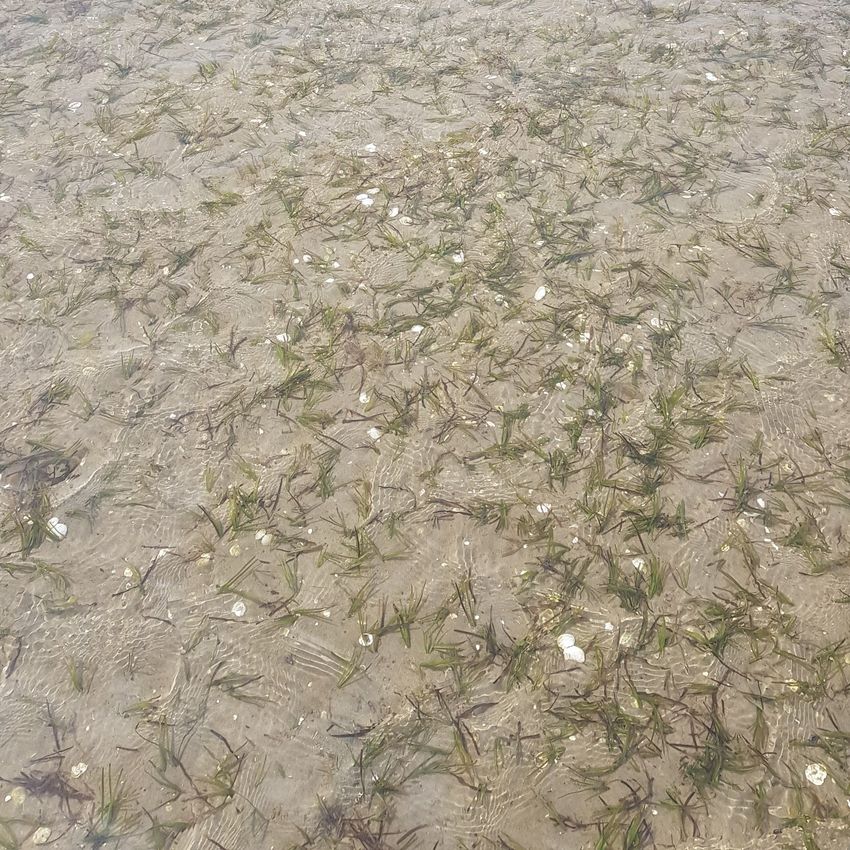
3.1.2 Seagrass Quadrat Images
Figure 5. Quadrat images from 9 of the seagrass sampling sites, showing differences in coverage, morphological
form and sediment appearance.
11Figure 6. Quadrat images from each of the sampling sites continued, showing differences in coverage,
morphology and sediment appearance.
Figure 7. Box plot of seagrass percentage cover from quadrat images from all sites.
123.2 Water Quality
3.2.2 Ammonium
The highest ammonium reading was taken at Maketū and the lowest from Tuapiro Point
There was a significantly greater mean concentration of ammonium at sites without seagrass
compared to the sites without (p =.002).
Figure 8. Ammonium content of water samples taken from all sites. Seagrass sites coloured green and sites
without seagrass coloured blue.
3.2.4 Nitrate
The highest nitrate level was measured at Waihī Estuary and several sites including Maketū
4, Omokoroa, Pahoia & Katikati had readings of 0g/m3. There was no significant difference
in mean nitrate levels at sites with seagrass and sites without (p=.78).
Figure 9. Nitrate content of water samples taken from all sites. Seagrass sites coloured green and sites without
seagrass coloured blue.
133.2.5 Total Nitrogen
The highest total nitrogen reading was recorded at Waihī Estuary and the lowest at Maketū 4
There was no significant difference in mean total nitrogen levels between sites with seagrass
and sites without seagrass (p=.54).
Figure 10. Total nitrogen content of water samples taken from all sites. Seagrass sites coloured green and sites
without seagrass coloured blue.
3.2.6 Dissolved Phosphate
The highest levels of dissolved phosphate were measured at Waihī Estuary and several sites
had means of zero. There was no significant difference in mean dissolved phosphate at sites
with seagrass compared to sites without seagrass (p=.47).
Figure 11. Dissolved reactive phosphate content of water samples taken from all sites. Seagrass sites coloured
green and sites without seagrass coloured blue.
143.2.7 Total Phosphate
The highest levels of total phosphate were measured at Waihī Estuary and the lowest at both
Ongare Point and the Waimapu Mean total phosphate levels were not significantly different
at sites with seagrass vs. those without (p=.71).
Figure 12. Total phosphate content of water samples taken from all sites. Seagrass sites coloured green and sites
without seagrass coloured blue.
3.2.2 Conductivity
Conductivity readings as a proxy for salinity, were highest at Ongare Point and lowest at
Waihī Estuary There was no significant difference in mean conductivity between sites with
seagrass and those without (p=.52).
Figure 13. Conductivity readings taken from all sites. Seagrass sites coloured green and sites without seagrass
coloured blue.
153.2.3 Dissolved Oxygen
The maximum dissolved oxygen reading was measured at Maketū 4 and lowest reading was
measured at Welcome Bay. There was no significant difference in mean dissolved oxygen
levels at sites with seagrass and sites without (p=.15).
Figure 14. Dissolved oxygen content of water samples taken from all sites. Seagrass sites coloured green and
sites without seagrass coloured blue.
3.2.8 Turbidity
The maximum turbidity recording was from the Waihī Estuary and the minimum at Tuapiro
Point. No significant difference in mean turbidity was found between sites with seagrass and
sites without (p=.12)
Figure 15. Turbidity levels of water samples taken from all sites. Seagrass sites coloured green and sites without
seagrass coloured blue.
163.3 Light & Temperature Data 3.3.1 Illuminance (Lux) The highest mean illuminance was at Maketū 3 and the lowest at Katikati. There was significantly higher illuminance at sites without seagrass compared to sites with (p
3.4 Substrate Sampling

3.4.1 Grain Size
Grain size was larger at sites without seagrass compared to sites with seagrass, but not
significantly so (p=.101).

3.4.2 Substrate Nutrient Analysis
Total organic carbon levels within core samples were higher at sites with seagrass compared
to sites without seagrass although not significantly so (p=.12). This is unsurprising
considering the root mat of seagrass beds.

There was no trend in total nitrogen content or total recoverable phosphorous between sites
with seagrass and sites without (p=.48).

Note : Data for Ammonical, Nitrate, Total Nitrogen, Dissolved Reactive Phosphate, Total Phosphate are all missing 5 samples. Equipment
failure lead to unforeseeable delays in the samples being processed via a laboratory, and as a resultwere not able to be used for this study.

                                                                                                                                           18
Discussion
The only water quality parameter with a significant difference between sites with seagrass
and sites without was ammonium, which was higher at Maketū 1 & 3 (Figure 8).
Interestingly, it is also a chemical known to be highly toxic to the seagrass species Zostera
marina in concentrations upward of 125 µM (Van Katwijk et al., 1997), this implies that it
may be an inhibiting factor for potential transplants, however stressor tolerance levels within
Z. muelleri are not robustly studied, nor is how single stressors may interact with other
stressors of seagrass within New Zealand (e.g. sedimentation, grazing). Also, Ammonia is the
least persistent state of nitrogen, suggesting that there is a localized source near the Maketu
sites. No point source was identified, and a greater post-diversion flow rate from the Kaituna
river may dilute this higher concentration bringing Maketu more in line with sites with
eelgrass.
Temperature data collected by loggers deployed at the Maketū Estuary showed significant
differences when compared to sites with seagrass presence. Maketū Estuary sites sat within
the top 50% of all sites for mean temperature. Higher temperatures are potentially a product
of the comparative water volume which could be heating at a greater speed and to a greater
degree during the summer period. Temperature is thought to be another contributing variable
to seagrass health, with trials showing rapid loss of living shoots and leaf mass in Z. muelleri
occurring at 32°C (York et al., 2013). Certainly in summer they reach those temperatures on
the maketu flats. An increase of water flow from the rediversion could potentially keep these
areas cooler and could mean a better chance of survival of transplants
Higher illuminance or light levels contribute to higher temperatures and were also higher on
average at the Maketū Estuary sites, turbidity or clearer water conditions can be excluded as a
factor, as turbidity readings were generally higher than those at Tauranga Harbour seagrass
sites (Figure 15
The following data has been sourced from regular monitoring performed by the Bay of Plenty
Regional Council, and while no specific sampling from this report has contributed to the data,
it provides additional perspective to the sediment loading characteristics of locales which
were sampled on or around throughout the duration of this study.
19Figure 18. Maketū Estuary with various plate sites and the respective mud content & annual sedimentation rates
(BOPRC, 2020)
As visible in the Maketū sedimentation map (Figure 23) “Mak P1” & “Mak P3” or Plate 1 &
Plate 3 have a low mud content (5-15%) however have very high deposition rates (These are
nearest to sites Maketū 3 & 4 [P3 &P1 respectively]). This is consistent with anecdotal
reports from residents, of which report increased levels of sand within the Estuary in recent
years. While lacking substantiation, the high sand deposition could be a result of the
historically diverted Kaituna river, allowing sediments to be transported from the coast into
the estuary and accumulate near the entrance, , this trend may change now that 20% of the
historic input flow from the Kaituna River has been restored to the Maketū Estuary. Another
interesting point to make is that Tuapiro Point exterior and Omokoroa were the only larger
continuous beds sampled on and around, and these sites both had low concentrations of
nutrients & low turbidity levels alongside high percentages of sand content, and sat within the
upper end of mean light & temperature environment. The specific factors enabling the
persistence of large continuous seagrass bed growth aren’t acutely understood, however the
observed conditions at the Omokoroa & Tuapiro Point seagrass beds provide some insight
into the preferential quality of seagrass habitat, as well as location within an estuary – with
both beds adjacent to arterial channels of the northern Tauranga Harbour.
Maketū Estuary also exhibited slightly higher mean levels of dissolved reactive phosphate,
turbidity and total recoverable phosphorus within the sediment, the sites also had
approximately half the mean mud content as seagrass sites within the Tauranga Harbour &
Waihī Estuary. This could suggest that although sites within the Maketū Estuary were sandier
than most seagrass sites, the typically higher levels of nutrients within the water column and
sediment may be above those suitable for seagrass, potentially encroaching toxic levels for
the species.
20The Waihī Estuary had perhaps the most intriguing results of all sites, having the highest
concentration of multiple water column nutrient parameters (nitrite and nitrate, total nitrogen,
dissolved reactive phosphorus, total phosphate and turbidity (Figure. 11, 12, 13, 14 & 15)
despite supporting two discrete seagrass beds. A potential explanation for this is the
noticeably low levels of conductivity recorded during the study period, suggesting that it
could either catalyse a higher level of nutrient tolerance or be a result of a more responsive
and/or a greater level of genetic fitness (Dos Santos & Matheson, 2017) – as the species is
known to increase flower production (Ramage and Schiel, 1998) in lower salinity conditions.
Furthermore, the Waihī Estuary seagrass bed is adjacent to the estuary’s primary channel,
presumably resulting in a large degree of tidal flushing at high tide – and as such could be
exposed to differing degrees of water quality on or around the bed throughout the day. The
observations from Waihī Estuary suggest proximity to the channel may be a key element
supporting seagrass health, as noted with the Omokoroa & Tuapiro Point seagrass beds.
4.1 Recommendations
More samples including control sites within the Tauranga harbour and the Waihi estuary
which have had historical seagrass bed losses should be included if this monitoring is to
continue. Further data collection should occur at the seagrass beds, under varying rainfall
conditions. In addition temporal differences between the sites were not accounted for,
perhaps the tidal state could be standardized for collection at each site.
Elevation and intertidal exposure times are also important considerations for seagrass, which
likely has a high level of influence on the resulting light and temperature data collected by
deployed loggers and will likely vary at each site. Future work should be done to determine
which tidal elevation within the intertidal range has the highest suitability for seagrass.
Another potential stressor to consider for seagrass transplantation is grazing by black swans
(Cygnus atratus) (Dos Santos et al., 2013) which were observed whilst sampling within the
Maketū Estuary, and as such should be a factor for consideration of any future restoration
work. This could be expanded to include other biological stressors such as epiphytic algae,
rapidly growing macroalgae species i.e. Sea lettuce (Ulva lactuca) & red algae (Gracilaria
chilensis), of which were present in large quantities at Maketū 2, and as such may
outcompete or shadow any transplanted seagrass. Further monitoring should also seek to
assess any changes to the water quality & sediment data collected now that the Kaituna River
diversion has 9 of its 12 culverts currently open, which with modified hydrology may bring
about new trends in nutrient levels, temperatures and sedimentation rates.
Conclusion
To conclude, the sites sampled at within the Maketū Estuary have very few significant
differences between sites with seagrass in the Tauranga Harbour, and in some cases the
returned values appear “more suitable”, or are in lesser concentrations than they are at sites
with seagrass – this is particularly true when compared to Waihī Estuary across the board.
The variables that did have a significant difference from those with seagrass were ammonium
concentrations, as well as the light and temperature readings. Additionally, parameters like
21light, temperature and sand content align well with the larger continuous beds within the
Tauranga Harbour, specifically Omokoroa and Tuapiro Point exterior beds. The prospect of a
transplant appears viable as far as sediment grain size, mud/ sand content & light
environment is concerned – with the most concerning factor being temperature spikes, and
ammonium concentrations. Both of these are less likely to be mitigated by the greater water
flow post-diversion.
The probability of success of a transplantation is uncertain, with the estuary expected to
undergo some degree of change to its overall ecological health following the re-diversion.
Further monitoring should be carried out to identify any new negative/positive trends in
nutrient and/or sediment characteristics at the Maketū Estuary. At the same time, the risk of
environmental harm from a small scale seagrass transplant project is considered small, but
with potentially great benefits to restoring the Maketu estuary to its former state. Local
sourcing has been shown to optimise the prospective success rates (Jones et. Al, 2008).
Reference List
Bay of Plenty Regional Council. (2020). Kaituna River re-diversion opening
celebrated. https://www.boprc.govt.nz/your-council/news/news-and-media-releases/media-
releases-2020/february-2020/kaituna-river-re-diversion-opening-celebrated/
Booth, J. D. (2019). Recent (post-1930) changes in the extent of subtidal seagrass (Zostera
muelleri) beds of the eastern Bay of Islands, New Zealand. New Zealand journal of marine
and freshwater research, 53(1), 113-127.
Cussioli, M. C., Bryan, K. R., Pilditch, C. A., de Lange, W. P., & Bischof, K. (2019). Light
penetration in a temperate meso-tidal lagoon: Implications for seagrass growth and dredging
in Tauranga Harbour, New Zealand. Ocean & Coastal Management, 174, 25-37.
De la Hyde, R. D. (2007). Ruahihi Canal Collapse (A). Kaimai Hydro Power
Scheme. https://www.delahyde.com/tauranga/pagest/ruahihi_canal_collapse.html
Dos Santos, V. M., Matheson, F. E., Pilditch, C. A., & Elger, A. (2013). Seagrass resilience
to waterfowl grazing in a temperate Estuary: a multi-site experimental study. Journal of
experimental marine biology and ecology, 446, 194-201.
Dos Santos, V. M., & Matheson, F. E. (2017). Higher seagrass cover and biomass increases
sexual reproductive effort: A rare case study of Zostera muelleri in New Zealand. Aquatic
Botany, 138, 29-36.
Duarte, C. M., Losada, I. J., Hendriks, I. E., Mazarrasa, I., & Marbà, N. (2013). The role of
coastal plant communities for climate change mitigation and adaptation. Nature Climate
Change, 3(11), 961-968.
22Heiss, W. M., Smith, A. M., & Probert, P. K. (2000). Influence of the small intertidal
seagrass Zostera novazelandica on linear water flow and sediment texture.
Jacobs, S. W., Les, D. H., & Moody, M. L. (2006). New combinations in Australasian
Zostera (Zosteraceae). Telopea, 11(2), 127-128.
Jones, T. C., Gemmill, C. E., & Pilditch, C. A. (2008). Genetic variability of New Zealand
seagrass (Zostera muelleri) assessed at multiple spatial scales. Aquatic Botany, 88(1), 39-46.
Lawton, R., Conroy, E., (2019). Tauranga Moana State of the Environment Report 2019. Bay
of Plenty Regional Council Environmental Publication 2019/04.
https://atlas.boprc.govt.nz/api/v1/edms/document/A3324188/content
Li, M., Lundquist, C. J., Pilditch, C. A., Rees, T. A. V., & Ellis, J. (2019). Implications of
nutrient enrichment for the conservation and management of seagrass Zostera muelleri
meadows. Aquatic Conservation: Marine and Freshwater Ecosystems, 29(9), 1484-1502.
Mills, V. S., & Berkenbusch, K. (2009). Seagrass (Zostera muelleri) patch size and spatial
location influence infaunal macroinvertebrate assemblages. Estuarine, Coastal and Shelf
Science, 81(1), 123-129.
Orth, R. J., Carruthers, T. J., Dennison, W. C., Duarte, C. M., Fourqurean, J. W., Heck, K. L.,
Hughes, A. R., Kendrick, G. A., Kenworthy, J., Olyarnik, S., & Short, F. T. (2006). A global
crisis for seagrass ecosystems. Bioscience, 56(12), 987-996.
Park, S. G. (1999). Changes in abundance of seagrass (Zostera spp.) in Tauranga Harbour
from 1959-96. Environment BOP.
Park, S. G. (2016). Extent of seagrass in the Bay of Plenty in 2011. Bay of Plenty Regional
Council.
Ramage, D. L., & Schiel, D. R. (1998). Reproduction in the seagrass Zostera novazelandica
on intertidal platforms in southern New Zealand. Marine Biology, 130(3), 479-489.
Roca, G., Alcoverro, T., Krause-Jensen, D., Balsby, T. J. S., van Katwijk, M. M., Marba, N.,
Fernandez-Torquemada, Y., Duarte, C. M., Romero, J., Mascaro, O.,& Pérez, M. (2016).
Response of seagrass indicators to shifts in environmental stressors: A global review and
management synthesis. Ecological Indicators, 63, 310-323.
Rogers, K. (2019). Variation in benthic primary production during tidal emersion within
different intertidal habitats (Doctoral dissertation, The University of Waikato).
Schwarz, A. M., Morrison, M., Hawes, I., & Halliday, J. (2006). Physical and biological
characteristics of a rare marine habitat: sub-tidal seagrass beds of offshore islands. Science
for conservation, 269, 39.
Unsworth, R. K., McKenzie, L. J., Collier, C. J., Cullen-Unsworth, L. C., Duarte, C. M.,
Eklöf, J. S., Elkof, J. S., Jarvis, J. C., Jones, B. L.,& Nordlund, L. M. (2019). Global
challenges for seagrass conservation. Ambio, 48(8), 801-815.
23Van Katwijk, M. M., Vergeer, L. H. T., Schmitz, G. H. W., & Roelofs, J. G. M. (1997).
Ammonium toxicity in eelgrass Zostera marina. Marine Ecology Progress Series, 157, 159-
173.
York, P. H., Gruber, R. K., Hill, R., Ralph, P. J., Booth, D. J., & Macreadie, P. I. (2013).
Physiological and morphological responses of the temperate seagrass Zostera muelleri to
multiple stressors: investigating the interactive effects of light and temperature. PloS
one, 8(10).
24You can also read