Risk Evaluation Model of Life Loss Caused by Dam-Break Flood and Its Application - MDPI
←
→
Page content transcription
If your browser does not render page correctly, please read the page content below
water
Article
Risk Evaluation Model of Life Loss Caused by
Dam-Break Flood and Its Application
Wei Li 1,2 , Zongkun Li 2 , Wei Ge 2,3, * and Sai Wu 4
 1   School of Railway Engineering, Zhengzhou Railway Vocational and Technical College,
     Zhengzhou 450001, China
 2   School of Water Conservancy and Environment, Zhengzhou University, Zhengzhou 450001, China
 3   Safety and Security Science Group (S3 G), Faculty of Technology, Policy and Management, Delft University
     of Technology, 2628 BX Delft, The Netherlands
 4   Zhengzhou Airport Xinggang Investment Group Company, Zhengzhou 450001, China
 *   Correspondence: W.Ge@tudelft.nl or gewei@zzu.edu.cn; Tel.: +31-15-278-1776

 Received: 9 May 2019; Accepted: 27 June 2019; Published: 30 June 2019

 Abstract: The internal mechanism affecting life loss caused by a dam-break flood is complicated.
 On the basis of analyzing the risk formation path, a risk evaluation indicator system was established
 which included the hazards, exposure and vulnerability factors. Variable Fuzzy Sets theory was
 introduced into the risk evaluation of life loss risk grades and applied to eight collapsed dams in China.
 According to the sequence of the risk grades of these dams, the evaluation result was mainly consistent
 with the actual mortality ranking sequence, showing that the model could be effectively applied to
 the risk evaluation of life loss in dam-break events. Aimed at the problem of large differences in the
 downstream population distribution of dams in China, this manuscript suggested that 10,000 people
 should be the basis for the grouping operation of dams in the risk evaluation. These Variable Fuzzy
 evaluation models and grouping suggestions could help stakeholders to allocate the funds for dam
 reinforcement more accurately and provide a scientific basis for the study of dam-break life loss and
 dam risk management.

 Keywords: dam-break; variable fuzzy; life loss; risk

1. Introduction
      By the year 2013, the number of dams in China had exceeded 98,000, ranking first in the world [1].
However, due to specific historical reasons, a large number of the dams had various problems, such
as standard low flood control and poor quality both in design and construction, generating serious
threats to people’s lives downstream. According to the statistics [2], from 1954 to 2014, China had a
total of 3529 reservoir dam disasters, resulting in tremendous life loss in the past [3,4]. The safety of the
dams was closely related to the public security of China and dams, which could be of a potential crisis
dams were in large number and widely distributed. Dam-break would bring the downstream area
serious risk consequences, among which life loss had the greatest impact and was the most difficult to
estimate. With the increase in people’s safety consciousness and the improvement of the concept in
dam risk management, the government and the public are paying increasingly more attention to dam
safety and life-threatening risks. Therefore, it is extremely urgent to evaluate the risk of dam-break life
loss, and it is also of great significance to provide corresponding risk management countermeasures
for stakeholders.
      Life loss caused by a dam-break flood is a key technical problem in current studies on risk
management of dams [5,6]. Studies on the life loss of dam-break floods had started for decades,
and some achievements appeared and were introduced to China. The main achievements were as

Water 2019, 11, 1359; doi:10.3390/w11071359                                       www.mdpi.com/journal/water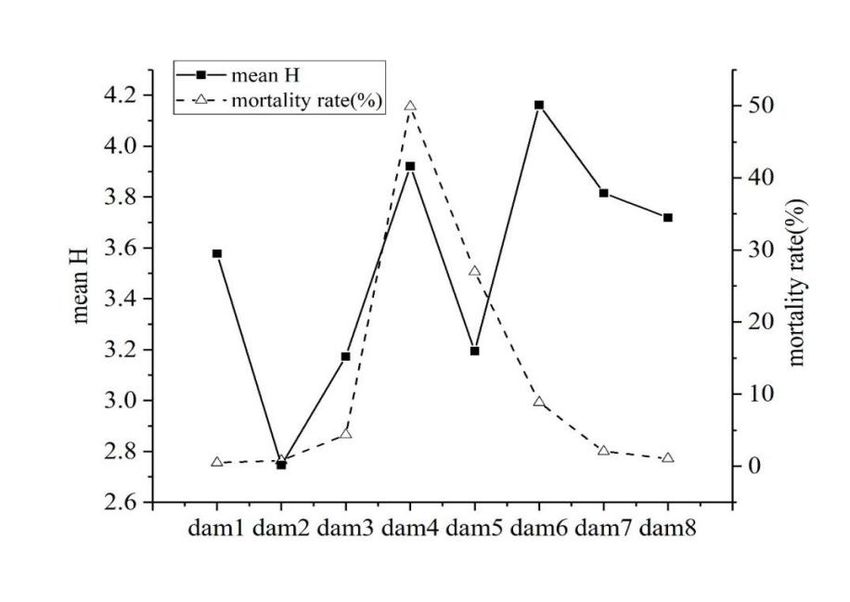
Water 2019, 11, 1359                                                                                    2 of 12

follows: Brown & Graham’s method [7], the RESCDAM method from Finland [8], and the Assaf
method from Canada [9]. In addition, the U.S. Army Corps of Engineer (USACE) and the Australian
National Committee on Large Dams (ANCOLD) also supported the establishment of LIFESim and other
life-loss calculation models [10]. In 1993, Dekay of Colorado University cooperated with McClelland
of the Reclamation Bureau [11] to propose an empirical estimation formula describing the non-linear
relationship between life loss and the population at risk. Most of these studies are based on empirical
regression and data statistics. Although these methods are simple in the calculation, they require
high completeness of data. However, because it is difficult to obtain disaster data accurately, many
simplifications are often made in the process. At the same time, the differences in economic and social
conditions between China and other countries, as well as the discrepancy in the time span of statistical
data, leads to a decline in the accuracy when these models are in the application. Lee [12] estimated
life and economic loss by analyzing the uncertainty of the dam-break flood-related parameters, such as
warning time and people’s risk awareness. Jonkman et al. [13,14] established a set of economic and life
loss evaluation models for a dam-break based on the loss rate of the damaged area and key parameters
of the accident. Meanwhile, Chinese researchers are still in the early stages with no systematic research
results in this field. Li and Zhou [15] offered a preliminary discussion about the main distribution of
life loss caused by broken dams based on the data of eight broken dams in China and put forward the
evaluation model of life loss which was suitable for the actual state of broken dams in China. Sun et
al. [16] estimated the life loss of the dam-break model by the Graham method under the conditions of
simulating the dam-break flood based on Monte-Carlo. Peng et al. [17,18] analyzed the influential
factors of dam-break life loss, and constructed a dam-break life loss assessment model based on the
Bayesian network theory, and applied the model to the Tangjiashan dam-break incident. The problem
of solidification of the membership degree exists in the application of the above models, which cannot
reflect the uncertainty of water resource systems. Variable Fuzzy Sets theory, which is rigorous in
mathematics and unifies the clarity and fuzziness of things, contains a large number of membership
fuzzy set dynamic evaluation models for water resource systems. The Variable Fuzzy evaluation
model corrects the solidification of the membership degree in traditional fuzzy mathematics theory by
using a dynamic membership function.
      In this manuscript, considering the fuzzy uncertainty of the influential factors of a dam-break life
loss and the high non-linearity and correlation between hazards, exposure, and vulnerability factors,
the risk evaluation model of the dam-break life loss in China was established based on the analysis of
the risk formation path and the Variable Fuzzy Sets theory. After evaluating the stability of the results,
the risk ranking of eight dams was carried out and compared with the actual mortality ranking results.
In the form of the above evaluation model and risk ranking results, stakeholders could formulate plans
for dam reinforcement and risk management.

2. Materials and Methods

2.1. Risk Formation Path of Life Loss Caused by Dam-break Flood Based on the Disaster Process
      Life loss risk mainly refers to the deaths caused by water impact, submerging, cold, wound, being
trapped without timely treatment, and other factors in certain flooded regions of the downstream
area, under the conditions of a dam-break. The formation of a dam-break flood is a dynamic process,
which is influenced not only by the natural factors such as a flooded region, water depth, flow velocity,
and sediment concentration, but also by the population distribution, risk awareness, prompt warning
ability, and rescue capacity. Hence, dam-break flood disaster is a complex system with both natural
and social attributes [19,20]. Due to the complexity of the flood characteristics and the variability of
population activities, there is an extremely complex non-linear relationship between the natural factors
and the social factors which will influence dam-break flood disaster and the consequences of life loss
risk. In order to scientifically and accurately identify the influencing factors of dam-break life loss, it is
necessary to analyze the formation path of life loss risk in detail.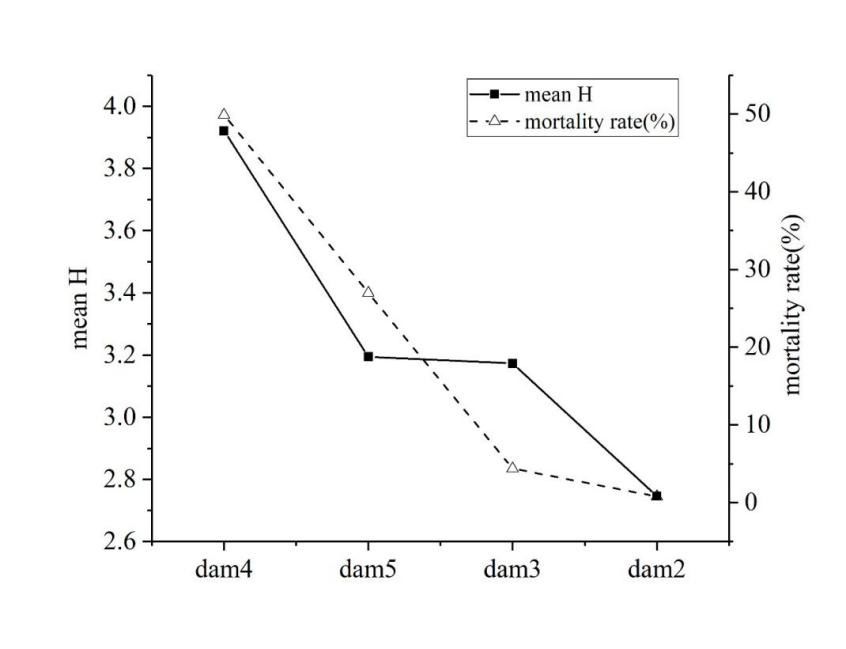
Water 2019, 11, x FOR PEER REVIEW 3 of 12
influencing
Water 2019, 11, factors
1359 of dam-break life loss, it is necessary to analyze the formation path of life loss3 risk of 12
in detail.
The choices faced by the downstream residents to the flood are as follows: moving out of the
Thearea,
disaster choices
goingfaced
up tobythe
theupper
downstream
floors of residents to theorflood
high buildings to theare as follows:
natural highland moving out of the
for evacuation,
disaster area, going up to the upper floors of high buildings or to the natural highland
the formation of risk in this period is mainly affected by the warning time, evacuation routes, escape for evacuation,
the formation
measures, of riskstructure,
building in this period is mainly
and other affected
factors. Afterbythe
thedam-break,
warning time, the evacuation
populationroutes,
at risk escape
in the
measures, building structure, and other factors. After the dam-break,
downstream submerged area travels to highland buildings for emergency evacuation by certain the population at risk in the
downstream submerged area travels to highland buildings for emergency evacuation
transportation, and lives of the population who have not arrived at the safe area before the flood has by certain
transportation,
reached will be and lives of the
threatened. Thepopulation who have not
dynamic distribution arrived
of the at the safe
population areaisbefore
at risk theby
affected flood has
factors
reached will be threatened. The dynamic distribution of the population
such as population density, age composition, and dam breakage time [21]. When the flood comes, at risk is affected by factors
such as population
because density,
of the restriction agespeed
to the composition, and damofbreakage
of the movement timepeople
the affected [21]. When
and the the flood comes,
capacity of the
because of the restriction to the speed of the movement of the affected people
evacuation sites, some people will be exposed to the flood if they are not able to evacuate in time and the capacity of the
or
evacuation sites, some people will be exposed to the flood if they are not able to
the shelter cannot hold. This part of the population is mainly affected by the hydrological parametersevacuate in time or the
shelter
such ascannot hold. water
flow rate, This part of the
depth, population
water is mainly
temperature, affected
and current by rising
the hydrological
rate, which parameters
consequently such
as flow rate, water depth, water temperature, and current rising rate, which
determines the survival chance of the trapped population. Life loss of dam-break results from the consequently determines
the survival chance
comprehensive of of
effect thefloods,
trapped population.
people, Life loss of dam-break
and environment, and its risk results from the
formation comprehensive
path is shown in
effect of1.floods, people, and environment, and its risk formation path is shown in Figure 1.
Figure
Figure 1.
Figure Risk formation
1. Risk formation path
path of
of life-loss
life-loss caused
caused by
by dam-break
dam-break flood.
flood.
2.2. Evaluation
2.2. Evaluation Indicator
Indicator System
System of of Life
Life Loss
Loss Caused
Caused by by Dam-Break
Dam-Break Flood.Flood.
Dam-break flood
Dam-break flood is is aa sudden
sudden short-term
short-term flood, flood, and and dam
dam break
break is is aa low-probability,
low-probability, high-risk
high-risk
catastrophe event. Once the dam collapses, the impact on life
catastrophe event. Once the dam collapses, the impact on life loss in the downstream area cannot loss in the downstream area cannot
be
be accurately estimated [22]. Based on the disaster system theory,
accurately estimated [22]. Based on the disaster system theory, the seriousness of life loss caused by the seriousness of life loss caused
abydam-break
a dam-break is the is result
the result of a combination
of a combination of theof theofrisk
risk of hazards,
hazards, exposure, exposure, and vulnerability
and vulnerability factors
factors [23,24]. This manuscript is a risk pre-evaluation
[23,24]. This manuscript is a risk pre-evaluation under the assumption that the dam under the assumption that the damhas hasalready
already
broken; therefore
broken; therefore when when analyzing
analyzing the the hazardous
hazardous factors factors affecting
affecting the the risk
risk of
of life
life loss,
loss, the
the upstream
upstream
hydrological or engineering safety situation is no longer taken into
hydrological or engineering safety situation is no longer taken into consideration. In the dam-break consideration. In the dam-break
flood disaster
flood disaster system,
system, the the hazardous
hazardous factor factor refers
refers to to the
the level
level ofof the
the floods
floods characteristic
characteristicparameters’
parameters’
threat to
threat to life
life loss,
loss, andand the the vulnerability
vulnerability factor factor refersrefers to to the
the degree
degree of of vulnerability
vulnerability of of the
the affected
affected
population in the face of the flood disaster [25]. The environmental exposure
population in the face of the flood disaster [25]. The environmental exposure factor refers to the extent factor refers to the extent
of exposure to the downstream external environment, which
of exposure to the downstream external environment, which prolongs and enlarges the disaster. prolongs and enlarges the disaster.
Referring to
Referring to the
the evaluation
evaluation models models of of dam-break
dam-break life life loss
loss andand thethe historical
historical statistical
statistical data
data of
of
existing broken dams [26,27], the most important key risk factors affecting
existing broken dams [26,27], the most important key risk factors affecting dam-break life loss include dam-break life loss include
population at
population at risk
risk (P (PRR),), flood
flood intensity
intensity (S (SFF),), time
time of of dam
dam breaking
breaking (T (TBB),), time
time ofof warning
warning (T (TW ), and an
W), and an
understanding of the level of flood severity (U B ). In addition, it can
understanding of the level of flood severity (UB). In addition, it can be seen from the risk formationbe seen from the risk formation path
that other factors, such as dam height (HD ), reservoir capacity (CR ), distance from the dam (LD ), and
self-rescue capability (RC ), directly or indirectly affect the disaster damage of human lives. Therefore,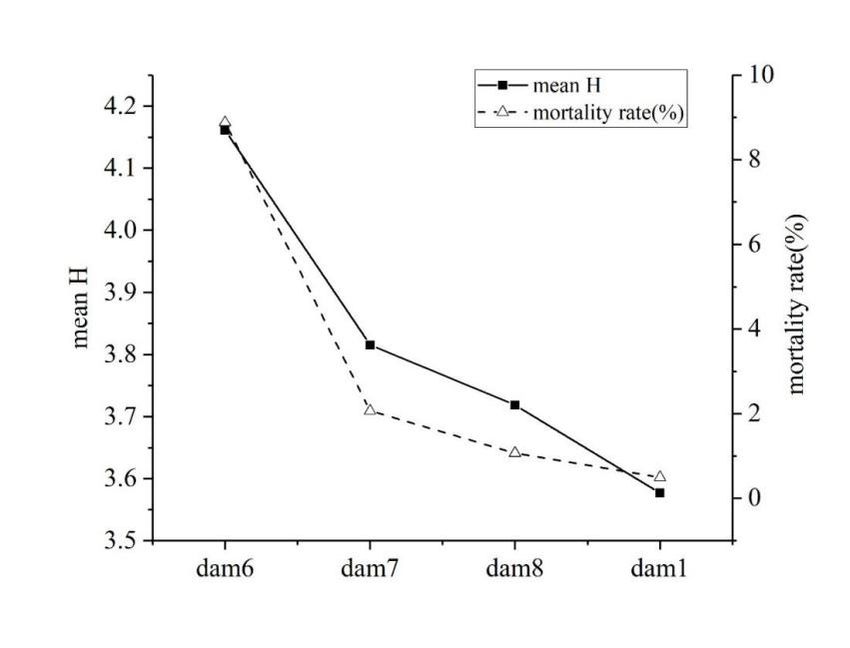
Water 2019, 11, 1359                                                                                                           4 of 12

in this manuscript, the hazard indicators select dam height, reservoir capacity, and flood strength (the
product of water depth and flow velocity) as important factors. The exposure factors can be divided
into natural geography conditions and other external environments. Considering the difficulty in data
acquisition and the influence on the evaluation results, the main factors in the exposure indicator are
the distance from the broken dam, time of warning, and time of breaking. The vulnerability factors
select the population at risk, understanding of flood severity and the self-rescue capability which have
great influence and are easy to calculate. Table 1 shows the evaluation indicator system.

                       Table 1. Risk influencing the indicator of life-loss risk of a dam-break.

  Categories        Indicators           Indicator Meaning                                  Selecting Reason
                                             Dam height                  Dam height and reservoir capacity often determine the
                       X11
                                               HD /(m)                       severity of the flood, affecting the downstream
   Hazards
                                            Dam capacity                 submerged range and duration. With increasing flood
  indicators           X12
                                             CR /(105 m3 )              intensity, the flexibility and stability of human bodies in
     X1
                                           Flood intensity                                  the water get worse.
                       X13
                                              SF /(m2 /s)
                       X21           Distance from dam LD /(km)           The farther away from the dam location, the less the
  Exposure                                Time of warning               population is affected. The prompt warning will win time
  indicators           X22
                                                TW /(h)                  for the downstream evacuation, and the breaking time
     X2                                   Time of breaking               affects the prompt warning capability and the dynamic
                       X23
                                                 TB                             distribution of the downstream population.
                                           Population at risk            The more the population at risk is, the greater the threat
                       X31
 Vulnerability                                PR /(person)                   of life loss in the region is. The more serious the
  indicators                           Understanding level of           understanding of the severity of the flood, the higher the
     X3                X32                   flood severity              probability of escape. Self-rescue capability refers to the
                                                   UB                   escape conditions and methods that may be taken when
                       X33           Self-rescue capability RC /(%)     the dam breaks, expressed as the success rate of the rescue.

2.3. Risk Classification Standard of Life Loss Risk Indicators
     Based on the Graham method and previous research results, combined with the classification
standard of flood disaster and the historical record of broken dams in China, dam-break life loss
indicators and the grading standards of each indicator are shown in Table 2.

                                 Table 2. Grading standards of risk influencing indicators.

                                           Level 1           Level 2             Level 3           Level 4           Level 5
     Categories        Indicators                                                                                  Extremely
                                           Slight            General            Medium             Serious
                                                                                                                    Serious
      Hazards          HD (X11 )            0–10              10–30              30–70             70–100             >100
      indicator        CR (X12 )            1–10             10–102             102 –103           103 –104           >104
         X1            SF (X13 )            0–0.5            0.5–4.6            4.6–12.0          12.0–15.0           >15.0
                        LD (X21 )            >50              50–20              20–10             10–5               5–0
      Exposure          TW (X22 )            >1               1–0.75            0.75–0.5         0.5–0.25           0.25–0
      indicator                                                                                    early             early
         X2                                                                      holiday
                        TB (X23 )         daytime          weeknight                            morning on        morning on
                                                                                  night
                                                                                                 workday           holiday
    Vulnerability       PR (X31 )          1–102             102 –103            103 –104          104 –105          >105
     indicator          UB (X32 )        very clear           clear             common             unclear        very unclear
        X3              RC (X33 )         100–80              80–60               60–40             40–20             20–0
      Note: 1, early morning refers to sleep time (12:00 pm–8:00 am), night refers to the general rest time (8:00 pm–12:00
      pm), and daytime refers to the rest (8:00 am–8:00 pm). 2, qualitative indicator is successively divided as 0–0.2,
      0.2–0.4, 0.4–0.6, 0.6–0.8, 0.8–1, based on expert experience and research results for a reasonable assignment.

2.4. Variable Fuzzy Evaluation Model of Life Loss Risk
   Based on the fuzzy uncertainty of the risk indicator of life loss caused by the dam-break flood, this
manuscript puts forward a comprehensive evaluation model of life loss caused by dam-break flood
Water 2019, 11, 1359 5 of 12
disaster based on the Variable Fuzzy Set theory [28,29], which can be used to calculate and evaluate
the corresponding characteristics of the risk grades of life loss [30]. The steps of comprehensively
evaluating the life loss of dam-break are as follows:
2.4.1. Determining the Matrix of the Sample Eigenvalue
If there are n sample sets of dams to be evaluated, as {X1 , X2 , ···, Xn }, each sample has m indicator
eigenvalues, then the matrix of the sample eigenvalue to be evaluated can be expressed as:
x11 x12 ··· x1n
x21 x22 ··· x2n
X = = xij (1)
.. .. .. ..
. . . .
xm1 xm2 ... xmn
where xij is the measured eigenvalue of Indicator i of Sample j; i = 1, 2, ... , m; j = 1, 2, ... , n.
2.4.2. Determining the Matrix of the Standard Interval of Indicators
If the evaluation interval of the indicators of the samples to be evaluated is divided by c levels, the
matrix of the standard interval of evaluation indicators is:
[a11 , b11 ] [a12 , b12 ] [a1c , b1c ]
···
[a21 , b21 ] [a22 , b22 ] ··· [a2c , b2c ]
Y = = ([aih , bih ]) (2)
.. .. .. ..
. . . .
[a31 , b31 ] [a32 , b32 ] ... [a3c , b3c ]
where [aih , bih ] is the standard interval of Indicators i of Level h, and aih , bih are the upper and lower
limits of the interval.
2.4.3. Determining the Matrix of Standard Interval Point Value
If Mih is the point value when Indicator i in the standard interval [aih , bih ] has a relative membership
degree of 1 to the Level h, Mih can be determined based on the physical meaning and the actual
situation. Since Mih (h = 1, 2, ···, c) is an important parameter, for Level 1 Mi1 = ai1 , for Level c Mic = aic ,
for intermediate level l, when c is odd, Mil = (ail + bil )/2c. The general model of the point value Mih
satisfying the above conditions is
c − h h − 1
Mih = a + b (3)
c − 1 ih c − 1 ih
c+1 ail +bil
where for h = 1, Mi1 = ai1 ; for h = c, Mic = aic , for h = l = 2 , Mil = 2 . By Formula (3), Matrix
M = (Mih ) can be obtained from the Matrix Y.
2.4.4. Determining the Matrix of Relative Membership Degree of the Indicator xij to Each Level
If the evaluation Indicator xij of the sample uj falls into [Mih , Mi(h+1) ], the interval between the
adjacent two levels of the matrix M, Level h and Level (h + 1), then the relative membership degree of
Indicator i to Level h can be calculated by the following formula:
bih − xij
µ ih u j = 0.5 1 + [
bih − Mih , xij ∈ Mih , bih
]
(4)
b − x h i
µih u j = 0.5 1 − b −ih M ij , xij ∈ bih , Mi(h+1)
ih i(h+1)Water 2019, 11, 1359 6 of 12
According to the physical concept, when indicator i is less than Level h and greater than Level
h+1, its relative membership should be equal to 0, that is
µi((h+1)) u j = 0 (5)
When xij falls outside the range of Mi1 and Mic , according to the physical concept:
µi1 u j = µic u j = 1.
2.4.5. Determining the Comprehensive Membership Degree of the Indicator
The comprehensive membership degree of the indicator eigenvalues uj of the evaluation object xij
to the Level h is calculated according to the following formula:
1
vh u j = ) αp h = 1, 2, · · · , c (6)
p
( Pm
i=1 [ωi (1−µih )]
1+ Pm p
i=1 [ωi × µih ]
m
Where ωi is the weighting coefficient of indicator i, satisfying ωi = 1, 0 < ωi < 1. α is the
P
i=1
optimization criterion parameter, α = 1 is the Least One-power criterion, α = 2 is the least-square
criterion; p is the distance parameter, p = 1 is the hamming distance, and p = 2 is the Euclidean distance.
2.4.6. Calculating the Comprehensive Evaluation of Grade Eigenvalue
The comprehensive membership vectors are normalized, and the risk grade eigenvalues of the
evaluation samples are calculated by the level eigenvalue formula:
c
X
H = v0h × h (7)
h=1
where v0h is the normalized relative membership degree, and H is the level eigenvalue of the
evaluation sample.
3. Case Study
There are few records of the collapsed dams and their life loss in China. Based on the present
research data, this manuscript selects eight typical dams for application analysis [26]. The dam-break
accidents occurred from the 1960s to 1990s, and their spatial geographic locations covered the eastern,
western, southern, northern, and central regions of China (as shown in Figure 2). The number of
deaths caused by the dam-break ranged from 10 to 104 . Considering the data authenticity, content
comprehensiveness, and sample representativeness, the eight selected dams could meet the needs of
the risk evaluation. The qualitative indicator is reasonably assigned according to the situation of the
dam-break investigation and the classification of the evaluation indicator. The basic data of the sample
data are shown in Table 3.Water 2019, 11, 1359 7 of 12
Water 2019, 11, x FOR PEER REVIEW 7 of 12
Figure 2. Spatial geographic sketch map of eight dams.
Figure 2. Spatial geographic sketch map of eight dams.
Table 3. Brief Information of 8 Dams.
Table 3. Brief Information of 8 Dams.
Dam Break Dam Capacity/105 Dam Break Population
No. Province Date Dam Type
Samples Height/m m3 Time
Dam at Risk
Dam Break Dam Capacity Population
No. 1 Liujiatai Hebei
Province 1963-08-08
Date Clay
Dam core dam
Type 35.9 405.4 03:55
Break 11,929
Samples Homogeneous Height/m /105 m3 at Risk
2 Hengjiang Guangdong 1970-09-15
earth dam
48.4 787.9 Time
08:00 2500
1963- Clay core
Homogeneous
1 3 Liujiatai
Dongkoumiao Hebei
Zhejiang 1971-06-02
earth dam 35.9
21.5 405.4
25.5 03:55
05:50 11,929
3500
08-08 dam
Homogeneous
4 Lijiatsui Gansu 1973-04-29 Homogene 25.0 11.4 23:30 1034
1970- earth dam
2 5
Hengjiang
Shijiagou
Guangdong
Gansu 1973-08-25
ous earth
Homogeneous 48.4
28.6
787.9
8.6
08:00
05:30
2500
300
09-15 earth dam
dam
Clay heart wall
6 Banqiao Henan 1975-08-08 Homogene 24.5 4920.0 01:00 180,000
1971- dam
3 7
Dongkoumiao
Shimantan
Zhejiang
Henan 1975-08-08
ous earth
Homogeneous 21.5
25.0
25.5
918.0
05:50
00:00
3500
72,422
06-02 earth dam
dam
Concrete face
8 Gouhou Qinghai 1993-08-27 Homogene 71.0 33.0 22:00 30,000
dam
1973-
4 Note:Lijiatsui
The flood intensityGansu
is calculated by ous simulation
the numerical earth 25.0 evolution, 11.4
of flood 23:30
calculated from the product1034
04-29
of the maximum depth and velocity of the section. Thedam population at risk is based on the 1:10,000 topographic map
downstream of the dam, and the population is surveyed within the submerged area.
Homogene
1973-
5 Shijiagou Gansu ous earth 28.6 8.6 05:30 300
08-25
4. Result and Discussions dam
1975- Clay heart
64.1. ModelBanqiao
Calculation Henan 24.5 4920.0 01:00 180,000
08-08 wall dam
Homogene
(1) According to the dam break 1975- survey and data collation, eight dam samples were designed to
7 Shimantan Henan ous earth 25.0 918.0 00:00 72,422
evaluate the eigenvalue matrix X and08-08 the point mapping matrix M:
dam
1993- Concrete
8 Gouhou Qinghai
35.9 48.4 21.5 25 28.6 71.0
24.5 25 33.0 71 22:00 30,000
08-27 face dam
405.4 787.9 25.5 11.4 8.56 4920 918 33
Note: The flood intensity
is calculated by the numerical simulation of flood evolution, calculated
from
5.4 3.3 3.41 20.22 16.6 6.5 3.08 3.6
the product of the maximum
30 depth and velocity of the section. The population at risk is based on the
1:10,000 topographic
6
map downstream 2 of the
0.5dam,0.8 45 10 13 within the
and the population is surveyed
X = 0
submerged area. 0.25 0 0 0.4 0 0 0
0.9
0.3 0.7 0.5 0.7 0.9 0.9 0.5
11929 2500 3500 1034 300 180000 72422 30000
4. Result and Discussions
0.5 0.3 0.7 0.7 0.7 0.7 0.5 0.7
4.1. Model Calculation 30 70 40 5 30 30 20 5
Water 2019, 11, 1359 8 of 12
0 15 50 92.5 150
1 32.5 550 7750 100000
0 1.525 8.3 14.25 30
80 42.5 15 6.25 0
M = 2 0.9375 0.625 0.3125 0
0 0.25 0.5 0.75 1
1 325 5500 77500 500000
0 0.25 0.5 0.75 1
100 75 50 25 0
(2) Determine the indicator weight vector
The weight of the indicator is calculated by the Cloud Model and entropy method [17], and the
weight calculation results are shown in Table 4.
Table 4. Weight sssignment of risk influential indicator.
Indicator X 11 X 12 X 13 X 21 X 22 X 23 X 31 X 32 X 33
Weights ωi 0.0135 0.0225 0.2282 0.0219 0.1722 0.0442 0.3210 0.0424 0.1341
(3) Calculate the comprehensive membership degree and grade eigenvalues
Formula (3) and (4) are used to calculate the relative membership matrix of each sample according
to the evaluation indicator of the eight sample dams. According to the indicator weight and the relative
membership matrix, the range variation of the grade eigenvalues could be obtained by transforming
the parameters in the formula (6). After analyzing the stability of the samples, the correlation degree of
the dams to the life loss level was judged and compared with the actual value. For comparison, we
determined the authenticity and reliability of the results. The results are shown in Table 5.
Table 5. Calculation results of the comprehensive membership degree and grade eigenvalue.
Dam Break Level Eigenvalue H ¯ Loss of Life Mortality
No. Mean H
Samples α = 1, p = 1 α = 1, p = 2 α = 2, p = 1 α = 2, p = 2 (people) Rate (%)
1 Liujiatai 3.5850 3.6129 3.4846 3.6250 3.5769 60 0.50
2 Hengjiang 2.8345 3.0475 2.4262 2.6770 2.7463 20 0.80
3 Dongkoumiao 3.2366 3.2944 3.0324 3.1283 3.1729 154 4.40
4 Lijiatsui 3.8492 3.5430 4.4748 3.8165 3.9209 516 49.90
5 Shijiagou 3.3062 3.2151 3.3087 2.9489 3.1947 81 27.00
6 Banqiao 4.0103 3.9112 4.4435 4.2807 4.1614 15982 8.88
7 Shimantan 3.7725 3.6617 4.0104 3.8170 3.8154 1500 2.07
8 Gouhou 3.6652 3.6091 3.8517 3.7486 3.7186 320 1.07
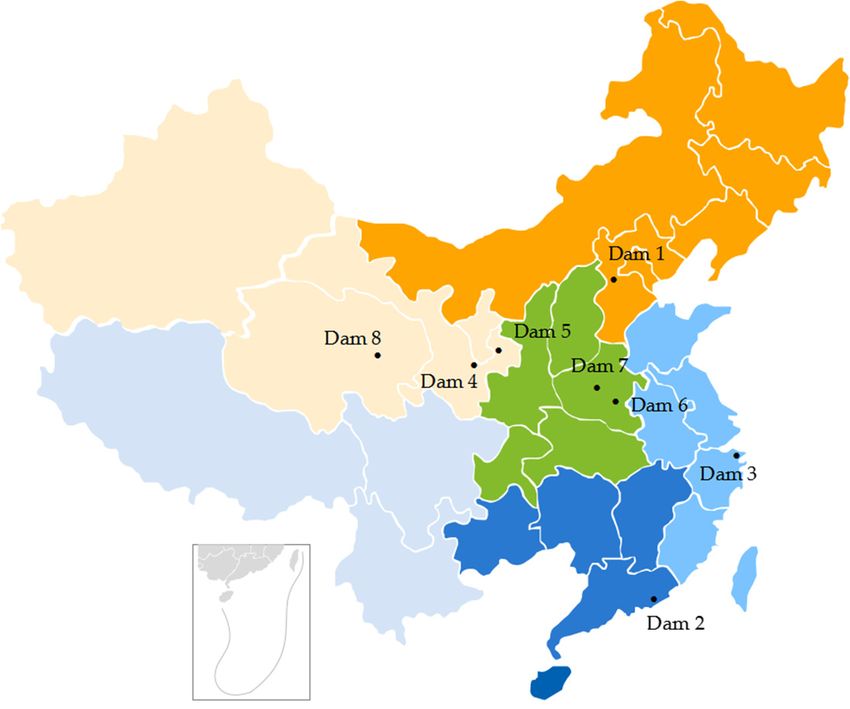
4.2. Results Analysis
According to the calculation results of Table 5, the results of the life loss risk grade of the eight
sample dams are shown in Figure 3.
Mortality rate concerning all the eight reservoirs with varying degrees serves as a straightforward
indicator. It can be seen from the figure that the ranking of the risk of life loss expressed by the level
eigenvalue is basically the same as the ranking trend according to the size of the mortality rate. Dam_1
and dam_6- dam_8 are dams with a large population downstream, so although the mortality rate is
low, the absolute number of deaths is large and the risk level is high. The results of the evaluation
model in this manuscript can take into account the number of risk population very well, which shows
that the evaluation model proposed in this manuscript has good rationality.Water 2019, 11, x FOR PEER REVIEW 9 of 12
4.2. Results Analysis
According to the calculation results of Table 5, the results of the life loss risk grade of the eight
sample dams
Water 2019, are shown in Figure 3.
11, 1359 9 of 12
Figure 3. Sketch map of life-loss risk grade results and mortality rate.
Since everyone’s life is priceless, it is obviously unscientific to rank or evaluate the risk consequences
Figure 3. Sketch map of life-loss risk grade results and mortality rate.
of dams only according to the number of possible deaths or the number of risk population, which
will inevitably reduce the importance of the risk consequences of the dams with small downstream
Mortality rate concerning all the eight reservoirs with varying degrees serves as a
risk populations such as remote small ones. For example, the downstream risk population of dam
straightforward indicator. It can be seen from the figure that the ranking of the risk of life loss
4 is comparably small, only 1034 people. However, because indicators, e.g., flood intensity, time of
expressed by the level eigenvalue is basically the same as the ranking trend according to the size of
warning, self-rescue capability, and other indicators, are relatively dangerous, the actual impact on the
the mortality rate. Dam_1 and dam_6- dam_8 are dams with a large population downstream, so
downstream population is very serious, with a mortality rate of nearly 50%, almost half of the villagers
although the mortality rate is low, the absolute number of deaths is large and the risk level is high.
died in the dam-break flood. The results are consistent with people’s general cognition and the actual
The results of the evaluation model in this manuscript can take into account the number of risk
disastrous consequences.
population very well, which shows that the evaluation model proposed in this manuscript has good
As the direct bearing object of life loss risk evaluation, the population at risk has the largest weight
rationality.
in the comprehensive evaluation, which reaches more than 32% according to Table 4, so its value can
Since everyone's life is priceless, it is obviously unscientific to rank or evaluate the risk
greatly affect the evaluation results. In practical work, if two dams having a great difference in risk
consequences of dams only according to the number of possible deaths or the number of risk
population are sequenced simultaneously, it is obvious that the one with the large population at risk
population, which will inevitably reduce the importance of the risk consequences of the dams with
will attract more attention of stakeholders and the priority will be given to it for risk removal and
small downstream risk populations such as remote small ones. For example, the downstream risk
reinforcement; such comparison and sequencing will be meaningless and misleading. For example, the
population of dam 4 is comparably small, only 1034 people. However, because indicators, e.g., flood
conclusion is unreasonable and unfair that dam 8 (risk population 30,000, mortality 1.07%) has a higher
intensity, time of warning, self-rescue capability, and other indicators, are relatively dangerous, the
risk grade than dam 5 (risk population 300, mortality 27%). China’s dams are widely distributed,
actual impact on the downstream population is very serious, with a mortality rate of nearly 50%,
some in
almost remote
half of themountain
villagersvalleys,
died insome in densely populated
the dam-break flood. The plains.
resultsItarehasconsistent
been shown withthat the risk
people's
population
general has aand
cognition non-linear relationship
the actual disastrouswith the loss of life. The life loss increases rapidly with the
consequences.
increase of the total population when the population
As the direct bearing object of life loss risk evaluation, reaches to the
a certain base. When
population thehas
at risk riskthe
population
largest
weight in the comprehensive evaluation, which reaches more than 32% according to Table 4, so this
reaches a certain number, the mortality rate decreases and the life loss increases slowly. Hence, its
manuscript
value can greatlyconsiders
affect that the downstream
the evaluation risk
results. population,
In practical which
work, is the
if two damsmost directa factor
having to consider
great difference
inand
riskinfluences
population theare
risk of life loss,
sequenced should be divided
simultaneously, into segments.
it is obvious that theBased on the
one with theabove
large analysis
population and
atthe risk
risk willranking
attract ofmorelife attention
loss of the ofeight broken dams,
stakeholders and the this manuscript
priority will besuggests
given to that
it forthe
riskeight dams
removal
should be grouped according to “large population” and “small population”
and reinforcement; such comparison and sequencing will be meaningless and misleading. For using 10,000 people as the
demarcation line as the Figures 4 and 5 show. The figures show that the
example, the conclusion is unreasonable and unfair that dam 8 (risk population 30,000, mortality risk grade ranking is exactly
the same
1.07%) hasasa the mortality
higher ranking
risk grade fordam
than both 5groups. In practical300,
(risk population work, risk population
mortality is regarded
27%). China's damsasare the
basis of risk evaluation of dam-break life loss, which conforms to the routine
widely distributed, some in remote mountain valleys, some in densely populated plains. It has been operation and operational
principle
shown thatofthedecision-makers.
risk population has a non-linear relationship with the loss of life. The life loss increases
rapidly with the increase of the total population when the population reaches to a certain base. When
the risk population reaches a certain number, the mortality rate decreases and the life loss increasessuggests that the eight dams should be grouped according to "large population" and "small
population" using 10,000 people as the demarcation line as the Figures 4 and 5 show. The figures
show that the risk grade ranking is exactly the same as the mortality ranking for both groups. In
practical work, risk population is regarded as the basis of risk evaluation of dam-break life loss, which
conforms to the routine operation and operational principle of decision-makers.
Water 2019, 11, 1359 10 of 12
Figure 4. Sketch map of life-loss risk grade results and mortality rate in the “Large Population” group.
Figure 4. Sketch map of life-loss risk grade results and mortality rate in the “Large Population” group.
Figure 4. Sketch map of life-loss risk grade results and mortality rate in the “Large Population” group.
Figure 5. Sketch map of life-loss risk grade results and mortality rate in the “Small Population” group.
5. Conclusions
Figure 5. Sketch map of life-loss risk grade results and mortality rate in the “Small Population” group.
The risk of dam-break life loss is the result of the combined effect of various factors. Considering
the fuzzy
5. Conclusion uncertainty of the influencing factors of dam-break life loss, the evaluation indicator system
of dam-break life loss is established on the basis of the formation path of life loss caused by the
The risk of dam-break life loss is the result of the combined effect of various factors. Considering
flood. Based on the theory of Variable Fuzzy Sets theory, the risk grade evaluation model of the
the fuzzy uncertainty
Figure 5.life
Sketch of of
thelife-loss
influencing factors of dam-break life loss, the“Small
evaluation indicator system
dam-break lossmap
in China risk grade
is established. results
Eightand
damsmortality
were rate in the
selected Population”
as the basic group.
research objects to
of dam-break life loss is established on the basis of the formation path of life loss caused by the flood.
rank the life loss risk. The results indicate that (1) the result of life loss risk grade ranking is consistent
Based
5.with on the theory of Variable Fuzzy Sets theory, the risk grade evaluation model of the dam-break
Conclusion
the mortality; (2) this method can output reasonable and correct risk grade results when the
downstream
The risk ofpopulation
dam-breakdifference
life loss isisthe
large; and
result of(3)
theincombined
view of the large
effect of difference in theConsidering
various factors. downstream
risk
the population
fuzzy uncertaintydistribution in China,factors
of the influencing it is suggested
of dam-break thatlife
theloss,
riskthe
population
evaluationofindicator
dams should
system be
grouped in a risk evaluation, while 10,000 people were put forward as the basis and
of dam-break life loss is established on the basis of the formation path of life loss caused by the flood.demarcation line
for grouping.
Based The results
on the theory proveFuzzy
of Variable the applicability
Sets theory,ofthethe evaluation
risk model and
grade evaluation demarcation
model criteria of
of the dam-break
risk population. The evaluation of dam risk grade and scientific grouping can help stakeholders to
understand the risk situation of the dam more scientifically and accurately, and help them allocate the
funds for risk elimination and dam reinforcement more reasonably, thereby avoiding the problem of
inclination of dams with larger population at risk, and improving the effectiveness of risk control and
risk management. Finally, it is reasonable and feasible to apply this evaluation model to the life loss
risk evaluation of a dam-break, providing a scientific basis and a new idea for the study of dam-break
life loss and dam risk management.Water 2019, 11, 1359 11 of 12
Author Contributions: Conceptualization-W.L., S.W. and W.G.; Methodology-W.L. and S.W.; Validation-W.G.,
W.L. and Z.L.; Formal analysis-W.L.; Resources-W.G.; Data curation-W.L.; Writing—original draft preparation-W.L.;
Writing—review and editing-W.G. and Z.L.; Visualization-S.W.; Supervision-Z.L.; Project administration-Z.L. and
W.G.; Funding acquisition-Z.L. and W.G.
Funding: This research was funded by the National Natural Science Foundation of China (Grant No. 51679222,
51709239, 51379192), the China Postdoctoral Science Foundation (Grant No. 2018M632809), the Science and
Technology Project of Henan Province of China (Grant No. 182102311070), the Key Project of Science and
Technology Research of Education Department of Henan Province of China (Grant No. 18A570007), and the
Science and Technology Project of Water Conservancy of Henan Province of China (Grant No. GG201813).
Conflicts of Interest: The authors declare no conflict of interest.
References
1. Ge, W.; Li, Z.; Liang, R.Y.; Li, W.; Cai, Y. Methodology for Establishing Risk Criteria for Dams in Developing
Countries, Case Study of China. Water Resour. Manag. 2017, 31, 4063–4074. [CrossRef]
2. Matalas, N.C.; Jr, C.F.N. Ministry of Water Resources of the People’s Republic of China. First National Water
Conservancy Survey Bulletin; China Water Resources and Hydropower Press: Beijing, China, 2013.
3. Li, L.; Wang, R.; Sheng, J. Risk Assessment and Risk Management of Mycotoxins in Food; China Water Resources
and Hydropower Press: Beijing, China, 2006.
4. Fan, Q.; Tian, Z.; Wang, W. Study on risk assessment and early warning of flood-affected areas when a dam
break occurs in a mountain river. Water 2018, 10, 1369. [CrossRef]
5. Li, Z.; Ge, W.; Wang, J.; Li, W. Strategic consideration of dam safety management and risk management in
China. Adv. Water Resour. 2015, 26, 589–595. [CrossRef]
6. Álvarez, M.; Puertas, J.; Peña, E.; Bermúdez, M. Two-dimensional dam-break flood analysis in data-scarce
regions: The case study of Chipembe dam, Mozambique. Water 2017, 9, 432. [CrossRef]
7. Brown, C.A.; Graham, W.J. Assessing the threat to life from dam failure. J. Am. Water Resour. Assoc. 1988, 24,
1303–1309. [CrossRef]
8. Reiter, P. Loss of Life Caused by Dam Failure: The RESCDAM LOL Method and Its Application to Kyrkosjarvi Dam
in Seinajoki; Final Report of PR Water Consulting Ltd.: Helsinki, Finland, 2001.
9. Assaf, H.; Hartford, D. A virtual reality approach to public protection and emergency preparedness planning
in dam safety analysis. Proceedings of Canadian Dam Association, Victoria, BC, Canada, October 2002.
10. Aboelata, M.; Bowles, D.S.; McClelland, D.M. A model for estimating dam failure life loss. In Proceedings of
the Australian Committee on Large Dams Risk Workshop, Launceston, Tasmania, Australia, October 2003.
11. Dekay, M.L.; Mcclelland, G.H. Predicting loss of life in cases of dam failure and flash flood. Insur. Math Econ.
1993, 13, 193–205. [CrossRef]
12. Lee, J.S. Uncertainties in the predicted number of life loss due to the dam breach floods. KSCE J. Civ. Eng.
2003, 7, 81–91. [CrossRef]
13. Jonkman, S.N.; Godfroy, M.; Sebastian, A.; Kolen, B. Brief communication: Post-event analysis of loss of life
due to hurricane Harvey. Nat. Hazards 2018, 18, 1073–1078. [CrossRef]
14. Jonkman, S.N.; Vrijling, J.K.; Vrouwenvelder, A.C.W.M. Methods for the estimation of loss of life due to
floods: a literature review and a proposal for a new method. Nat. Hazards 2008, 46, 353–389. [CrossRef]
15. Li, L.; Zhou, K. Research Status of Life Loss Estimation Methods Caused by Dam Breakdown. Adv. Water
Resour. 2006, 26, 76–80.
16. Sun, Y.; Zhong, D.; Mingchao, L.I.; Ying, L.I. Theory and Application of Loss of Life Risk Analysis for Dam
Break. J. Tianjin Univ., Sci. Technol. 2010, 16, 383–387. [CrossRef]
17. Peng, M.; Zhang, L.M. Analysis of human risks due to dam-break floods—part 1: A new model based on
Bayesian networks. Nat. Hazards 2012, 64, 903–933. [CrossRef]
18. Peng, M.; Zhang, L.M. Analysis of human risks due to dam break floods—part 2: Application to Tangjiashan
landslide dam failure. Nat. Hazards 2012, 64, 1899–1923. [CrossRef]
19. Wu, M.; Ge, W.; Li, Z.; Wu, Z.; Zhang, H.; Li, J.; Pan, Y. Improved Set Pair Analysis and Its Application to
Environmental Impact Evaluation of Dam Break. Water 2019, 11, 82. [CrossRef]
20. Li, Z.; Li, W.; Ge, W. Weight analysis of influencing factors of dam break risk consequences. Nat. Hazard
Earth Syst. 2018, 18, 3355–3362. [CrossRef]Water 2019, 11, 1359 12 of 12
21. Gu, S.; Zheng, X.; Ren, L.; Xie, H.; Huang, Y.; Wei, J.; Shao, S. SWE-SPHysics simulation of dam break flows
at South-Gate Gorges Reservoir. Water 2017, 9, 387. [CrossRef]
22. Ragas, A.M.; Huijbregts, M.A.; Henning De Jong, I.; Leuven, R.S. Uncertainty in environmental risk
assessment: implications for risk-based management of river basins. Integr. Environ. Asses. 2010, 5, 27–37.
[CrossRef]
23. Zhou, Z.Y.; Wang, X.L.; Sun, R.R.; Ao, X.F.; Sun, X.P.; Song, M.R. Study of the comprehensive risk analysis
of dam-break flooding based on the numerical simulation of flood routing. Part II: Model application and
results. Nat. Hazards 2014, 72, 675–700. [CrossRef]
24. Latrubesse, E.M.; Arima, E.Y.; Dunne, T.; Park, E.; Baker, V.R.; D’Horta, F.M.; Wight, C.; Wittmann, F.;
Zuanon, J.; Baker, P.A. Damming the rivers of the Amazon basin. Nature 2017, 546, 363–369. [CrossRef]
25. Dutta, D.; Herath, S.; Musiake, K. A mathematical model for flood loss estimation. J. Hydrol. 2003, 277, 24–49.
[CrossRef]
26. Zhou, K. Research on Analysis Method of Life Loss of Dam Failure; Nanjing Hydraulic Research Institute: Nanjing,
China, 2006.
27. Huang, D.; Yu, Z.; Li, Y.; Han, D.; Zhao, L.; Chu, Q. Calculation method and application of loss of life caused
by dam break in China. Nat. Hazards 2017, 85, 39–57. [CrossRef]
28. Chen, S.Y.; Xue, Z.C.; Li, M.; Zhu, X.P. Variable sets method for urban flood vulnerability assessment.
Sci. China 2013, 56, 3129–3136. [CrossRef]
29. Chen, S.Y.; Xue, Z.C.; Min, L.I. Variable Sets principle and method for flood classification. Sci. China Technol.
Sci. 2013, 56, 2343–2348. [CrossRef]
30. Li, Z.; Li, W.; Ge, W.; Xu, H. Dam Breach Environmental Impact Evaluation Based on Set Pair Analysis-Variable
Fuzzy Set Coupling Model. J. Tianjin U. (Sci. Technol.) 2019, 3, 269–276.
© 2019 by the authors. Licensee MDPI, Basel, Switzerland. This article is an open access
article distributed under the terms and conditions of the Creative Commons Attribution
(CC BY) license (http://creativecommons.org/licenses/by/4.0/).You can also read