Rocket seed (Eruca sativa Mill) gum: physicochemical and comprehensive rheological characterization - SciELO
←
→
Page content transcription
If your browser does not render page correctly, please read the page content below
a
ISSN 0101-2061 (Print)
Food Science and Technology ISSN 1678-457X (Online)
DOI: https://doi.org/10.1590/fst.69620
Rocket seed (Eruca sativa Mill) gum: physicochemical and comprehensive rheological
characterization
Gözde KUTLU1 , Alican AKCICEK1 , Fatih BOZKURT1 , Salih KARASU1 ,
Zeynep Hazal TEKIN-CAKMAK1*
Abstract
This study aimed to determine the physicochemical and rheological characterization of Rocket seed gum (RSG) as a plant-based
natural gum. Moisture, ash, protein, monosaccharide composition, and pH value were determined. Mannose and galactose
were the main monosaccharides with a ratio of (mannose/galactose) 1.52. The absorptions at wavenumber 2855 cm-1 and
2922 cm-1 indicate the presence of galactose and arabinose. RSG showed shear-thinning flow behavior at all concentrations.
The K value of the RSG ranged between 0.24 and 6.31 Pa.sn and significantly increased with increased gum concentration.
Hysteresis area was found 11.53-183.23 and increased with increasing gum concentration. The percentage recovery for the
Gʹ was significantly affected by gum concentrations and found as 42.54-81.20. RSG showed a solid-like structure, the storage
modulus (Gʹ) was higher than the loss modulus (Gʹʹ) in all frequency range. Gʹ and Gʹʹ value increased with increased RSG
concentration. The physicochemical and rheological characterization indicated that RSG could be evaluated as thickeners and
gelling agents in the food industry.
Keywords: rocket seed gum; sugar composition; rheology; FT-IR.
Practical Application: Evaluation of RSG as a novel plant-based natural gum.
1 Introduction
Gums are complex polysaccharides with high molecular Eruca sativa (‘rocket’ in English) is a lifelong herb of the
weight and lots of hydrophilic groups that dissolve in water family Brassicaceae grown in Southern Europe and India.
providing viscosity to aqueous systems (Dabestani et al., 2018). For many years, rocket plants have been used as a food
Starch and its derivatives, galactomannans, carrageenans, ingredient, especially in a salad. Rocket plants contain a wide
pectin, gum arabic, and cellulose are mostly preferable gums range of health-promoting phytochemical compounds such as
that are used as a thickening and gelling agent, texture modifier, polyphenols, fibers, and glucosinolates (Koubaa et al., 2016;
emulsifiers, and stabilizers in the food industry (Wang et al., 2019). Miyazawa et al., 2002; Perry & Metzger, 1980). The seeds
Besides, new plant-based gum obtained from different seeds of rocket plants have been used for oil production in the
such as flaxseed, white mustard seed, yellow mustard seed, industry because of their high oil contents (20.0%) and
fenugreek seed, sage seed, and cress seed has been introduced Erucic acid contents, one of the most sought-after fatty acids
by researchers in the last years (Balke & Diosady, 2000; (Koubaa et al., 2016). Also, the rocket seed has a significant
Brummer et al., 2003; Cui et al., 1993; Cui et al., 1994; amount of total carbohydrate (23.1%), crude fibers (20.4%),
Karazhiyan et al., 2009). Knowledge of the physicochemical, and crude protein (31.0%)-rich (Nail et al., 2017). Thanks to
functional, and rheological properties of a new gum source is their chemical composition, rocket seeds may have reasonable
useful for the evaluation of gum’s behavior in a large number gum content with functional properties. The effect of extraction
of food products and their processing (Koocheki & Razavi, parameters on some technological properties and extraction yield
2009). Many studies have been conducted on the rheological of Eruca sativa seed mucilage was studied (Koocheki et al., 2011).
properties of seed gum solutions such as fenugreek seed gum, However, there is no published study on the comprehensive
basil seed gum, and locust bean seed gum (Dakia et al., 2008; rheological characterization of RSG.
Farahmandfar et al., 2019; Gadkari et al., 2018). Polysaccharides,
the main components of natural gums, consist of more than In this study, the extraction procedure of RSG extracted
one type of monosaccharide (Dickinson, 2003). The difference from Eruca sativa seed and the physicochemical and rheological
in the monosaccharide compositions of gums affects the properties of RSG were investigated. This characterization gives
rheological properties and solubility of gums. Therefore, the potential applications of RSG in the food industry as a natural
monosaccharide compositions should be determined in the food gum. Also, the rheological properties of RSG are important
evaluation of rheological properties and solubility. to improve the functional properties of food.
Received 28 Dec., 2020
Accepted 09 Feb., 2021
1
Yildiz Technical University, Faculty of Chemical and Metallurgical Engineering, Department of Food Engineering, Davutpasa campus, Esenler, Istanbul
*Corresponding author: zhazaltekin@gmail.com
Food Sci. Technol, Campinas, Ahead of Print, 2021 1/11 1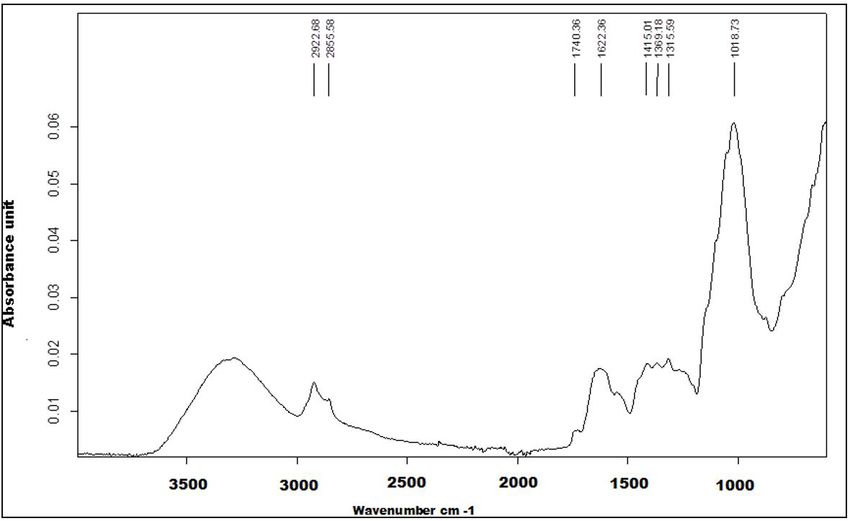
Natural gum from Rocket seed
2 Material and method 2.3 Rheological Analyzes of RSG
Rocket seeds (Eruca Sativa Mill.) were obtained from the local Gum solutions were prepared by dissolving RSG and its
producers. All chemicals used for extraction and purification were different concentrations (0.2-1.0% w/v) in distilled water at
analytical grade obtained from Merck (Darmstadt, Germany). 25 °C and keeping overnight on a mixer to complete hydration.
The study consist of two parts which were the extraction Stress or strain-controlled and temperature-controlled
of RSG and the characterization of RSG’s physicochemical oscillatory rheometer (Anton Paar, MCR 302, Australia) was
(moisture, ash, and protein content, sugar composition) and used to determine rheological properties of the RSG solutions.
rheological properties (the steady shear, dynamic rheological The steady shear properties and time-dependent flow behavior,
properties, 3-ITT, and creep recovery test) of RSG dispersions dynamic shear properties, 3-ITT rheological properties, and
(0.2-1.0%). This study was investigated to get information about creep recovery test were performed.
gum characteristics and stability.
2.4 Steady shear properties and hysteresis area
2.1 RSG Extraction
Steady shear properties of RSG solutions were determined in
The Rocket seed gum was extracted with distilled water the shear rate range of 0-100 (1/s) at 25 °C by using a parallel plate
(water:seed of 20:1) in a magnetic heating stirrer at 80±1.0 °C configuration (diameter 50 mm, gap 0.5 mm). The RSG solutions
for 2 hours. Rocket seeds swell by taking the water, and the gel (approximately 2 g) were placed in the rheometer plate, and the
structures are out of the granules. The solution obtained as a result analysis was carried out after reaching the desired temperature.
of the extraction was added to water to 5000 mL. The solution Each concentration of RSG samples was repeated three times.
was diluted. Rocket seeds, which settle towards the bottom with
The shear stress values of RSG solutions were determined as a
dilution, were taken from the solution by filtration. For the
function of the shear rate. The relation between the shear rate
removal of water from the structure, the separated solution
and shear stress was calculated using the Ostwald de Waale
was concentrated by evaporating in the evaporator at 80 °C for
model and non-linear regression.
3 hours, and dilution was made by adding ethyl alcohol (96%)
in the ratio of 1: 2 (h: h) to the solution. With the addition of
τ = Kγ n (1)
alcohol, the gum in the solution increased upwards due to the
density difference and was collected on the surface. The collected
In Equation 1, τ shows shear stress (Pa), Κ consistency index,
gums were taken from the surface in a container and then left
γ shear rate (1/s), and n the flow behavior index.
in the oven at 50 °C for 1 day to dry. After the drying process,
RSG was milled and sieved using a mesh 18 sifter. The thixotropic properties of RSG were determined by
using hysteresis, which was composed of two steps (upward
2.2 Physicochemical properties of RSG curve and downward curve). Hysteresis area was characterized
by increasing shear rate range from 0.01 s-1 to 100 s-1 in 5 min
Moisture, ash, and protein content of the RSG were analyzed and then to measure the downward curve by reversing shear
according to AOAC Official Methods (Baur & Ensminger, rate range from 100 s-1 to 0.01 s-1 in 5 min at 25 °C.
1977). Determination of sugar composition of the samples
was performed using the HPLC system (Shimadzu, Japan),
equipped with a refractive index detector (RID-10A) and 2.5 Three-Time Interval Thixotropic Test (3-ITT)
CARBOSep CHO-682 Pb column. The column temperature 3-ITT three interval thixotropic test is composed of three
was thermostatted at 80 °C. The chromatographic separation stages. In the first time interval, RSG is analyzed at low shear
was obtained using the isocratic flow of ultrapure water at a rates (0.5 1/s). In the second time interval, RSG is deformed
flow rate of 0.4 ml/min. For each analysis, 10 grams of sample by a high shear rate (150 1/s) to characterize the deformation
was extracted with the addition of 100 mL of distilled water for of RSG. In the third time interval, which is the same condition
4 hours using a mechanic shaker at room temperature. After first time interval, analyses were performed in low shear rates.
that, the extract was filtered through a 0.45 µm membrane filter, Thus, the time of recovery and quantity can be determined
and 20 µL filtrate was injected into the column. The number of (Toker et al., 2015).
sugars was calculated using an external calibration curve, and
the results were expressed as a g/100 g sample. Gі (at the initial state of the product) G0 (after deformation
applied G’ value) and Ge (after recovery of sample G’ value)
A Bruker Tensor 27 spectrometer (Bremen-Germany) equipped values are characterized by deformation equation (Equation 2)
with an ATR accessory with a diamond crystal module was used (Toker et al., 2015):
for obtaining the resistance mechanism by Fourier transform
infrared (FT-IR) spectra of RSG. OPUS program Version 7.2 for
Windows from Bruker Gmbh was used for instrument control ( G³ − G0 )
% Deformation = × 100 (2)
and data acquisition. Wavelength ranged from 3800 to 600 cm−1 G³
at 4 cm−1 resolution accumulating 16 scans per spectra was used
for the FT-IR spectra. The background air spectrum subtracted The recovery degree of RSG was determined by the following
all sample spectra (Singthong et al., 2005). equation (Equation 3),
2 2/11 Food Sci. Technol, Campinas, Ahead of Print, 2021Kutlu et al.
Ge 3 Results and discussion
% Recovery
= × 100 (3)
G³
3.1 Physicochemical Properties
Firstly the linear viscoelastic region was determined with
the amplitude sweep test. Then, the constant and variable shear The chemical compositions of RSG were presented in Table 1.
rate was selected for the 3-ITT. 3-ITT rheological properties of Carbohydrate, protein, moisture, and ash content of RSG were
RSG were determined by constant shear rate and variable shear 80.38%, 5.81%, 10.26%, and 3.55%, respectively. Koocheki et al.
rate. In the first interval, the constant shear rate was applied to (2012) reported that rocket seed mucilage contains 67.97%
the RSG. Then in the second time interval, the variable shear carbohydrate, 9.75% protein, 12.28% moisture, 10% ash, and
rate was applied on RSG. In the third time interval, which is the no fat content. The pH value of RSG was determined as 5.71.
same first time interval, the constant shear rate applied on the Table 1 also indicates the sugar composition of the RSG.
RSG to determined dynamic rheological properties of RSG in
RSG has high carbohydrate (80.38%) and low protein (5.81%)
the second time interval. For this reason, the 3-ITT test gives
contents so that the purification method used when obtaining
information about changing the solid structure of RSG with
gum could be appropriate. While the carbohydrate content
time. For the interpretation of the data which is obtained as a
of RSG (80.38%) was higher than that of guar gum (71.1%),
result of the 3-ITT test, the terms related to recovery should be
it was close to that of Descurainia sophia seed gum (78.23%)
obtained. For this purpose, the second-order structural kinetic
and less than that of Soymida febrifuga exudate gum (88.77%)
model was used and G0, Ge, and k values were calculated. G0
(Bhushette & Annapure, 2018; Busch et al., 2015; Hamidabadi
(the initial values of the storage and loss modulus), Ge (the
Sherahi et al., 2017). The protein content of gum is a crucial
equilibrium storage modulus), k (the rate constant of recovery
parameter determining its emulsion, foaming, and film-
of the sample) and also in this model n=2, are specified by the
forming capacity. RSG has higher protein content, some other
following Equation 4:
natural gums reported from previously published studies by
Bhushette & Annapure (2018) and Hamidabadi Sherahi et al.
G ' − Ge
1− n (2017). When comparing commercial gums, the protein content
=( n − 1) kt + 1 (4) of RSG was higher than that of xanthan gum (2.125%), lower
G0 − Ge
than that of guar gum (8.19%), and close to that of locust bean
gum (5.2-7.4%) (Hamidabadi Sherahi et al., 2017).
Dynamic Shear Properties
When considering the monosaccharide composition,
Dynamic shear properties were determined by parallel plate
RSG has a high level of mannose and galactose. The RSG
configuration. Firstly, the amplitude sweep test was applied in
mannose/galactose ratio was found as 1.52, indicating that
the 0.1-100% strain range to determine the linear viscoelastic
galactose’s substitution level in gum polymers was very high.
region. Then, the frequency sweep test was performed in the
In comparison, the mannose/galactose ratio of RSG is less than
linear viscoelastic region at a frequency of 0.1-10 Hz and in the
that of Descurainia sophia seed gum (1.62) and higher than that
angular velocity range of 0.1-64 (w) to record storage (Gʹ), loss
of fenugreek seed gum (1.1) (Brummer et al., 2003; Hamidabadi
modulus(Gʹʹ) and complex viscosity (n*) values. Dynamic shear Sherahi et al., 2017). The higher level of galactose substitution
properties parameters were determined by using the Power means higher solubility in water.
Law model and non-linear regression (Equation 5 & Equation
6) (Yoo & Rao, 1996): The FTIR spectrum is generally used to identify organic
functional groups in the polysaccharide structure. FTIR spectra of
'
1% RSG solution was shown in Figure 1. Figure 1 demonstrated
G ' = K ' (ω )n (5)
all typical bonds and peaks characteristic of the polysaccharide.
The peaks between 800 cm-1 and 1200 cm-1 showed the highly
G '' = K ' '(ω )n
''
(6) entangled C-C-O, C-OH, C-O-C stretching modes of polymers
structure, and this area was called the “fingerprint” area for
where G’ (Pa) is the storage modulus, G” (Pa) is the loss modulus, carbohydrates (Kačuráková et al., 1998; Razavi et al., 2014). As it
ω is the angular velocity value (1/s), and Κ’, Κ” consistency index can be seen in Figure 1, the band in this range was 1018 cm-1
values and n’, n” represent the flow behavior index values. which represented alkene C-H bend from polysaccharides for
2.6 Statistical analysis
Table 1. The chemical composition of the RSG.
The statistical analysis was carried out using the Statistica
software program (StatSoft, Inc., Tulsa, OK). All the rheological Seed Composition (w/w %) Sugar composition (w/w %)
analyses were conducted in triplicate. The standard deviation and Carbohydrate 80.38±1.13 Galactose 24.49±0.74
mean value were shown. ANOVA was conducted to determine Protein 5.81±0.26 Mannose 37.29±0.32
the differences in rheological parameters of gum solutions. Moisture 10.26±0.19 Glucose 9.89±0.05
Duncan, multiple comparison tests at 95% significance level Ash 3.55±0.04 Fructose 11.59±0.11
was used to determine the effect of gum concentration on Arabinose 13.28±0.23
rheological parameters. *Values are means ± SD of triplicate determination.
Food Sci. Technol, Campinas, Ahead of Print, 2021 3/11 3Natural gum from Rocket seed
Figure 1. FT-IR spectra 1% RSG solution.
the gums (Daoub et al., 2018). The range between 1200 cm-1 and the food industry like locust bean gum (Dakia et al., 2008) and
1500 cm-1 attributed to the coupling of the deformation vibrations xanthan gum (Zhong et al., 2013) showed that shear-thinning
of groups consisting of hydrogen atoms, namely CCH, HCH, COH, rheological behavior.
and HCO (Hamidabadi Sherahi et al., 2017). These bands in this
range were 1315 cm-1, 1369 cm-1, and 1415 cm-1. The absorptions Seed gums such as Chinese quince seed gum (Wang et al., 2019),
at wavenumber 1622 cm-1 and 1740 cm-1 resulted from C-OO Acacia nilotica exudate gum (Bhushette & Annapure, 2017), Albizia
groups and valence vibration. The peaks which were shown in zygia gum (Eddy et al., 2013), Brea plant gum (Bertuzzi et al., 2012),
the 2800-3000 cm-1 wavenumber range was represented the C-H Acanthophyllum bracteatum root gum (Jahanbin et al., 2012),
stretching vibration of CH2 groups, symmetric and asymmetric and gum Kondagogu (Vinod et al., 2008) showed shear-thinning
of the free sugar. These bands in this range were 2855 cm-1 behavior. Hydrogen bonds between molecular and atomic
and 2922 cm-1 indicate the presence of sugars, galactose and groups and high molecular weight are responsible for the shear-
arabinose. The area of FT-IR spectra between 3000 cm-1 and thinning behavior of RSG (Fijan et al., 2007). Shear-thinning
3500 cm-1 indicated O-H stretching modes due to the present hydrocolloids are used to improve and modify food texture
combination of water and polymers, which involved hydrogen during high shear processing conditions like pumping and filling
bonds (Kačuráková et al., 1998). (Vardhanabhuti & Ikeda, 2006). Shear-thinning rheological
behavior is desired for typical gum solutions due to the polymeric
3.2 Steady Shear Rheological Properties of the RSG matrix. High molecular weight and these properties might be one
of the best factors for using gum as a food additive. RSG solutions
Figure 2 shows the flow properties and viscosity of RSG can improve or modify the food industry’s texture as a novel
solutions with different concentrations (0.2–1.0% w/v) over the natural food hydrocolloid due to having shear thinning behavior
range of shear rate from 0.01 to 100 s-1. According to Figure 2a, (Tada et al., 1998).
the samples’ viscosity of RSG decreased with an increase in the
shear rate at all concentrations. The increase in shear rate led Ostwald de Waale model was successfully applied for the
to a breakdown of molecular bonds, and therefore molecules flow behavior of RSG solutions (R2>0.96). Consistency index
became regular and internal friction decreased. As a result, (K) and the flow behavior index (n) value of RSG solutions were
the viscosity of RSG solutions decreased (Wang et al., 2019). calculated by the Power Law model and presented in Table 2.
The decrease in viscosity by an increase in shear rate indicated a The K values and n values were found, respectively 0.24-6.31
non-Newtonian shear-thinning flow behavior for RSG solutions Pa.sn and 0.35 - 0.13. The increase of RSG solution (from 0.2%,
at all concentrations (Figure 2b). The most used hydrocolloids in (w/v) to, 1.0%, (w/v) caused increasing K values and decreased
4 4/11 Food Sci. Technol, Campinas, Ahead of Print, 2021Kutlu et al.
n value. The n values at all concentrations of RSG solutions were (Wang et al., 2019) and fenugreek gum (Gadkari et al., 2018).
less than 1, indicating that showed a non-Newtonian shear- As we can see in Table 2, a 1% concentration of RSG showed a
thinning behavior of the nature of RSG solutions. These results higher K value than the other concentrations of RSG solutions
demonstrated that different concentrations of RSG solutions due to higher solid contents, leading to increased viscosity.
affected the steady shear properties of RSG solutions. Higher solid contents have properties like forming film and
molecular bonds (Maskan & Göğüş, 2000). 0.2% concentration
The strong shear thinning character of higher RSG concentrations of gum solutions showed a lower K value due to having weak
was explained by occurring more hydrogen bonds than the other molecular interactions and low solid contents. The results
concentration of RSG solutions (Wang et al., 2019). This result was indicated that the RSG solution’s pseudo-plastic character
compatible with other studies reported for natural and synthetic was more clearly related to increasing gum concentrations.
gums like locust bean gum (Dakia et al., 2008), xanthan gum, This characteristic provides important applications in the food
asafoetida gum (Saeidy et al., 2019), Chinese quince seed gum industry, as the RSG solutions can display high viscosity and
light mouthfeel in a product.
3.3 Thixotropic behavior of RSG solution
Hysteresis area
The thixotropic behavior of RSG solutions was shown
in Figure 3, which was explained by applied increasing and
decreasing the shear rate at different concentrations.
The thixotropic behavior of RSG solutions is related to the
breakdown of molecular entanglements, which causes decrease
shear stress and viscosity with time (Farahmandfar et al., 2019).
The up curve did not overlap with the down curve. The area
between the up and down curve is called the hysteresis loop,
and it symbolized time-dependent fluid behavior and a wide
of thixotropy (Lee et al., 2009). Hysteresis area indicated the
energy needed to break down the bond at all concentrations of
gum solutions (Koocheki et al., 2013). As can be seen in Table 2,
hysteresis area (%) of RSG solutions were found 10.67%, 13.51%,
15.05%, 17.20%, 18.61%, and hysteresis area (A1-A2) of the RSG
found 11.53, 33.23, 62.11, 121.42, 183.23 respectively for 0.2-1%.
1% concentration of RSG solutions showed the larger hysteresis
area and the stronger thixotropic properties. Besides, these
concentrations showed higher structural strength due to higher
occurred inter and intramolecular interactions; therefore, recovery
of the RSG solutions takes a longer time (Wang et al., 2016).
A similar trend was reported by (Wang et al., 2019). This result
also indicated that the increase in concentrations of the sample
might lead to thixotropic behavior. The lowest RSG solutions
(0.2%) displayed the weakest thixotropic behavior due to low
viscosity and rheological instability. Whereas it also showed
that the highest recovery of the RSG solutions, which means
Figure 2. Flow behavior properties and viscosity versus the shear that after deformation, returned to its original structure quickly
rate at different concentrations of RSG solutions. a. shear rate versus than the other concentrations. Similar results were obtained
appearance viscosity, b. shear rate versus shear stress. by (Razmkhah et al., 2016; Wang et al., 2019). When the RSG’s
Table 2. Ostwald de Waele parameters and hysteresis area of RSG at a different concentration
Concentration Ostwald de Waele Parameters Time-dependent Flow
(%w/v) K (Pa.sn) n R2 Hysteresis Area (A1-A2) Hysteresis Area (%)
0.2 0.24±0.01e 0.35±0.005a 0.99 11.53e 10.67e
0.4 1.16±0.09d 0.21±0.006b 0.99 33.23d
13.51d
0.6 2.42±0.02c 0.17±0.001c 0.98 62.11c
15.05c
0.8 4.20±0.12b 0.14±0.001d 0.97 121.42 b
17.20b
1.0 6.31±0.00a 0.13±0.002e 0.96 183.23 a
18.61a
*Different letters in the same column indicate significant differences among samples (P < 0.05).
Food Sci. Technol, Campinas, Ahead of Print, 2021 5/11 5Natural gum from Rocket seed
Figure 3. Time-dependent flow behavior of RSG solutions.
attention exceeded 0.4%, the up and down curve much prominent 104%-55% decreased with increasing concentrations of the RSG.
and did not overlap, which indicated that the structure of These results indicated that minimum and maximum recovery
RSG solutions changed by mechanical stress and energy loss. and deformation were obtained at 1% and 0.2% concentration
A similar result was obtained by other studies (Fathi et al., 2016; of the RSG solutions for storage and loss modulus, respectively.
Wang et al., 2019). According to thixotropic properties of the RSG
Also, k' and k" values known as thixotropic values were
solutions, the RSG solutions can be used in the food industry
found from 9.3-12.85 and 7.82–13.64 1/s, respectively, and
due to having structural recovery properties.
decreased with increasing gum concentrations. Higher thixotropic
rate values meaning a higher tendency to structural recovery
Three Interval Thixotropic Time Test (3-ITT) (Akcicek & Karasu, 2018). According to the results, 0.2%
3-ITT is another method to describe the thixotropic concentrations of the RSG solutions’ concentrations higher tend
properties of food emulsions and dispersions subjected to very to recover than the other concentrations. These results indicated
high sudden deformation. In the first time interval, lower shear that RSG solutions could be used in the food industry due to
rates were applied to the RSG solutions at rest. A higher shear providing structural recovery advantages during food process
rate is applied to samples in the second time interval and caused conditions like pumping and filling (Wang et al., 2019).
structural decomposition of the RSG solutions. In the third time
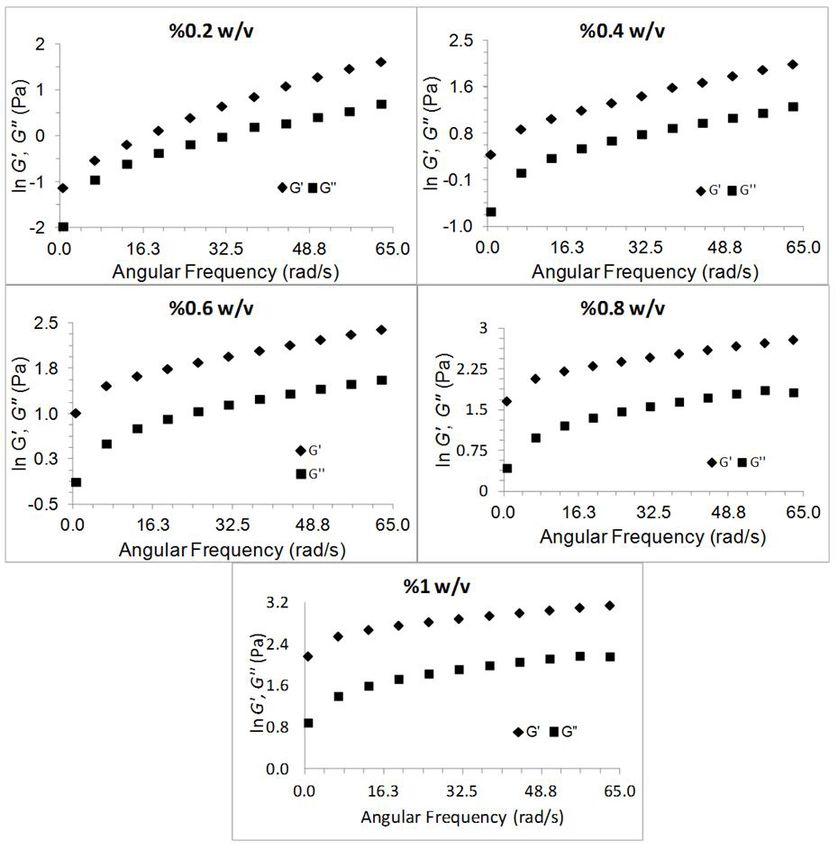
interval, the recovery of samples starts (Toker et al., 2015). In the 3.4 Dynamic shear properties
food industry, applied deformations are not always within the
linear viscoelastic region. The 3-ITT simulates sudden and non- Figure 5 showed the viscoelastic behavior of the RSG
linear deformation of RSG solutions. Therefore, this test gives solutions. G' and G" values of the samples at all concentrations
information about the structural recovery of RSG solutions. increased with the increase of angular velocity. Similar behavior
was reported for locust bean gum (Dakia et al., 2008) Hymenaea
As shown in Figure 4, the RSG solutions structural recovery courbaril L. gum seed (Hernández-Morales et al., 2018). Figure 5
tendency decreased with increasing concentrations of the RSG demonstrated that the RSG solutions at all concentrations G' were
solutions. As we mentioned in the thixotropic properties of the higher than Gʹʹ indicating that RSG showed solid viscoelastic
RSG solutions, the lowest concentrations (0.2%) demonstrated character like gel behavior with all in frequency ranges.
the lowest structural recovery. The highest concentrations (1%)
showed that the lowest structural recovery means that after A solid viscoelastic character is the desired rheological
deformation, it could not be returned to the original structure behavior for gum solutions. Such results are compatible with other
fast due to high viscosity and strength structural molecular hydrocolloids like L. perfoliatum seed gum gel (Hesarinejad et al., 2014),
interactions (Razmkhah et al., 2016; Wang et al., 2019). purified basil seed gum (Farahmandfar et al., 2019), cress seed
gum (Razmkhah et al., 2017) basil seed gum (Rafe et al., 2012)
Rheological data of the 3-ITT were fitted by the second- Chinese quince seed gum (Wang et al., 2019), and A.homolacarpum
order structural model to determine structural deformation and seed gum (Anvari et al., 2016). An increase in concentrations
recovery ratio by using Equation 4 and Equation 5 and given
of the RSG solutions led to an increase in Gʹ and Gʹʹ (Table 4).
in Table 3. R2 value higher than 0.94, meaning that this model
was successfully fitted to rheological data. The percentage of A similar result (Farahmandfar et al., 2019; Naji-
deformation for storage and loss modulus respectively ranged Tabasi & Razavi, 2017). This increase could be explained by
between 50.28%-70.27%, 26.80%-55.12% increased with increasing the formation of a complex molecular structure at higher RSG
gum concentrations. Also, the percentage of recovery for storage concentrations (Hesarinejad et al., 2014). The rise in G' and G"
and loss modulus, respectively ranged between 81.2%-42% and with an increase in concentrations of the RSG solutions can be
6 6/11 Food Sci. Technol, Campinas, Ahead of Print, 2021Kutlu et al.
Figure 4. 3-ITT rheological properties of RSG solutions.
Table 3. Second-order structural model parameters
Gʹ Gʹʹ The percentage of Deformation The percentage of Recovery
Concentration (%)
R k (s-1) R k (s-1)×1000 Gʹ Gʹʹ Ge/ G0 Ge/G0
0.2 0.974 12.850a 0.9761 13.642a 50.28e 26.80e 81.205a 104.101a
0.4 0.973 11.910b 0.9493 11.602b 62.63d 40.77d 66.386b 89.353b
0.6 0.971 11.499c 0.9655 10.697c 63.87c 43.55c 49.953c 68.801c
0.8 0.967 10.090d 0.9627 9.949d 65.24b 48.63b 46.061d 60.487d
1.0 0.968 9.300e 0.9573 7.822e 70.27a 55.12a 42.540e 55.054e
*Different letters in the same column indicate significant differences among samples (P < 0.05).
Food Sci. Technol, Campinas, Ahead of Print, 2021 7/11 7Natural gum from Rocket seed
Figure 5. Dynamic rheological properties of RSG solutions.
explained by intermolecular networks between RSG and water values were higher than the K" (0.11-2.15) values. These results
molecules (Farahmandfar et al., 2019). A low concentration indicated that the solid character index of the samples was
of RSG solution (0.2%) also had elastic behavior. The reasons higher than the liquid character index. It means that all of the
could be the high molecular weight and high branching degree samples show solid viscoelastic behavior at all concentrations
of RSG (Wang et al., 2019). of the RSG solutions. n' and n" values of the samples indicating
Non-linear regression analyses were applied to data which the nature and elastic properties of the gels. Besides, n'=0 means
is obtained from the frequency sweep test to calculate K', K", n', that a covalent gel while n' > 0 for a physical gel. A higher n'
n", and R2. R2 was found to be higher than 0.95, which means value means that the RSG solutions act a viscous gel while n'
that the Power Law model was fitted and compatible with and n " value near to zero means that G' and G" don’t change
our finding results. At all concentration levels, K' (0.03-8.22) with frequency (Balaghi et al., 2011).
8 8/11 Food Sci. Technol, Campinas, Ahead of Print, 2021Kutlu et al.
Table 4. Parameters of Power-Law function describing of storage, loss modulus, and complex viscosity
G’=K’(ω)n G”=K”(ω)n” η*=K›(ω)n’-1
Concentration (%)
K’ (Pa) n’ R2 K’ ‘ (Pa) n” R2 K*(Pa) n* R2
0.2 0.030e 0.929a 0.990 0.115e 0.630a 0.955 0.049e 1.122a 0.990
0.4 0.517d 0.636b 0.973 0.386d 0.494b 0.983 0.628d 0.791b 0.979
0.6 1.715c 0.426c 0.970 0.717c 0.433c 0.988 1.850c 0.606c 0.980
0.8 4.330b 0.304d 0.975 1.292b 0.385d 0.990 4.489b 0.470d 0.979
1.0 8.224a 0.249e 0.982 2.159a 0.346e 0.992 8.460a 0.320e 0.984
*Different letters in the same column indicate significant differences among samples (P < 0.05)
All of the RSG solutions showed gel-like due to the positive References
slopes (n were positive (n'= 0.24-0.92 and n"= 0.34-0.63). According
Akcicek, A., & Karasu, S. (2018). Utilization of cold pressed chia seed
to the information above, the lowest n' value (0.24) obtained at oil waste in a low-fat salad dressing as natural fat replacer. Journal of
1% concentration of the RSG solutions (Table 4) indicates that Food Process Engineering, 41(5), e12694. http://dx.doi.org/10.1111/
the result of storage modulus is displayed to create a more stable jfpe.12694.
gel than the other concentrations of the RSG solutions. Besides, Anvari, M., Tabarsa, M., Cao, R., You, S., Joyner, H. S., Behnam,
0.2% concentrations of the RSG solutions showed the lowest G', S., & Rezaei, M. (2016). Compositional characterization and
and G" means that ability to create an intertwined network is a rheological properties of an anionic gum from Alyssum homolocarpum
weakness. In contrast, 1% concentration of the RSG solutions seeds. Food Hydrocolloids, 52, 766-773. http://dx.doi.org/10.1016/j.
showed the highest G' is related to form stronger, more elastic foodhyd.2015.07.030.
network structure and molecular interactions. A similar result was Balaghi, S., Mohammadifar, M. A., Zargaraan, A., Gavlighi, H.
obtained by (Naji-Tabasi & Razavi, 2017; Razmkhah et al., 2016). A., & Mohammadi, M. (2011). Compositional analysis and rheological
characterization of gum tragacanth exudates from six species of
The increase in frequency led to decreased complex Iranian Astragalus. Food Hydrocolloids, 25(7), 1775-1784. http://
viscosity of the RSG solutions. Therefore it can be indicated that dx.doi.org/10.1016/j.foodhyd.2011.04.003.
dispersions of hydrocolloid exhibited Non-newtonian behavior
Balke, D. T., & Diosady, L. L. (2000). Rapid aqueous extraction of
with pseudo-plastic character. A similar result was obtained by mucilage from whole white mustard seed. Food Research International,
(Rafe et al., 2013; Razmkhah et al., 2016). Nonlinear regression 33(5), 347-356. http://dx.doi.org/10.1016/S0963-9969(00)00055-7.
analyses were applied to data, and K* and n* value (R2= 0.97) were Baur, F. J., & Ensminger, L. G. (1977). The Association of Official
found between 0.04-8.46 and 0.32-1.12, respectively (Table 4). Analytical Chemists (AOAC). Journal of the American Oil Chemists’
Besides, increasing concentrations of the RSG caused an increase Society, 54(4), 171-172. http://dx.doi.org/10.1007/BF02670789.
in complex viscosity (Table 4). At high frequency, the applied Bertuzzi, M. A., Slavutsky, A. M., & Armada, M. (2012). Physicochemical
time of frequency was not sufficient for the destruction of the characterisation of the hydrocolloid from Brea tree (Cercidium
inter and intramolecular bonds. After the rearrangement of praecox). International Journal of Food Science & Technology, 47(4),
the molecule, therefore complex viscosity of the RSG solutions 768-775. http://dx.doi.org/10.1111/j.1365-2621.2011.02907.x.
decreased. These results showed that RSG solutions could be Bhushette, P. R., & Annapure, U. S. (2017). Comparative study of Acacia
utilized as a good stabilizer and thickener in the food industry nilotica exudate gum and acacia gum. International Journal of
(Hesarinejad et al., 2014). Biological Macromolecules, 102, 266-271. http://dx.doi.org/10.1016/j.
ijbiomac.2017.03.178. PMid:28390831.
4 Conclusion Bhushette, P. R., & Annapure, U. S. (2018). Physicochemical, functional
and rheological investigation of Soymida febrifuga exudate gum.
In conclusion, RSG had high carbohydrate (80.38%) and International Journal of Biological Macromolecules, 111, 1116-1123.
low protein (5.81%) contents. Sugar analysis results showed that http://dx.doi.org/10.1016/j.ijbiomac.2018.01.117. PMid:29366895.
RSG was rich in mannose and galactose level. The mannose/
Brummer, Y., Cui, W., & Wang, Q. (2003). Extraction, purification
galactose ratio of the RSG (1.52) indicated that galactose’s and physicochemical characterization of fenugreek gum. Food
substitution level in gum polymers was very high. The higher Hydrocolloids, 17(3), 229-236. http://dx.doi.org/10.1016/S0268-
level of galactose substitution exhibited higher solubility in water. 005X(02)00054-1.
FTIR spectrum of 1% RSG solution indicated the existence of Busch, V. M., Kolender, A. A., Santagapita, P. R., & Buera, M. P. (2015).
carboxyl, hydroxyl and glycoside bands. RSG solutions showed Vinal gum, a galactomannan from Prosopis ruscifolia seeds:
shear thinning, time-dependent, and viscoelastic characteristics Physicochemical characterization. Food Hydrocolloids, 51, 495-502.
at low concentration (0.2%). 3-ITT test was applied to determine http://dx.doi.org/10.1016/j.foodhyd.2015.04.035.
the recovery characteristic of RSG under sudden and high Cui, W., Eskin, N. A. M., & Biliaderis, C. G. (1993). Chemical and
deformation. RSG showed recovery at all concentrations. physical properties of yellow mustard (Sinapis alba L.) mucilage.
This study suggested that RSG could be used in a variety of Food Chemistry, 46(2), 169-176. http://dx.doi.org/10.1016/0308-
applications in the food industry as thickeners, emulsifiers, and 8146(93)90032-B.
gelling agents depending on its physicochemical and rheological Cui, W., Mazza, G., Oomah, B. D., & Biliaderis, C. G. (1994). Optimization
characterization. of an Aqueous Extraction Process for Flaxseed Gum by Response
Food Sci. Technol, Campinas, Ahead of Print, 2021 9/11 9Natural gum from Rocket seed
Surface Methodology. Lebensmittel-Wissenschaft + Technologie, study of xylooligosaccharides. Journal of the Science of Food and
27(4), 363-369. http://dx.doi.org/10.1006/fstl.1994.1074. Agriculture, 77(1), 38-44. http://dx.doi.org/10.1002/(SICI)1097-
Dabestani, M., Kadkhodaee, R., Phillips, G. O., & Abbasi, S. (2018). 0010(199805)77:13.0.CO;2-5.
Persian gum: A comprehensive review on its physicochemical and Karazhiyan, H., Razavi, S. M. A., Phillips, G. O., Fang, Y., Al-Assaf,
functional properties. Food Hydrocolloids, 78, 92-99. http://dx.doi. S., Nishinari, K., & Farhoosh, R. (2009). Rheological properties
org/10.1016/j.foodhyd.2017.06.006. of Lepidium sativum seed extract as a function of concentration,
Dakia, P., Blecker, C., Robert, C., Wathelet, B., & Paquot, M. (2008). temperature and time. Food Hydrocolloids, 23(8), 2062-2068. http://
Composition and physicochemical properties of locust bean gum dx.doi.org/10.1016/j.foodhyd.2009.03.019.
extracted from whole seeds by acid or water dehulling pre-treatment. Koocheki, A., Razavi, S., & Hesarinejad, M. A. (2011). Effect of Extraction
Food Hydrocolloids, 22(5), 807-818. http://dx.doi.org/10.1016/j. Procedures on Functional Properties of Eruca sativa Seed Mucilage.
foodhyd.2007.03.007. Food Biophysics, 7. http://dx.doi.org/10.1007/s11483-011-9245-9.
Daoub, R. M. A., Elmubarak, A. H., Misran, M., Hassan, E. A., & Osman, Koocheki, A., & Razavi, S. M. A. (2009). Effect of concentration and
M. E. (2018). Characterization and functional properties of some temperature on flow properties of alyssum homolocarpum seed
natural Acacia gums. Journal of the Saudi Society of Agricultural gum solutions: assessment of time dependency and Thixotropy.
Sciences, 17(3), 241-249. http://dx.doi.org/10.1016/j.jssas.2016.05.002. Food Biophysics, 4(4), 353-364. http://dx.doi.org/10.1007/s11483-
Dickinson, E. (2003). Hydrocolloids at interfaces and the influence 009-9134-7.
on the properties of dispersed systems. Food Hydrocolloids, 17(1), Koocheki, A., Razavi, S. M. A., & Hesarinejad, M. A. (2012). Effect of
25-39. http://dx.doi.org/10.1016/S0268-005X(01)00120-5. Extraction Procedures on Functional Properties of Eruca sativa Seed
Eddy, N., Abechi, S., Ameh, P., & Ebenso, E. (2013). GCMS, FTIR, Mucilage. Food Biophysics, 7(1), 84-92. http://dx.doi.org/10.1007/
SEM, physiochemical and rheological studies on Albizia zygia gum. s11483-011-9245-9.
Walailak Journal of Science and Technology, 10, 247-265. http:// Koocheki, A., Taherian, A. R., & Bostan, A. (2013). Studies on the
dx.doi.org/10.2004/wjst.v10i3.295. steady shear flow behavior and functional properties of Lepidium
Farahmandfar, R., Salahi, M. R., & Asnaashari, M. (2019). Flow behavior, perfoliatum seed gum. Food Research International, 50(1), 446-456.
thixotropy, and dynamic viscoelasticity of ethanolic purified basil http://dx.doi.org/10.1016/j.foodres.2011.05.002.
(Ocimum bacilicum L.) seed gum solutions during thermal treatment. Koubaa, M., Mhemdi, H., Sanlaville, Q., & Vorobiev, E. (2016). Recovery
Food Science & Nutrition, 7(5), 1623-1633. http://dx.doi.org/10.1002/ of Oil, Erucic Acid, and Phenolic Compounds from Rapeseed and
fsn3.992. PMid:31139375. Rocket Seeds. Chemical Engineering & Technology, 39(8), 1431-1437.
Fathi, M., Mohebbi, M., & Koocheki, A. (2016). Introducing Prunus http://dx.doi.org/10.1002/ceat.201500444.
cerasus gum exudates: Chemical structure, molecular weight, and Lee, C. H., Moturi, V., & Lee, Y. (2009). Thixotropic property in
rheological properties. Food Hydrocolloids, 61, 946-955. http:// pharmaceutical formulations. Journal of Controlled Release, 136(2),
dx.doi.org/10.1016/j.foodhyd.2016.07.004. 88-98. http://dx.doi.org/10.1016/j.jconrel.2009.02.013. PMid:19250955.
Fijan, R., Šostar-Turk, S., & Lapasin, R. (2007). Rheological study of Maskan, M., & Göğüş, F. (2000). Effect of sugar on the rheological
interactions between non-ionic surfactants and polysaccharide properties of sunflower oil–water emulsions. Journal of Food Engineering,
thickeners used in textile printing. Carbohydrate Polymers, 68(4), 43(3), 173-177. http://dx.doi.org/10.1016/S0260-8774(99)00147-8.
708-717. http://dx.doi.org/10.1016/j.carbpol.2006.08.006.
Miyazawa, M., Maehara, T., & Kurose, K. (2002). Composition of the
Gadkari, P. V., Tu, S., Chiyarda, K., Reaney, M. J. T., & Ghosh, S. (2018). essential oil from the leaves of Eruca sativa. Flavour and Fragrance
Rheological characterization of fenugreek gum and comparison Journal, 17(3), 187-190. http://dx.doi.org/10.1002/ffj.1079.
with other galactomannans. International Journal of Biological
Nail, T., Ali, M., & Salim, E. (2017). Phytochemical studies on Sudanese
Macromolecules, 119, 486-495. http://dx.doi.org/10.1016/j.
rocket (Eruca sativa) seeds and oil constituents. Am J Phytomed
ijbiomac.2018.07.108. PMid:30031082.
Clinic Therapeut, 5(1), 1-5.
Hamidabadi Sherahi, M., Fathi, M., Zhandari, F., Hashemi, S. M.
B., & Rashidi, A. (2017). Structural characterization and physicochemical Naji-Tabasi, S., & Razavi, S. M. A. (2017). New studies on basil
properties of Descurainia sophia seed gum. Food Hydrocolloids, 66, (Ocimum bacilicum L.) seed gum: Part III – Steady and dynamic
82-89. http://dx.doi.org/10.1016/j.foodhyd.2016.12.010. shear rheology. Food Hydrocolloids, 67, 243-250. http://dx.doi.
org/10.1016/j.foodhyd.2015.12.020.
Hernández-Morales, M. Á., Maldonado-Astudillo, Y. I., Jiménez-
Hernández, J., Salazar, R., Ramírez-Sucre, M. O., Ibarz, A., Utrilla- Perry, L. M., & Metzger, J. (1980). Medicinal plants of East and Southeast Asia:
Coello, R. G., & Ortuño-Pineda, C. (2018). Physicochemical and attributed properties and uses. Cambridge, Massachusetts: MIT Press.
rheological properties of gum seed and pulp from Hymenaea Rafe, A., Razavi, S., & Farhoosh, R. (2013). Rheology and microstructure
courbaril L. CYTA: Journal of Food, 16(1), 986-994. http://dx.doi. of basil seed gum and? -lactoglobulin mixed gels. Food Hydrocolloids,
org/10.1080/19476337.2018.1513955. 30(1), 134-142. http://dx.doi.org/10.1016/j.foodhyd.2012.05.016.
Hesarinejad, M. A., Koocheki, A., & Razavi, S. M. A. (2014). Dynamic Rafe, A., Razavi, S. M. A., & Khan, S. (2012). Rheological and structural
rheological properties of Lepidium perfoliatum seed gum: Effect of properties of β-lactoglobulin and basil seed gum mixture: Effect of
concentration, temperature and heating/cooling rate. Food Hydrocolloids, heating rate. Food Research International, 49(1), 32-38. http://dx.doi.
35, 583-589. http://dx.doi.org/10.1016/j.foodhyd.2013.07.017. org/10.1016/j.foodres.2012.07.017.
Jahanbin, K., Moini, S., Gohari, A. R., Emam-Djomeh, Z., & Masi, P. Razavi, S. M. A., Cui, S. W., Guo, Q., & Ding, H. (2014). Some
(2012). Isolation, purification and characterization of a new gum physicochemical properties of sage (Salvia macrosiphon) seed
from Acanthophyllum bracteatum roots. Food Hydrocolloids, 27(1), gum. Food Hydrocolloids, 35, 453-462. http://dx.doi.org/10.1016/j.
14-21. http://dx.doi.org/10.1016/j.foodhyd.2011.09.007. foodhyd.2013.06.022.
Kačuráková, M., Belton, P. S., Wilson, R. H., Hirsch, J., & Ebringerová, Razmkhah, S., Razavi, S. M. A., & Mohammadifar, M. A. (2016).
A. (1998). Hydration properties of xylan-type structures: an FTIR Purification of cress seed (Lepidium sativum) gum: A comprehensive
10 10/11 Food Sci. Technol, Campinas, Ahead of Print, 2021Kutlu et al. rheological study. Food Hydrocolloids, 61, 358-368. http://dx.doi. Food Hydrocolloids, 20(6), 885-891. http://dx.doi.org/10.1016/j. org/10.1016/j.foodhyd.2016.05.035. foodhyd.2005.09.002. Razmkhah, S., Razavi, S. M. A., & Mohammadifar, M. A. (2017). Dilute Vinod, V. T. P., Sashidhar, R. B., Sarma, V. U. M., & Vijaya Saradhi, U. solution, flow behavior, thixotropy and viscoelastic characterization V. R. (2008). Compositional Analysis and Rheological Properties of of cress seed (Lepidium sativum) gum fractions. Food Hydrocolloids, Gum Kondagogu (Cochlospermum gossypium): A Tree Gum from 63, 404-413. http://dx.doi.org/10.1016/j.foodhyd.2016.09.030. India. Journal of Agricultural and Food Chemistry, 56(6), 2199-2207. Saeidy, S., Nasirpour, A., Djelveh, G., Ursu, A.-V., Delattre, C., Pierre, http://dx.doi.org/10.1021/jf072766p. PMid:18318494. G., & Michaud, P. (2019). Emulsion properties of Asafoetida gum: Wang, L., Liu, H.-M., Zhu, C.-Y., Xie, A.-J., Ma, B.-J., & Zhang, P.-Z. Effect of oil concentration on stability and rheological properties. (2019). Chinese quince seed gum: Flow behaviour, thixotropy and Colloids and Surfaces. A, Physicochemical and Engineering Aspects, viscoelasticity. Carbohydrate Polymers, 209, 230-238. http://dx.doi. 560, 114-121. http://dx.doi.org/10.1016/j.colsurfa.2018.10.018. org/10.1016/j.carbpol.2018.12.101. PMid:30732804. Singthong, J., Ningsanond, S., Cui, S. W., & Douglas Goff, H. (2005). Wang, S., Tang, H., Guo, J., & Wang, K. (2016). Effect of pH on the Extraction and physicochemical characterization of Krueo Ma Noy rheological properties of borate crosslinked hydroxypropyl guar pectin. Food Hydrocolloids, 19(5), 793-801. http://dx.doi.org/10.1016/j. gum hydrogel and hydroxypropyl guar gum. Carbohydrate Polymers, foodhyd.2004.09.007. 147, 455-463. http://dx.doi.org/10.1016/j.carbpol.2016.04.029. Tada, T., Matsumoto, T., & Masuda, T. (1998). Structure of molecular PMid:27178952. association of curdlan at dilute regime in alkaline aqueous systems. Yoo, B., & Rao, M. A. (1996). Creep AND DYNAMIC RHEOLOGICAL Chemical Physics, 228(1), 157-166. http://dx.doi.org/10.1016/S0301- BEHAVIOR OF TOMATO CONCENTRATES: EFFECT OF 0104(97)00343-1. CONCENTRATION AND FINISHER SCREEN SIZE. Journal of Texture Toker, O. S., Karasu, S., Yilmaz, M. T., & Karaman, S. (2015). Three Studies, 27(4), 451-459. http://dx.doi.org/10.1111/j.1745-4603.1996. interval thixotropy test (3ITT) in food applications: A novel technique tb00087.x. to determine structural regeneration of mayonnaise under different Zhong, L., Oostrom, M., Truex, M. J., Vermeul, V. R., & Szecsody, J. E. shear conditions. Food Research International, 70, 125-133. http:// (2013). Rheological behavior of xanthan gum solution related to dx.doi.org/10.1016/j.foodres.2015.02.002. shear thinning fluid delivery for subsurface remediation. Journal of Vardhanabhuti, B., & Ikeda, S. (2006). Isolation and characterization Hazardous Materials, 244-245, 160-170. http://dx.doi.org/10.1016/j. of hydrocolloids from monoi (Cissampelos pareira) leaves. jhazmat.2012.11.028. PMid:23246952. Food Sci. Technol, Campinas, Ahead of Print, 2021 11/11 11
You can also read