MicroED with the Falcon III direct electron detector - bioRxiv
←
→
Page content transcription
If your browser does not render page correctly, please read the page content below
bioRxiv preprint first posted online Apr. 23, 2019; doi: http://dx.doi.org/10.1101/615484. The copyright holder for this preprint
(which was not peer-reviewed) is the author/funder, who has granted bioRxiv a license to display the preprint in perpetuity.
                                    All rights reserved. No reuse allowed without permission.

                     MicroED with the Falcon III
                      direct electron detector
                               1                        1               1
                   Johan Hattne , Michael W. Martynowycz and Tamir Gonen *

   1
    Howard Hughes Medical Institute, Departments of Biological Chemistry and Physiology, David
   Geffen School of Medicine, University of California, Los Angeles, Los Angeles CA 90095 USA
   Abstract
   Microcrystal electron diffraction (MicroED) combines crystallography and electron cryo-
   microscopy (cryo-EM) into a method that can be used for high-resolution structure
   determination. In MicroED nanosized crystals, often intractable by other techniques, are
   probed by high-energy electrons in a transmission electron microscope and the diffracted signal
   is recorded on an electron detector. Since only a small number of different detectors have been
   used for MicroED measurements in the past, their impact on data quality has not been
   investigated. Here we evaluate two different cameras using crystals of the well-characterized
   serine protease proteinase K. Compared to previously used equipment, the Falcon III direct
   electron detector and the CMOS-based CetaD camera can collect complete datasets both faster
   and using lower total exposure. As an effect of the lower dose, radiation damage is reduced,
   which is confirmed in both real and reciprocal space. The increased speed and lower exposure
   requirements have implications on model quality and the prospects for further automation of
   MicroED.

   *Correspondence should be addressed to T.G (tgonen@ucla.edu)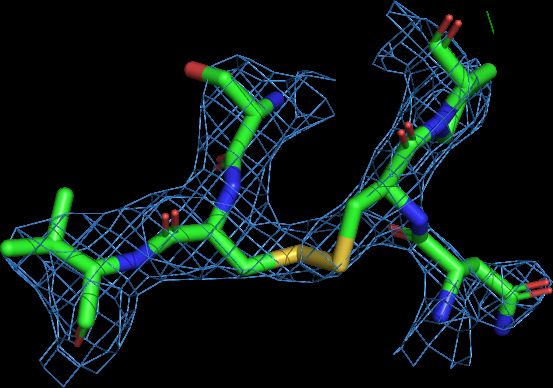
bioRxiv preprint first posted online Apr. 23, 2019; doi: http://dx.doi.org/10.1101/615484. The copyright holder for this preprint
(which was not peer-reviewed) is the author/funder, who has granted bioRxiv a license to display the preprint in perpetuity.
                                    All rights reserved. No reuse allowed without permission.

   Introduction
   Microcrystal electron diffraction (MicroED) is a diffraction method exploiting the strong
   interaction of electrons with matter to determine high-resolution structures from crystallized
   samples (Shi et al., 2013). Owing to the favorable ratio of elastic to inelastic interactions
   (Henderson, 1995), MicroED can be used to collect useful data from crystals that are much
   smaller than required for e.g. X-ray crystallography. This is a significant advantage, since
   obtaining crystals that are both large and sufficiently well-ordered to yield high-resolution
   diffraction data, often constitutes a significant bottleneck in crystallography. Because crystals
   are imaged and screened using the same optical elements that are ultimately used to collect
   diffraction data, the large magnification of a transmission electron microscope (TEM) can be
   leveraged to select crystals with side lengths as small as 50 nm (Rodriguez et al., 2015) . In
   contrast to single-particle cryo-EM, the near-perfect alignment of the molecules in a crystal
   implies that the measured signal is strong enough to yield high-resolution structural
   information from even small peptides or chemical compounds (Jones et al., 2018). MicroED
   thus provides a means to determine structures that are not attainable by other means.
   In MicroED, crystals are continuously rotated in the electron beam of a TEM and a fast camera
   is used to record a shutterless movie of the resulting diffraction patterns (Nannenga et al.,
   2014). A camera for electron diffraction data collection must have a high dynamic range such
   that both low and high pixel values can be accurately recorded on the same frame: while the
   low-resolution spots may be strong enough to approach the upper limit of what a camera can
   measure, the high-resolution spots may be barely discernible over the background.
   Furthermore, under continuous rotation of the sample, the dead time during detector readout
   must be minimal, otherwise systematic gaps will be introduced in the sampling of reciprocal
   space.
   While the majority of cryo-EMs these days are equipped with sensitive direct electron detectors
   for imaging, these cameras have not been used for MicroED because of concerns over damage
   to the sensor by the intense, incident beam. Instead, MicroED data have been collected on
   cameras that are not typically used for routine structure determination in other cryo-EM
   modalities, such as single particle analysis and cryotomograpy. As a result, the number of
   MicroED practitioners has been limited because most facilities do not have the resources to
   provide a dedicated camera for MicroED. If MicroED data can be collected using the very same
   direct electron detectors used for single particle analysis, the number of laboratories with the
   ability to conduct MicroED measurements could increase substantially.
   We collected MicroED data from microcrystals of proteinase K using the Thermo Fisher
   Falcon III direct electron detector in integrating mode and compared the resulting structure to
   results obtained using diffraction-optimized cameras such as the CMOS-based Thermo Fisher
   CetaD. Unlike the regular Ceta camera, the CetaD is fitted with a thicker scintillator to better
   capture weak intensities of high-resolution Bragg spots. We demonstrate that reliable structure
   solution is possible from a typical direct electron detecting camera, and that these cameras may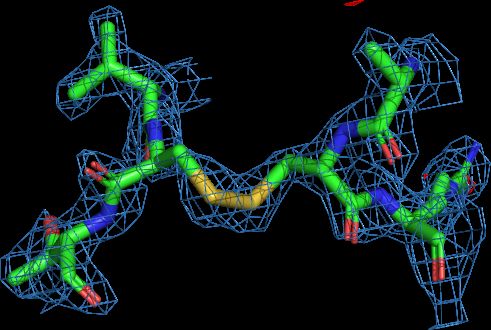
bioRxiv preprint first posted online Apr. 23, 2019; doi: http://dx.doi.org/10.1101/615484. The copyright holder for this preprint
(which was not peer-reviewed) is the author/funder, who has granted bioRxiv a license to display the preprint in perpetuity.
                                    All rights reserved. No reuse allowed without permission.

   even offer some advantages over those specifically designed for diffraction experiments. In
   order to facilitate this work, we developed the necessary software tools to convert the
   collected images from the Falcon III and CetaD into images that can be processed in standard
   data reduction suites such as DIALS (Winter et al., 2018), MOSFLM (Leslie and Powell, 2007),
   and XDS (Kabsch, 2010). This software has been made freely available via our website
   (https://cryoem.ucla.edu/MicroED).
   Results
   We collected data from six crystals of proteinase K: three measured in integrating mode on the
   Falcon III, and three on the CetaD (Table 1). Both cameras were configured for 2×2 binning,
   yielding 2048×2048 px2 frames; for proteinase K diffracting to ~2 Å resolution, this results in a
   4-fold reduction of the data volume without causing detrimental spot overlap. On the CetaD
   camera in particular, the thicker scintillator is intended to trade spatial resolution for increased
   sensitivity. This modification is tailored towards diffraction measurements, where sensitivity is
   more important than spatial resolution. It also means that unbinned data offers little advantage
   on the CetaD (Tinti et al., 2018).
   Using the Falcon III, 129 frames were collected from each crystal as 1 s exposures while
   continuously rotating the stage, whereas up to 71 frames were collected from CetaD. The
   exposure time for the crystals measured on the CetaD varied between 1.55 s and 3.06 s. In all
   cases the stage was rotated towards zero tilt, but the tilt rates were correspondingly higher on
   the Falcon III (0.45° s-1) than on the CetaD (0.30° s-1). Data were integrated to the edge of the
   detector (2.1 Å for Falcon III, 2.3–2.8 Å for CetaD), and all crystals were measured with an
   estimated exposure rate of 0.01 e- Å-2 s-1 at an acceleration voltage of 200 kV. For comparison,
   data previously collected from proteinase K on a TVIPS TemCam-F416 under otherwise similar
   conditions (Hattne et al., 2018) used significantly longer exposures (4–5 s), with
   correspondingly slower rotation rates (0.09° s-1).
   With the Falcon III and the CetaD, data can be collected an order of magnitude faster compared
   to previous protocols for proteinase K (Hattne et al., 2016, 2018; de la Cruz et al., 2017). The
   increased sensitivity allows the per-frame exposure to be reduced during data collection
   because fewer electrons are required to obtain a sufficiently strong signal over the noise of the
   background. Combined with the faster readout rate, this implies that complete datasets can be
   collected both faster and using lower total exposure than previously possible. While the precise
   relationship between exposure and absorbed dose also depends on chemical composition,
   longer exposures always increase the absorbed dose. Since absorbed dose is directly related to
   radiation damage, the ability to obtain complete datasets with fewer e- Å-2 is expected to
   translate to final models of proteins that are less damaged.
   One of the first noticeable effects of radiation damage is the exponential falloff of intensity with
   increasing exposure (Blake and Phillips, 1962; Liebschner et al., 2015; Hattne et al., 2018),
   commonly characterized by the dose at which the average integrated intensity has dropped
   below some threshold. The rate of the intensity reduction is dependent on the sample, both its
   chemical composition and the size of the illuminated crystal (Nave and Hill, 2005), but should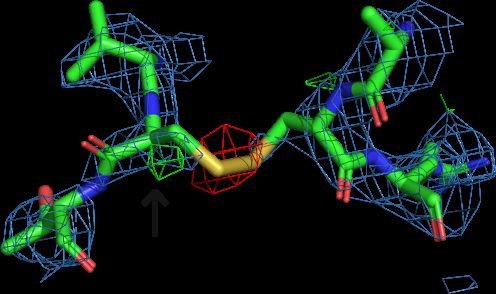
bioRxiv preprint first posted online Apr. 23, 2019; doi: http://dx.doi.org/10.1101/615484. The copyright holder for this preprint
(which was not peer-reviewed) is the author/funder, who has granted bioRxiv a license to display the preprint in perpetuity.
All rights reserved. No reuse allowed without permission.
be unaffected by the detector. For proteinase K measured on the Falcon III and CetaD, the
intensity has fallen to 50% of its extrapolated value at zero dose once exposed to 2.5 and 1.6 e-
Å-2, respectively (Figure 1(a)). These values agree with D50 = 2.2 e- Å-2 previously found for the
same sample measured on a TVIPS TemCam-F416 (Hattne et al., 2018), and indicate that
microscope and camera parameters are adequately calibrated.
Figure 1(b) compares the completeness as a function of exposure. For three crystals, a total
exposure of 0.97 e- Å-2 frames was needed to reach 95% completeness on the CetaD, whereas
only 0.72 e- Å-2 were needed for the Falcon III. Both these exposures are significantly lower than
the 1.57 e- Å-2 previously required to reach the same completeness on the TVIPS TemCam-F416
(Hattne et al., 2018).
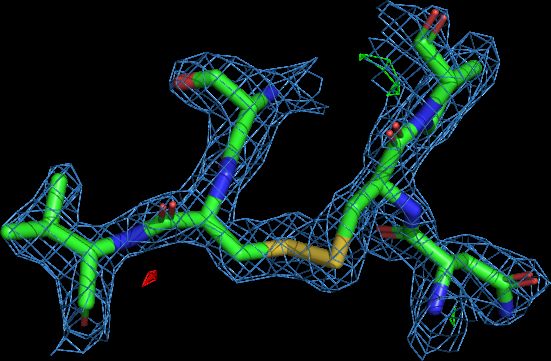
The manifestation of damage in real space similarly agrees with previous observations. Figure 2
shows the density around the two disulfide bonds in proteinase K, where damage to the
Cys 283–Cys 354 bond is immediately apparent in the data collected on the CetaD (total
exposure 1.6 e- Å-2). In comparison, the total exposure for the data collected on the Falcon III is
about half (0.8 e- Å-2). At this level of detail, damage to the disulfide bonds cannot be observed
in the data collected on the Falcon III, even though the model was refined against higher
resolution data, which is known to be affected by radiation damage earlier (Table 1).
The modulation transfer function (MTF) at half Nyquist is higher on the Falcon III (0.25) than on
the CetaD (0.06) (Kuijper et al., 2015). Since the MTF is the modulus of the Fourier transform of
the point-spread function (PSF), a higher MTF is expected to translate to sharper diffraction
spots on the Falcon III. While the differences in spot size are barely discernible by visual
inspection of the rocking curves (Figure 3), the differences are revealed by comparing the area
of an asymmetric, two-dimensional Gaussian function fitted to the pixel values around each
predicted spot location. The spot areas are weakly correlated with resolution, hence only spots
in the resolution interval common to all datasets (20.0–2.7 Å) were considered. While the
counts on the Falcon III are about an order of magnitude lower than on the CetaD, the average
spot on the Falcon III is sharper than on the CetaD, and the area distribution is more peaked
(Table 2, Figure 4).
Conclusion
The higher sensitivity and readout rate of the Falcon III and CetaD cameras allow complete
datasets to be collected faster and with lower total exposure. The average time to record a
single dataset from Proteinase K was less than half the time previously required to collect
similar low-dose datasets (Hattne et al., 2018). With the Falcon III and CetaD cameras, this can
be accomplished without increasing the total dose deposited to the sample, thus keeping
radiation damage minimal. In fact, the average exposure for the data merged from the Falcon III
is also less than half of what was used for the TVIPS TemCam-F416.
Compared to the camera previously used to collect most of the MicroED data, both the
Falcon III and the CetaD exhibit a higher modulation transfer function. This is true even for thebioRxiv preprint first posted online Apr. 23, 2019; doi: http://dx.doi.org/10.1101/615484. The copyright holder for this preprint
(which was not peer-reviewed) is the author/funder, who has granted bioRxiv a license to display the preprint in perpetuity.
All rights reserved. No reuse allowed without permission.
CetaD with its thicker scintillator layer. A higher MTF, or equivalently, a narrower PSF, is
expected to translate to a higher signal-to-noise ratio, as the diffraction peak is focused to a
smaller area and becomes easier to distinguish over the background. It does, however, not
necessarily imply a higher value of ⟨I/σ(I)⟩ (Table 1). Ideally, the mean ratio of the integrated
intensity to its standard deviation is independent of the spot area, since all pixels in the peak
are considered for the integrated intensity. In practice, the observed signal-to-noise ratio
requires the per-pixel gain of the detector to be known to high accuracy (Leslie, 2006), which
has been difficult to accomplish on the cameras used here. The signal-to-noise ratio is also
affected by factors unrelated to the camera: for instance, the weak, high-resolution reflections
will skew the distribution towards lower values for well-diffracting samples. Indeed, ⟨I/σ(I)⟩ is
lower for the higher-resolution datasets collected on the Falcon III compared to the datasets
measured on the CetaD (Table 1), even though the average peak height relative to the variance
of the background is almost twice as high (Table 2).
The Falcon III camera implements an electron-counting mode in addition to the integrating
mode used to collect the data here. Electron-counting has the potential for measuring data at
near-optimal detective quantum efficiency (McMullan, Faruqi and Henderson, 2016), but
requires that data collection is carefully designed to prevent saturating individual per-pixel
counters. In particular, electron counting presents a formidable challenge for diffraction data,
where the camera must accurately represent both high and low pixel counts. Since it is
conceivable that the flux could be reduced, and the data collection correspondingly prolonged,
future work is aimed to make electron-counting a feasible mode of data collection for MicroED.
Our results demonstrate that the typical direct electron detectors used for other cryo-EM
modalities can also be used for MicroED alleviating the need for additional dedicated cameras.
Compared to cameras used previously, the Falcon III and CetaD offer the possibility to collect
complete data at lower exposure in a shorter amount of time. This has immediate implications
for efforts to automate MicroED data collection (Jason de la Cruz et al., 2019), where efficient
use of shared resources may be a major concern, but also leads to structural models with
limited or little radiation damage. For example, combining MicroED data collection in SerialEM
(Jason de la Cruz et al., 2019) with a Falcon III direct electron detector can result in more than
300 complete data sets collected autonomously overnight and this level of productivity is
commensurate with X-ray crystallography at synchrotrons. As MicroED is gaining momentum in
the cryoEM field that is already undergoing rapid changes, developing the MicroED data
collection protocols and software analysis tools to optimally use new hardware will be a priority
for the immediate future.
Software availability
Software tools to convert the native output format, both MRC (Cheng et al., 2015) and TIA
series files, to SMV or TIFF, are available from https://cryoem.ucla.edu/MicroED and will be
included in an upcoming release of the rebranded MicroED tools. The updated version also
contains programs to directly convert data collected with SerialEM (Jason de la Cruz et al.,
2019).bioRxiv preprint first posted online Apr. 23, 2019; doi: http://dx.doi.org/10.1101/615484. The copyright holder for this preprint
(which was not peer-reviewed) is the author/funder, who has granted bioRxiv a license to display the preprint in perpetuity.
All rights reserved. No reuse allowed without permission.
Methods
Proteinase K from E. album (Sigma-Aldrich, St Louis, MO, USA) was used without further
purification to grow crystals in sittings drops (Hattne et al., 2016). Protein powder dissolved in
50 mM Tris-HCl pH 8 was mixed with equal amounts of 1.25 M ammonium sulfate and
dispensed in 24-well plates, where crystals with an average size of ~50 µm appeared in less
than one hour. Sittings drops were diluted with well solution to a final volume of ~25 µl, and
crystals, all from the same batch, were placed on glow-discharged Quantifoil R2/2 Cu300 grids
by pipetting 2 µl onto the carbon side. After blotting from the back for 5 s at 4°C and 100%
environment humidity, grids were vitrified and transferred to liquid nitrogen.
MicroED data were collected in an FEI Talos Arctica transmission electron microscope at an
acceleration voltage of 200 kV. The temperature was maintained atbioRxiv preprint first posted online Apr. 23, 2019; doi: http://dx.doi.org/10.1101/615484. The copyright holder for this preprint
(which was not peer-reviewed) is the author/funder, who has granted bioRxiv a license to display the preprint in perpetuity.
All rights reserved. No reuse allowed without permission.
Tables
Table 1: Processing and refinement statistics for proteinase K recorded on the Falcon III and CetaD cameras. D is the virtual
sample–detector distance, which corresponds to the physical distance in an otherwise equivalent lensless system, and texp
denotes the exposure time per frame during data collection. Note that not all collected frames were merged, and this is reflected
in , the mean cumulative irradiated time of all the frames in a multicrystal dataset. The average exposure, , is
thus related to by a multiplicative factor. Numbers in parentheses refer to the highest-resolution shell for merging. All
data were collected at an acceleration voltage of 200 kV.
Falcon III CetaD
D (mm) 2380 2380 2380 3200 3200 2660
texp (s) 1.00 1.00 1.00 3.06 3.05 1.55
Rotation rate 0.45 0.45 0.45 0.30 0.30 0.30
(° s-1)
(s) 40.0 66.0
0.40 0.66
(e- Å-2)
Resolution 27.64–2.10 (2.16–2.10) 28.58–2.70 (2.83–2.70)
Rmerge 0.479 (1.612) 0.414 (2.014)
# 73,941 (3,646) 36,914 (4,061)
observations
# unique 13,802 (1,053) 6,631 (838)
⟨I/σ(I)⟩ 3.1 (1.0) 4.2 (1.0)
CC1/2 0.907 0.917
Completeness 97.3 (92.6) 99.6 (99.0)
Multiplicity 5.4 (3.5) 5.6 (4.8)
Rwork / Rfree 22.79 / 26.99 21.69 / 27.96
R.m.s. bond 0.0079 0.0055
lengths
R.m.s. bond 1.4766 1.3214
angles
Table 2: The ratio of peak height to the standard deviation in an annulus around the fitted peak is higher for the Falcon III
than for the CetaD. The standard deviation was calculated from the pixel values in an elliptical annulus around the fitted peak,
with inner diameters determined by the size of the fitted peak and outer diameters 4 px larger. Peaks were fitted as described in
the caption of Figure 4.
Falcon III CetaD
Mean spot area (px ) 2
20±45 36±60
Height of fitted peak (ADU) 28±191 376±769
Standard deviation around 3.3±1.8 73±38
peak (ADU)
Height / Standard deviation 8.9±127 4.5±10.6bioRxiv preprint first posted online Apr. 23, 2019; doi: http://dx.doi.org/10.1101/615484. The copyright holder for this preprint
(which was not peer-reviewed) is the author/funder, who has granted bioRxiv a license to display the preprint in perpetuity.
All rights reserved. No reuse allowed without permission.
Figures
Figure 1: Mean intensity and completeness as a function of exposure. (a) For each camera, the integrated intensities on the
subset of frames in the [-30°, +30°] tilt range were averaged; this reduces systematic effects on the intensities arising from
longer paths through the sample at higher tilt. The reflections in the resolution range common to all datasets (20.0–2.70 Å) were e
then fit to a function on the form Acryst exp(-Bcam × x), where Acryst was refined for each crystal and Bcam was refined for each
camera. The dotted vertical lines indicate the exposure at which 95% completeness was obtained. (b) The exposure-dependency
of the completeness is determined by merging only frames with an average exposure less than the given value. The dotted
horizontal line marks 95% completeness.
Figure 2:Density around the two disulfide bonds in proteinase K. The density around the two disulfide bonds indicates
increasing radiation damage as an effect of increasing dose. The positive difference density around Cβ of Cys 283 (black arrow)
indicates a partially dislocated sulfur atom. The 2mFo-DFc densities (blue meshes) are contoured at 1.5 σ above the mean, mFo-
DFc difference densities (green/red meshes) are contoured at ±3 σ around the mean. All meshes were carved to 2 Å around the
selected atoms in PyMol (Schrödinger LLC, 2014).
Figure 3:The (10, 16, 12) reflection at ~3.3 Å resolution on consecutive frames. Pixel values recorded on the Falcon III (top row;
rotation range Δφ = 0.45° per frame) and the CetaD (bottom row; rotation range Δφ = 0.46° per frame) camera. The rightmost
panel in each row shows the profile-fitted intensities as integrated by MOSFLM, where the error bars span one standard
deviation. Constant pedestals were added in the conversion from the native camera format: the offset was 8 ADU for the
Falcon III, and 128 ADU for the CetaD. The physical pixels sizes on both cameras are identical (14 µm, square). Note that the
peak counts on the CetaD are more than an order of magnitude higher than on the Falcon III.
Figure 4:Histogram of the area of strong spots. The spot area, π σx σy, determined by fitting a two-dimensional, elliptical
x R Σ Rx
Gaussian function A × exp(-
T T -2
R Σ
/ 2) + B, where is a rotation matrix, is a diagonal matrix of standard deviations σx and
d
σy, and A and B are scalars. All pixels in a 21×21 px2 box around the integrated spots for the Falcon III (orange) and CetaD (blue)
cameras were considered in the fit. To control for the effect of resolution on the fitted spot sizes, only spots in the common
resolution interval 20.0–2.7 Å resolution interval were considered. The counts for spots where the fit converged are scaled to
equal area (NFalcon III = 82,117 and NCetaD = 68,654).
Acknowledgements
The Gonen laboratory is funded by the Howard Hughes Medical Institute. We thank Lingbo Yu
(Thermo Fisher) for helpful discussions.
References
Battye, T. G. G., Kontogiannis, L., Johnson, O., Powell, H. R. and Leslie, A. G. W. (2011)
‘iMOSFLM: a new graphical interface for diffraction-image processing with MOSFLM.’, Acta
crystallographica. Section D, Biological crystallography . International Union of Crystallography,
67(Pt 4), pp. 271–81. doi: 10.1107/S0907444910048675.
Blake, C. C. F. and Phillips, D. C. (1962) ‘Effects of X-irradiation on single crystals of myoglobin’.
The Royal Institution, London, England., pp. 183–191.
Cheng, A., Henderson, R., Mastronarde, D., Ludtke, S. J., Schoenmakers, R. H. M., Short, J.,
Marabini, R., Dallakyan, S., Agard, D. and Winn, M. (2015) ‘MRC2014: Extensions to the MRC
format header for electron cryo-microscopy and tomography’, Journal of Structural Biology .
Elsevier Inc., 192(2), pp. 146–150. doi: 10.1016/j.jsb.2015.04.002.
Clabbers, M. T. B., Gruene, T., Parkhurst, J. M., Abrahams, J. P. and Waterman, D. G. (2018)bioRxiv preprint first posted online Apr. 23, 2019; doi: http://dx.doi.org/10.1101/615484. The copyright holder for this preprint
(which was not peer-reviewed) is the author/funder, who has granted bioRxiv a license to display the preprint in perpetuity.
All rights reserved. No reuse allowed without permission.
‘Electron diffraction data processing with DIALS’, Acta Crystallographica Section D Structural
Biology. International Union of Crystallography, 74(6), pp. 506–518. doi:
10.1107/S2059798318007726.
Emsley, P., Lohkamp, B., Scott, W. G. and Cowtan, K. (2010) ‘Features and development of
Coot.’, Acta crystallographica. Section D, Biological crystallography. International Union of
Crystallography, 66(Pt 4), pp. 486–501. doi: 10.1107/S0907444910007493.
Evans, P. R. and Murshudov, G. N. (2013) ‘How good are my data and what is the resolution?’,
Acta Crystallographica Section D Biological Crystallography. International Union of
Crystallography, 69(7), pp. 1204–1214. doi: 10.1107/S0907444913000061.
Grosse-Kunstleve, R. W., Sauter, N. K., Moriarty, N. W. and Adams, P. D. (2002) ‘The
Computational Crystallography ToolboxX: crystallographic algorithms in a reusable software
framework’, Journal of Applied Crystallography. International Union of Crystallography, 35(1),
pp. 126–136. doi: 10.1107/S0021889801017824.
Hattne, J., Shi, D., Glynn, C., Zee, C., Gallagher-Jones, M., Martynowycz, M. W., Rodriguez, J. A.
and Gonen, T. (2018) ‘Analysis of Global and Site-Specific Radiation Damage in Cryo-EM’,
Structure. Elsevier, 26(5), p. 759–766.e4. doi: 10.1016/j.str.2018.03.021.
Hattne, J., Shi, D., de la Cruz, M. J., Reyes, F. E. and Gonen, T. (2016) ‘Modeling truncated pixel
values of faint reflections in MicroED images’, Journal of Applied Crystallography, 49(3), pp.
1029–1034. doi: 10.1107/S1600576716007196.
Henderson, R. (1995) ‘The potential and limitations of neutrons, electrons and X-rays for atomic
resolution microscopy of unstained biological molecules’, Quarterly Reviews of Biophysics,
28(02), p. 171. doi: 10.1017/S003358350000305X.
Jason de la Cruz, M., Martynowycz, M. W., Hattne, J. and Gonen, T. (2019) ‘MicroED data
collection with SerialEM’, Ultramicroscopy. Elsevier B.V., 201(January), pp. 1–4. doi:
10.1016/j.ultramic.2019.03.009.
Jones, C. G., Martynowycz, M. W., Hattne, J., Fulton, T. J., Stoltz, B. M., Rodriguez, J. A., Nelson,
H. M. and Gonen, T. (2018) ‘The CryoEM Method MicroED as a Powerful Tool for Small
Molecule Structure Determination’, ACS Central Science. American Chemical Society, 4(11), pp.
1587–1592. doi: 10.1021/acscentsci.8b00760.
Kabsch, W. (2010) ‘XDS.’, Acta crystallographica. Section D, Biological crystallography, 66(Pt 2),
pp. 125–32. doi: 10.1107/S0907444909047337.
Kuijper, M., van Hoften, G., Janssen, B., Geurink, R., De Carlo, S., Vos, M., van Duinen, G., van
Haeringen, B. and Storms, M. (2015) ‘FEI’s direct electron detector developments: Embarking
on a revolution in cryo-TEM’, Journal of Structural Biology. Elsevier Inc., 192(2), pp. 179–187.
doi: 10.1016/j.jsb.2015.09.014.
de la Cruz, M. J., Hattne, J., Shi, D., Seidler, P., Rodriguez, J., Reyes, F. E., Sawaya, M. R., Cascio,
D., Weiss, S. C., Kim, S. K., Hinck, C. S., Hinck, A. P., Calero, G., Eisenberg, D. and Gonen, T.
(2017) ‘Atomic-resolution structures from fragmented protein crystals with the cryoEM method
MicroED’, Nature Methods. Nature Publishing Group, 14(4), pp. 399–402. doi:
10.1038/nmeth.4178.
Leslie, A. G. W. (2006) International Tables for Crystallography, International Tables for
Crystallography Volume F: Crystallography of biological macromolecules. Edited by M. G.
Rossmann and E. Arnold. Chester, England: International Union of Crystallography
(International Tables for Crystallography). doi: 10.1107/97809553602060000106.bioRxiv preprint first posted online Apr. 23, 2019; doi: http://dx.doi.org/10.1101/615484. The copyright holder for this preprint
(which was not peer-reviewed) is the author/funder, who has granted bioRxiv a license to display the preprint in perpetuity.
All rights reserved. No reuse allowed without permission.
Leslie, A. G. W. and Powell, H. R. (2007) ‘Processing diffraction data with mosflm’, in Read, R. J.
and Sussman, J. L. (eds) Evolving Methods for Macromolecular Crystallography. Dordrecht:
Springer Netherlands (NATO Science Series II: Mathematics, Physics and Chemistry), pp. 41–51.
doi: 10.1007/978-1-4020-6316-9_4.
Liebschner, D., Rosenbaum, G., Dauter, M. and Dauter, Z. (2015) ‘Radiation decay of thaumatin
crystals at three X-ray energies’, Acta Crystallographica Section D: Biological Crystallography.
International Union of Crystallography, 71, pp. 772–778. doi: 10.1107/S1399004715001030.
McMullan, G., Faruqi, A. R. and Henderson, R. (2016) ‘Direct Electron Detectors’, in The
Resolution Revolution: Recent Advances In cryoEM. 1st edn. Elsevier Inc., pp. 1–17. doi:
10.1016/bs.mie.2016.05.056.
Murshudov, G. N., Skubák, P., Lebedev, A. a, Pannu, N. S., Steiner, R. a, Nicholls, R. a, Winn, M.
D., Long, F. and Vagin, A. a (2011) ‘REFMAC5 for the refinement of macromolecular crystal
structures.’, Acta crystallographica. Section D, Biological crystallography, 67(Pt 4), pp. 355–67.
doi: 10.1107/S0907444911001314.
Nannenga, B. L., Shi, D., Leslie, A. G. W. and Gonen, T. (2014) ‘High-resolution structure
determination by continuous-rotation data collection in MicroED’, Nature Methods, 11(9), pp.
927–930. doi: 10.1038/nmeth.3043.
Nave, C. and Hill, M. A. (2005) ‘Will reduced radiation damage occur with very small crystals?’,
Journal of synchrotron radiation, 12(Pt 3), pp. 299–303. doi: 10.1107/S0909049505003274.
Oliphant, T. E. (2007) ‘Python for Scientific Computing’, Computing in Science & Engineering,
9(3), pp. 10–20. doi: 10.1109/MCSE.2007.58.
Pflugrath, J. W. (1999) ‘The finer things in X-ray diffraction data collection’, Acta
Crystallographica Section D Biological Crystallography, 55(10), pp. 1718–1725. doi:
10.1107/S090744499900935X.
Rodriguez, J. A., Ivanova, M. I., Sawaya, M. R., Cascio, D., Reyes, F. E., Shi, D., Sangwan, S.,
Guenther, E. L., Johnson, L. M., Zhang, M., Jiang, L., Arbing, M. A., Nannenga, B. L., Hattne, J.,
Whitelegge, J., Brewster, A. S., Messerschmidt, M., Boutet, S., Sauter, N. K., Gonen, T. and
Eisenberg, D. S. (2015) ‘Structure of the toxic core of α-synuclein from invisible crystals’,
Nature, 525(7570), pp. 486–490. doi: 10.1038/nature15368.
Schrödinger LLC (2014) ‘The PyMOL Molecular Graphics System’. Available at:
https://www.pymol.org.
Shi, D., Nannenga, B. L., Iadanza, M. G. and Gonen, T. (2013) ‘Three-dimensional electron
crystallography of protein microcrystals’, eLife, 2, p. e01345. doi: 10.7554/eLife.01345.
Tinti, G., Fröjdh, E., van Genderen, E., Gruene, T., Schmitt, B., de Winter, D. A. M., Weckhuysen,
B. M. and Abrahams, J. P. (2018) ‘Electron crystallography with the EIGER detector’, IUCrJ, 5(2),
pp. 190–199. doi: 10.1107/S2052252518000945.
Vagin, A. and Teplyakov, A. (1997) ‘MOLREPX: an Automated Program for Molecular
Replacement’, Journal of Applied Crystallography. International Union of Crystallography, 30(6),
pp. 1022–1025. doi: 10.1107/S0021889897006766.
Winter, G., Waterman, D. G., Parkhurst, J. M., Brewster, A. S., Gildea, R. J., Gerstel, M., Fuentes-
Montero, L., Vollmar, M., Michels-Clark, T., Young, I. D., Sauter, N. K. and Evans, G. (2018)
‘DIALSX: implementation and evaluation of a new integration package’, Acta Crystallographica
Section D Structural Biology. International Union of Crystallography, 74(2), pp. 85–97. doi:
10.1107/S2059798317017235.bioRxiv preprint first posted online Apr. 23, 2019; doi: http://dx.doi.org/10.1101/615484. The copyright holder for this preprint
(which was not peer-reviewed) is the author/funder, who has granted bioRxiv a license to display the preprint in perpetuity.
All rights reserved. No reuse allowed without permission.1.0 100
Falcon III
0.9 CetaD
TemCam-F416 80
Completeness (%)
0.8
60
⟨In⟩ / ⟨I0⟩
Falcon III
0.7 CetaD
40 TemCam-F416
0.6
20
0.5
0.4 0
0.0 0.2 0.4 0.6 0.8 1.0 1.2 1.4 1.6 1.8 2.0 0.0 0.4 0.8 1.2 1.6
Exposure (e- Å-2) Exposure (e- Å-2)
(a) (b)Falcon III CetaD Cys 139–Cys 228 Cys 283–Cys 354
bioRxiv preprint first posted online Apr. 23, 2019; doi: http://dx.doi.org/10.1101/615484. The copyright holder for this preprint
(which was not peer-reviewed) is the author/funder, who has granted bioRxiv a license to display the preprint in perpetuity.
All rights reserved. No reuse allowed without permission.4
Falcon III
CetaD
3
Population (%)
2
1
0
5 10 15 20
Fitted spot area (px2)You can also read